
Market Overview
| Study Period | 2020 - 2031 |
|---|---|
| Market Size (2026) | USD 16.47 Billion |
| Market Size (2031) | USD 20.74 Billion |
| Growth Rate (2026 - 2031) | 4.72 % |
| Fastest Growing Market | Asia Pacific |
| Largest Market | Asia Pacific |
| Market Concentration | Medium |
Major Players *Disclaimer: Major Players sorted in no particular order Image © Mordor Intelligence. Reuse requires attribution under CC BY 4.0. | |
Metal Cleaning Chemicals Market Analysis by Mordor Intelligence
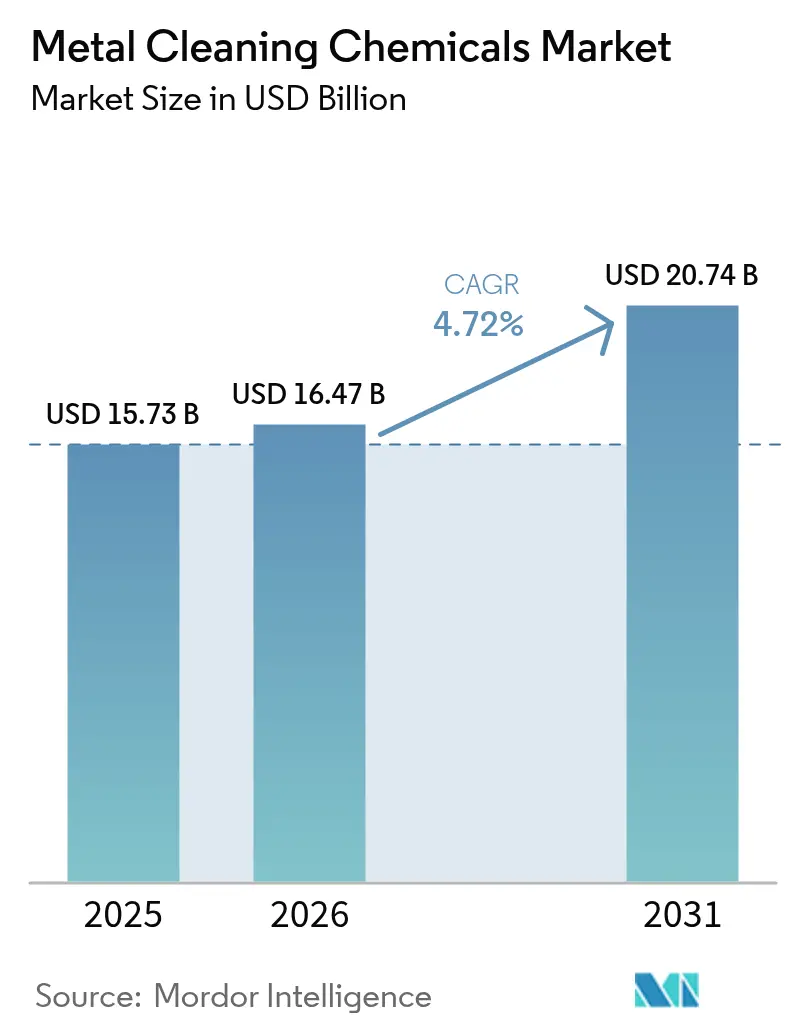
Metal Cleaning Chemicals market size in 2026 is estimated at USD 16.47 Billion, growing from 2025 value of USD 15.73 Billion with 2031 projections showing USD 20.74 Billion, growing at 4.72% CAGR over 2026-2031. Regulatory bans on perchloroethylene in the United States and tighter PFAS restrictions in Europe accelerate the shift from solvent‐based to aqueous solutions, prompting rapid product reformulation among suppliers [1]. Asia-Pacific remains the principal demand center because semiconductor fabrication, steel pickling, and automotive component production concentrate heavily in China, South Korea, and India. Investments in automated parts-washing systems are growing, and automotive, aerospace, and medical-device manufacturers now prefer cleaning formulations that integrate sensors for process control. Meanwhile, sustainability certifications like BASF’s biomass balance approach differentiate premium offerings and help global suppliers defend margins amid raw-material cost volatility.
Key Report Takeaways
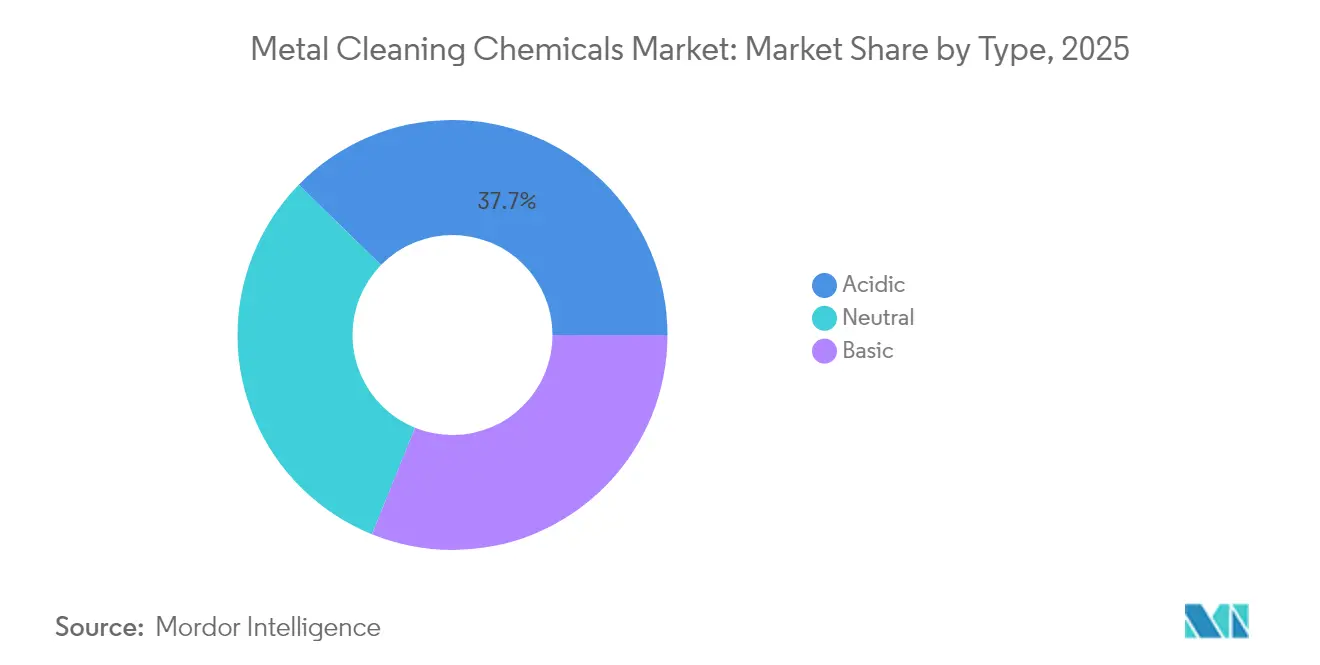
- By type, acidic cleaners accounted for 37.68% of the Metal Cleaning Chemicals market share in 2025, while the same segment is projected to log the fastest 5.56% CAGR through 2031.
- By form, aqueous formulations led with 54.62% revenue share in 2025 and are expected to post a 5.34% CAGR to 2031.
- By metal type, steel and ferrous alloys dominated at 44.92% share in 2025, whereas aluminum and light alloys are poised for the quickest 5.47% CAGR over the forecast window.
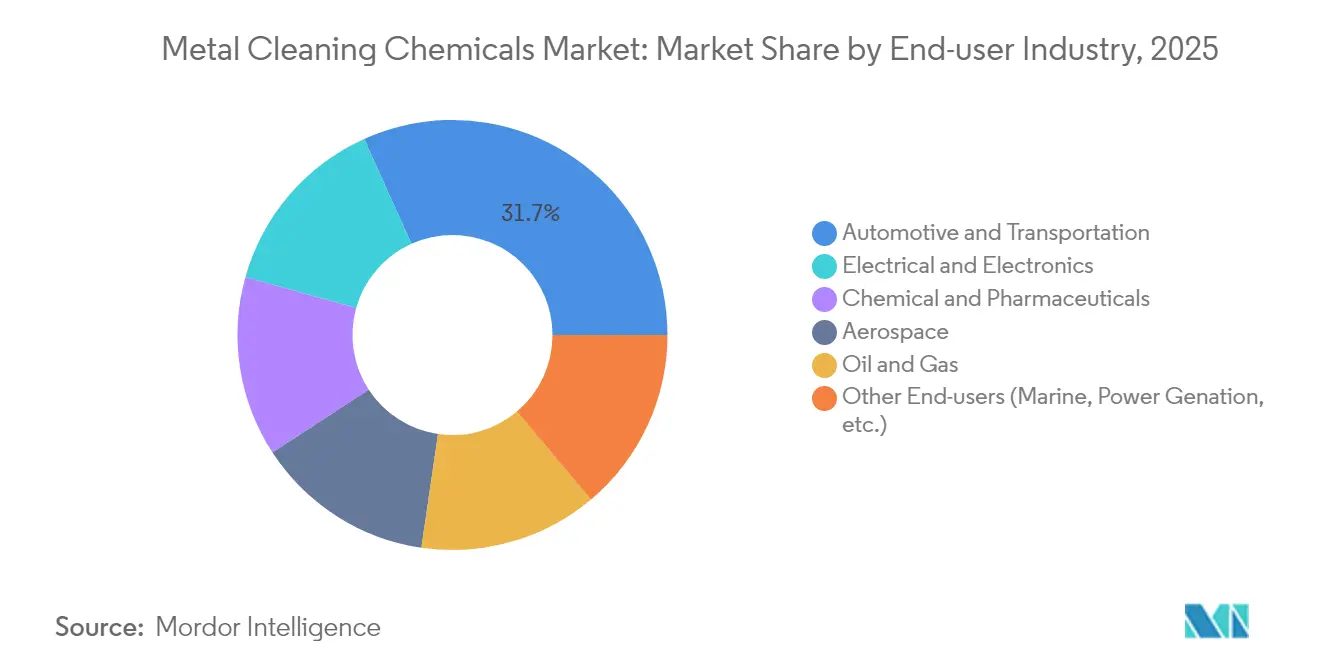
- By end-user industry, automotive held 31.74% of the Metal Cleaning Chemicals market size in 2025, while electrical and electronics manufacturing will expand the fastest at 5.41% CAGR.
- By geography, Asia-Pacific captured 41.88% revenue share in 2025 and is projected to grow at a 5.18% CAGR through 2031.
Note: Market size and forecast figures in this report are generated using Mordor Intelligence’s proprietary estimation framework, updated with the latest available data and insights as of 2026.
Market Trends and Insights
Drivers Impact Analysis of Metal Cleaning Chemicals Market*
| Driver | (~) % Impact on CAGR Forecast | Geographic Relevance | Impact Timeline |
|---|---|---|---|
| Surging Demand from Precision Manufacturing | +1.2% | Global, with concentration in Asia-Pacific and North America | Medium term (2-4 years) |
| Shift Toward Aqueous & Low-Volatile Organic Compound (VOC) Formulations | +0.8% | North America & EU, expanding to Asia-Pacific | Long term (≥ 4 years) |
| Expansion of Aerospace Maintenance, Repair, and Overhaul (MRO) Capacity | +0.6% | Global, with early gains in India, North America, Europe | Medium term (2-4 years) |
| Increase in Automated Parts‐washing in Industry | +0.4% | APAC core, spill-over to North America and Europe | Long term (≥ 4 years) |
| Original Equipment Manufacturer (OEM)-backed Switch to Hydrogen-based Steel Pickling | +0.3% | Global, with early adoption in Europe and North America | Long term (≥ 4 years) |
| Source: Mordor Intelligence | |||
Surging Demand from Precision Manufacturing
Global tolerance targets continue to tighten, especially in semiconductor packaging, electric-vehicle drivetrain assemblies, and high-speed medical devices. Newer machining lines integrate closed-loop feedback systems that detect surface contamination at sub-micron levels; as a result, consumption of ultra-pure alkaline and acidic blends has surged. Manufacturers also demand low-foaming, no-residue chemistries that remain effective in ultrasonic tanks to avoid redeposition and to improve first-pass yield. Precision medical parts, which cannot tolerate chloride residues, are increasingly cleaned with hydrogen-peroxide-activated solutions that leave no ionic trace and meet International Organization for Standardization (ISO) 13485 validation requirements.
Shift Toward Aqueous & Low-Volatile Organic Compound (VOC) Formulations
Environmental regulations accelerate the transition from solvent-based to aqueous cleaning systems, fundamentally altering market dynamics and competitive positioning. The Environmental Protection Agency (EPA)'s December 2024 perchloroethylene ban eliminates a cornerstone solvent within three years, forcing manufacturers to adopt water-based alternatives despite higher energy requirements and process complexity. BASF’s EcoBalanced grades of cocoamidopropyl betaine illustrate the trend; biomass balance accounting trims product carbon footprints without compromising detergency [2]. Although energy use rises in heated spray washers, line operators report 22% reductions in reportable Volatile Organic Compounds (VOCs), sufficient to avoid Title V permitting in several United States states.
Expansion of Aerospace Maintenance, Repair, and Overhaul (MRO) Capacity
India’s commercial fleet is projected to add 2,835 aircraft over two decades, catalyzing domestic engine-overhaul demand. Maintenance, Repair, and Overhaul (MRO) facilities must remove baked-on carbon deposits, oxidation layers, and thermal-barrier coatings without etching nickel-based superalloys. New chelating agents formulated for pH 6.5-7.0 conditions are gaining share because they strip oxidation yet remain non-aggressive toward intricate cooling holes. The United States and European operators, facing Environmental, Social, and Governance (ESG) audits, now prioritize formulations that are free of boron and chromates, accelerating supplier research and development (R&D) pipelines. Suppliers able to pair chemistry with dosing hardware capture long-term service contracts that stabilize revenue streams across volatile airframe cycles.
Increase in Automated Parts-washing in Industry
Industry 4.0 investments embed parts washers directly into machining cells, eliminating manual transfer and reducing labor time by up to 40%. Ultrasonic and spray-in-air platforms equipped with Programmable Logic Controller (PLC) interfaces track bath parameters and trigger dosages automatically. Formulators are incorporating anti-foam agents that resist shear degradation, extending bath life to 25 operating days versus 15 for legacy products. Automation also tightens surface-cleanliness specification thresholds, favoring multi-metal-safe blends that clean steel, aluminum, and magnesium in a single step. In Asia-Pacific, where automotive and appliance build rates continue to climb, new tier-1 suppliers retrofitting automated washers represent a major incremental demand tier for the metal cleaning chemicals market.
Restraints Impact Analysis of Metal Cleaning Chemicals Market*
| Restraint | % Impact on CAGR Forecast | Geographic Relevance | Impact Timeline |
|---|---|---|---|
| Worker Exposure Limits on Certain Solvents | -0.7% | Global, with stricter enforcement in North America and Europe | Short term (≤ 2 years) |
| Volatile Raw-material Prices | -0.5% | Global, with acute impact in emerging markets | Short term (≤ 2 years) |
| Ultrapure Water Scarcity in Semiconductor Hubs | -0.4% | Asia-Pacific semiconductor clusters, expanding to North America | Medium term (2-4 years) |
| Source: Mordor Intelligence | |||
Worker Exposure Limits on Certain Solvents
Tighter occupational exposure limits on trichloroethylene and other halogenated solvents compress margins because alternate chemistries often require longer dwell times and higher process temperatures. Facilities that retain solvent lines must install local exhaust ventilation, personal monitoring, and medical surveillance, raising compliance expenditure. The January 2025 inclusion of additional hazardous substances in the European REACH Candidate List introduces authorization fees for several glycol-ether ingredients, forcing formulators to redesign blends [3]. State-level per- and polyfluoroalkyl substances (PFAS) bans on cleaning products in Minnesota and California, effective 2025, further fragment the United States regulatory landscape and complicate inventory management for multinational suppliers.
Volatile Raw-material Prices
Feedstocks such as hydrochloric acid and ethyl acetate exhibit cyclical swings tied to steel output and petrochemical cracker uptime. Hurricane-related force majeure declarations in late 2024 tightened Gulf-Coast supply, pushing hydrochloric acid spot prices up and squeezing converters lacking long‐term contracts. Specialty chelants that are versatile in neutral‐pH cleaners saw list-price hikes of USD 0.10 per pound in April 2025, reflecting global supply-demand imbalances. Currency volatility amplifies the challenge, especially for European exporters whose euro appreciation erodes price competitiveness in Asian markets. Some suppliers counter risk by backward-integrating into surfactant intermediates or negotiating tolling agreements that guarantee minimum volume off-take at indexed pricing.
*Our forecasts treat driver/restraint impacts as directional, not additive. The impact forecasts reflect baseline growth, mix effects, and variable interactions.
Metal Cleaning Chemicals Market Segment Analysis
By Type:
Acidic Cleaners Lead Steel ApplicationsAcidic formulations controlled 37.68% of the Metal Cleaning Chemicals market share in 2025, driven largely by hydrochloric-acid-based pickling solutions for carbon-steel strip lines. The segment is projected to advance at a 5.56% CAGR, underpinned by new regeneration technologies that reclaim free acid and remove iron salts, slashing sludge output by up to 90%. Nonetheless, operators confront tighter air-emission caps; many have added mist eliminators and hydrogen-peroxide-boost systems that cut nitrogen-oxide formation. Neutral and basic cleaners fill process gaps where pH-sensitive alloys or multi-material assemblies require gentler action, but their growth lags partially because alkaline solutions generate higher wastewater-neutralization costs.
Advanced acidic blends now incorporate corrosion inhibitors and low-foaming surfactants that extend bath life, enabling mills to stretch campaigns between changeovers and reduce downtime. In aerospace finishing lines, phosphoric blends preceded by alkaline pre-strips ensure adhesion uniformity for anodizing, while in automotive plants citric-acid cleaners help eliminate hexavalent chromium from pretreatment stages. The Metal Cleaning Chemicals market therefore continues to depend on acidic technology as a productivity anchor even while sustainability pressures drive incremental substitution with chelant-buffered low-hazard alternatives.

By Form:
Aqueous Dominance Reflects Environmental PrioritiesAqueous solutions captured 54.62% of 2025 revenue and are forecast to compound at 5.34% through 2031, maintaining clear leadership in the metal cleaning chemicals market. The higher share rests on dual pillars: regulatory mandates curbing VOC emissions and corporate ESG targets that favor worker safety. Enzyme catalysts, biodegradable surfactants, and low-temperature builders now allow aqueous products to equal solvent performance on diverse soils, allowing many processors to decommission vapor-degreasing units. However, water-based systems demand robust evaporation capacity; some users report 15% energy-input increases to drive drying tunnels after parts exit wash stages.
Solvent formulations retain niche status where rapid drying and superior solvency for cutting oils prove critical, for instance, in hermetically sealed aerospace actuators or precision hydraulic valves. Hybrid processes that combine aqueous pre-wash with controlled vapor rinse are gaining traction, offering balanced throughput and compliance. Product-differentiation narratives now center on circular-economy compatibility for formulators, such as reclaiming rinse water for boiler feed or integrating renewable electricity certificates to present cradle-to-gate carbon savings. Consequently, the Metal Cleaning Chemicals industry positions aqueous platforms not merely as environmentally necessary but also as production-efficiency enablers.
By Metal Type:
Steel Applications Drive Volume, Aluminum Shows PromiseSteel and ferrous alloys accounted for 44.92% of global demand in 2025 because hot-rolled coil and tube production volumes dwarf other substrates. Large pickling lines consume thousands of tons/year of inhibitory-additive-laden acids, making them the single largest customer block within the metal cleaning chemicals market. The sub-segment’s growth aligns with infrastructure spending in the United States and India, as new mini-mills and electric-arc-furnace upgrades require modernized pickling capacity equipped with fume capture and acid regeneration.
Aluminum and light-alloy cleaning is poised for a 5.47% CAGR, reflecting aerospace lightweighting, EV battery enclosures, and beverage-can sheet expansion. Aluminum surfaces are prone to white rust if improperly rinsed; hence mildly acidic, fluoride-free cleaners that suppress pitting while preparing for conversion-coating gain share. Copper, brass, titanium, and magnesium together represent a smaller but technically demanding slice. Suppliers that master ultra-high-purity production thus access a price-insensitive niche insulated from commodity cycles.
By End-user Industry:
Automotive Leads, Electronics AcceleratesAutomotive manufacturers held 31.74% of 2025 revenue, reflecting extensive cleaning steps across stamping, machining, and final assembly. Galvanized body-in-white panels, aluminum closures, and cast-iron blocks all require staged alkaline, neutral, and acidic baths to meet bonding and corrosion-protection specifications. Industry electrification adds further complexity because battery housings and e-axle components blend aluminum and high-strength steel, necessitating multi-metal-safe chemistries with conductivity limits that do not interfere with electromagnetic shielding.
Electrical and electronics manufacturing will outpace all other sectors at a 5.41% CAGR as semiconductor wafer fabs proliferate. Here, the metal cleaning chemicals market size for ultrapure blends is estimated to reach USD 2.09 billion by 2031, roughly 10% of overall market value. Contamination thresholds measured in parts per quadrillion force suppliers to adopt semiconductor-grade quartz vessels, double-fluoropolymer-lined piping, and on-site ion chromatography validation. Aerospace, oil and gas, and general manufacturing each add steady base demand; yet aerospace sets the most stringent approval regimes under Aerospace Management Services (AMS) and Boeing specifications, limiting qualified suppliers to a handful and reinforcing moderate market concentration.
Geography Analysis
APAC Metal Cleaning Chemicals Market
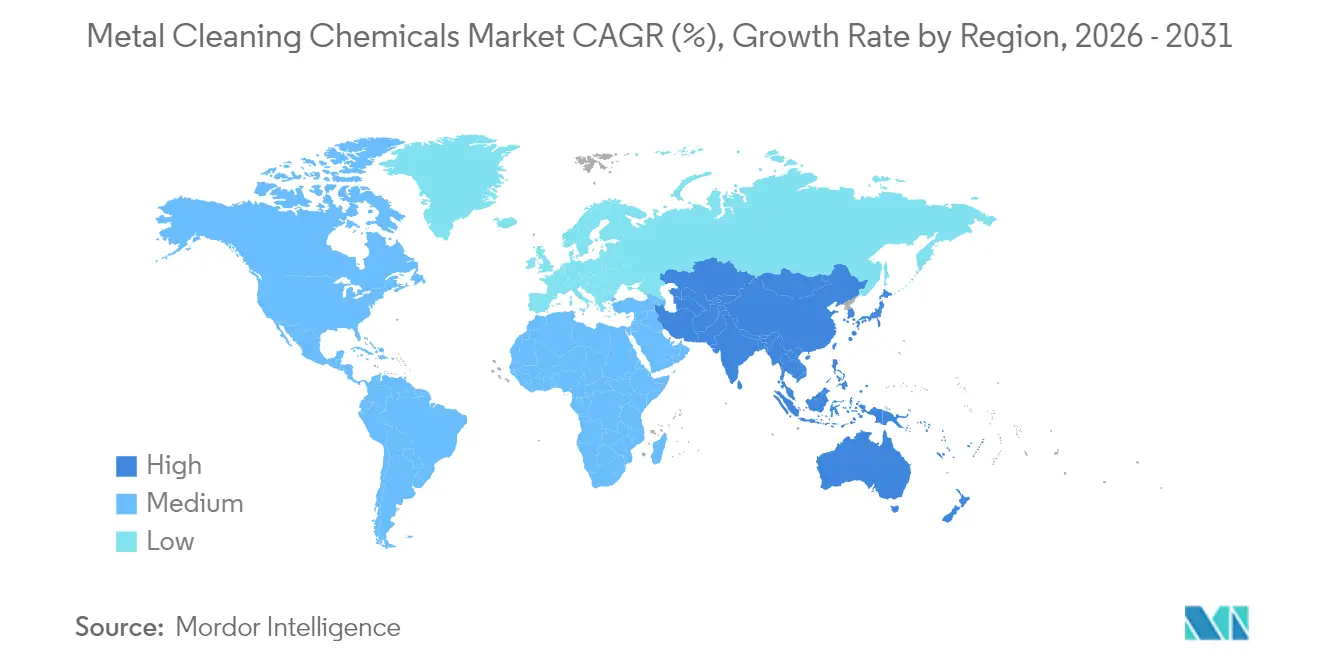
Asia-Pacific accounted for 41.88% of 2025 global revenue, a position it will reinforce with a 5.18% CAGR through 2031. China dominates regional demand because its continuous pickling lines and advanced wafer-fabrication plants rely on large-volume acidic and ultrapure chemistries. Government incentives under “Made in China 2025” prompted acquisitions of tetramethylammonium hydroxide producers, locking in domestic control over a critical photoresist-developer ingredient vital to the metal cleaning chemicals market. South Korea’s semiconductor majors, Japan’s precision-machining SMEs, and India’s burgeoning MRO corridors compound regional traction. Rising labor costs spur automation, directly boosting uptake of sensor-rich aqueous cleaners tuned for conveyorized washers.
North America Metal Cleaning Chemicals Market
North America represents a technologically mature yet compliance-stringent arena. Stringent VOC caps under the United States National Emission Standards for Hazardous Air Pollutants have accelerated solvent-to-water conversions, especially within automotive paint pre-treatment. The Creating Helpful Incentives to Produce Semiconductors (CHIPS) and Science Act has triggered USD 200 billion in foundry announcements, driving localized demand for sub-10 parts per thousand (ppt) purity acids and low-metal alkaline blends. Mexico benefits from near-shoring; new battery-component plants in Nuevo León require dual-metal cleaning protocols for steel and aluminum sub-assemblies. Nonetheless, the region’s overall growth rate lags Asia-Pacific because existing installed capacity is high and facility expansions are incremental rather than greenfield.
Europe Metal Cleaning Chemicals Market
Europe’s market is steadied by a sophisticated automotive and aerospace backbone but tempered by high energy prices and Registration, Evaluation, Authorization and Restriction of Chemicals (REACH) compliance costs. German OEMs are transitioning to neutral-pH cleaners with boron-free buffering agents to meet anticipated 2026 wastewater regulations, and Italian appliance makers increasingly specify enzyme-activated degreasers to support corporate carbon-neutrality pledges. Eastern European steel and white-goods plants supply intra-European Union (EU) value chains, creating incremental cleaning-chemical demand but at lower per-unit profitability than Western Europe. The forthcoming PFAS essential-use criteria will likely propel further R&D spending as formulators seek drop-in replacements that maintain surface-tension performance for capillary penetration in complex assemblies.
Value Chain Analysis
The metal cleaning chemicals value chain begins with upstream feedstocks such as mineral acids (including hydrochloric acid), solvents, chelating agents, builders, and surfactants from petrochemical and oleochemical networks. These inputs are then blended by specialty formulators into alkaline, acidic, neutral, and solvent-based systems, followed by qualification to end-user requirements, including low-foam behavior for spray washers, residue limits for precision parts, and boron-free or low-VOC targets. A parallel chain runs through parts-washer OEMs and system integrators that bundle chemistry with equipment, sensors/PLC interfaces, dosing skids, and service programs, which becomes more relevant as automated parts-washing is embedded into machining cells.
Downstream, products are sold directly to large industrial accounts and through regional distributors that maintain buffer stock for MRO shops, tier suppliers, and job coaters. Adoption cycles are shaped by performance and compliance documentation, including SDS, wastewater treatability data, and customer approvals, which also increases switching costs. Logistics reliability and raw-material price volatility can pressure smaller blenders that do not have indexed contracts, while Rotterdam-style hubs and localized manufacturing or labs help support just-in-time delivery for automotive pretreatment and electronics supply chains. Leading suppliers differentiate by offering total-solution packages that combine chemistry, on-site technical service, and digital monitoring dashboards.
Competitive Landscape
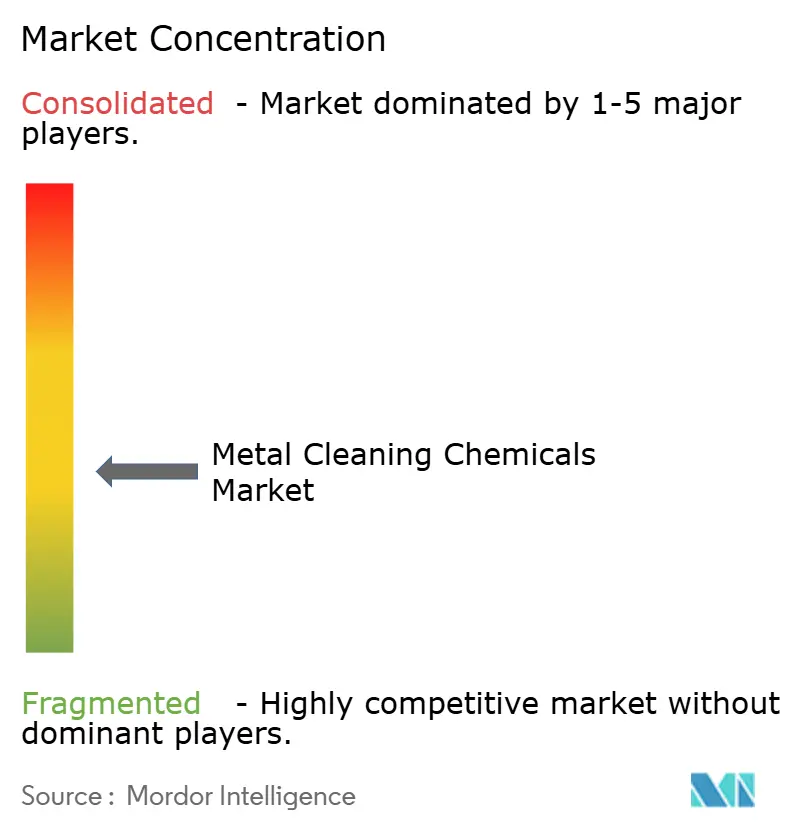
The Metal Cleaning Chemicals market exhibits moderate fragmentation with the presence of leading players, such as BASF, Dow, Ecolab Inc., Quaker Chemical Corporation, and Henkel AG & Co. KGaA. BASF, Ecolab Inc., and Henkel AG & Co. KGaA anchor the high end by leveraging extensive application labs and sustainability positioning. BASF’s April 2025 rollout of biomass-balanced amphoterics in North America exemplifies premiumization; the products claim 80% renewable raw-material content. Ecolab Inc. focuses on total-solution packages, combining chemistry with dosing hardware and IoT dashboards, capturing multi-year service contracts that insulate earnings from raw-material swings. The coalescence of regulatory pressure, customer ESG demands, and process-automation complexity thus rewards players that can integrate R&D, regulatory compliance, and on-site technical services within one offering.
Metal Cleaning Chemicals Industry Leaders
-
Henkel AG & Co. KGaA
-
Quaker Chemical Corporation
-
BASF
-
Ecolab Inc.
-
Dow
- *Disclaimer: Major Players sorted in no particular order
Metal Cleaning Chemicals Market Companies Covered in this Report
- Arrow Solutions
- BASF
- Chautauqua Chemical Company
- Clariant AG
- Crest Chemicals
- Delstar Metal Finishing Inc.
- Dow
- DST-Chemicals
- Eastman Chemical Company
- Ecolab Inc.
- Elmer Wallace Ltd.
- Evonik Industries AG
- Henkel AG & Co. KGaA
- Hubbard-Hall
- ICL
- JELMAR
- KYZEN Corporation
- Lincoln Chemical Corporation
- Luster-On Products Inc.
- Modern Chemical Inc.
- Nouryon
- Parker Hannifin Corp.
- PCC Group
- Quaker Chemical Corporation
- Rochester Midland Corp.
- S. Freedman & Sons, LLC.
- SAFECHEM Europe GmbH
- Solugen
- Stepan Company
- The Chemours Company
- Zavenir Daubert
Market Opportunities and Future Outlook
An actionable whitespace is the combination of energy-efficient cleaning with compliance-driven solvent replacement, specifically low-temperature aqueous degreasing that preserves throughput while reducing heated-washer energy use and VOC exposure. Supplier activity aligns with this direction, including Henkel introducing lower-temperature dip-degreasing chemistries that operate around 35-40 degrees Celsius, reinforcing the shift away from legacy solvent systems under tightening occupational and environmental constraints.
A second opportunity centers on certified circular and bio-based inputs for metal-cleaning formulations, especially surfactants, biosolvents, and oxidizing chemistries that can be validated through mass-balance and third-party schemes. In 2026, upstream and adjacent specialty-chemicals moves continued to expand the available alternative ingredient pool, including Evonik launching a low-carbon-footprint peracetic acid in Europe with third-party certification, and Kensing unveiling an upcycled biosurfactant platform. These developments help formulators meet customer ESG scorecards and product stewardship requirements while maintaining technical performance across electronics, automotive, and aerospace MRO applications.
Recent Industry Developments in Metal Cleaning Chemicals Market
- June 2026: Quaker Houghton opened a new manufacturing site in Zhangjiagang, China, and expanded its laboratory footprint in Shanghai. The added local production and application support improves supply reliability and helps speed qualification cycles for cleaning and process-fluid programs in Asia-Pacific manufacturing clusters.
- February 2026: Henkel launched Bonderite C-AD 20202 for industrial dip degreasing, positioned to enable effective cleaning at lower operating temperatures (about 35-40 degrees Celsius). The product supports customers seeking to reduce energy consumption and align surface-preparation steps with tighter sustainability and worker-safety requirements.
- April 2025: BASF rolled out biomass-balanced amphoteric ingredients in North America under its EcoBalanced approach. Wider availability of mass-balance surfactants gives metal-cleaning formulators additional levers to develop aqueous, lower-footprint products without reengineering entire cleaning lines.
Metal Cleaning Chemicals Market Report Scope and Research Methodology
Market Definition and Coverage
This market covers chemical formulations used to remove oils, greases, oxides, particulates, and process residues from metal surfaces before or after fabrication, machining, finishing, coating, or assembly. It includes both aqueous and solvent-based cleaning systems used in industrial and manufacturing plants.
Scope exclusions: Cleaning equipment, parts washers, and outsourced contract cleaning services are not counted when they are billed separately from chemical sales.
Segments Covered in This Report
- By Type
- Acidic
- Basic
- Neutral
- By Form
- Aqueous
- Solvent
- By Metal Type
- Steel & Ferrous Alloys
- Aluminum & Light Alloys
- Copper & Brass
- Other Non-ferrous Metals
- By End-user Industry
- Aerospace
- Automotive & Transportation
- Electrical & Electronics
- Chemical & Pharmaceuticals
- Oil & Gas
- Other End-users (Marine, Power Genation, etc.)
- By Geography
- Asia-Pacific
- China
- Japan
- India
- South Korea
- ASEAN Countries
- Rest of Asia-Pacific
- North America
- United States
- Canada
- Mexico
- Europe
- Germany
- United Kingdom
- France
- Italy
- Spain
- Russia
- NORDIC Countries
- Rest of Europe
- South America
- Brazil
- Argentina
- Rest of South America
- Middle East and Africa
- Saudi Arabia
- South Africa
- Rest of Middle East and Africa
- Asia-Pacific
Data Sources, Market Sizing, and Validation
Desk Research
Desk work began by mapping where metal cleaning is routinely applied in manufacturing, then linking those demand centers to public production and industrial output indicators. We used sources such as US EPA updates on solvent restrictions, Eurostat industrial production series, and UN Comtrade trade flows for relevant chemical categories, alongside public material from industry organizations including the International Organization of Motor Vehicle Manufacturers to contextualize downstream activity.
We also scanned patents and peer-reviewed journals to track shifts from chlorinated solvent chemistry toward aqueous formulations and updated inhibitor packages. On the supplier side, we organized company signals using annual reports, 10-K style filings, investor decks, and product technical datasheets to determine where metal cleaning sits within broader industrial chemical portfolios.
In a few cases, paid subscriptions were used only for company financials and intelligence, patent database extraction, and shipment-level import/export checks, so inputs could be reconciled across regions. The desk sources listed here are illustrative, and additional public documents and datasets were used as cross-checks during the build.
Primary Interviews and Surveys
Primary work focused on confirming what is actually purchased as a metal cleaning chemical, how end users distinguish a usable cleaning bath from additive top-ups, and how pricing moves across ongoing contracts. We spoke with formulators, distributors, and large end users across automotive, general manufacturing, aerospace, and electronics, and then pressure-tested assumptions across APAC, EMEA, and the Americas to reduce regional bias.
Distribution of primary research fieldwork respondents
| Company type | Respondent position | Region |
|---|---|---|
| Top tier: 32% | CXOs: 15% | APAC: 45% |
| Mid tier: 53% | Functional/Unit leaders: 25% | EMEA: 37% |
| Smaller Players: 15% | Managers: 60% | Americas: 18% |
Market-Sizing & Forecasting
Sizing starts with a top-down build that uses industrial production, metalworking activity, and surface treatment intensity to reconstruct a demand pool. That demand pool is then converted into chemical consumption in value terms. To keep the calculations traceable, the model is anchored on regional manufacturing output, the solvent-to-aqueous mix, typical bath change-out and replenishment patterns, and observed price bands for major cleaner chemistries (alkaline, acidic, and neutral).
Where available, trade movement signals and regulatory milestones, such as tighter rules on specific solvents, are used to explain step-changes in formulation mix and the associated pricing impact. These totals are then checked with selective bottom-up approximations, including sampled supplier revenue splits, distributor channel checks, and ASP times volume sanity checks for key end-use clusters.
When data gaps appear, particularly for smaller local formulators, conservative coverage ratios are applied and validated through interviews before the final run. Forecasts are produced via scenario analysis tied to industrial output outlooks and expected chemistry substitution, and the final growth path is accepted only if it aligns with what primary respondents expect for volumes, mix, and contract pricing behavior.
Data Validation & Update Cycle
Model outputs are validated through multiple passes that look for breakpoints, outliers, and inconsistencies across regions, and the findings are reviewed by another analyst before sign-off. We compare implied chemical intensity against independent signals such as manufacturing indices, trade directionality, and reported capacity moves in adjacent industrial chemicals.
If the variance is large, we re-check assumptions, revisit conversion factors, and re-contact selected participants to confirm whether the change reflects a real shift or a modeling artifact. The report is refreshed on an annual cycle, with interim updates when a material event affects pricing, regulation, or industrial activity. Before delivery, a final review pass is completed so clients receive the latest consistent view.
Mordor Intelligence's Metal Cleaning Chemicals Market Sizing Compared With Other Published Estimates
Published market values for metal cleaning chemicals do not always match. Studies can use different in-scope chemical categories, different end uses, and different ways of treating pricing, and the base year is not always aligned. Variations also occur when one estimate relies more on industrial output proxies, while another uses supplier revenues or a factory-gate framing.
The largest gap often comes down to whether adjacent surface treatment chemistries and outsourced cleaning services are bundled into the same category, and how quickly solvent-to-aqueous substitution shows up in pricing and formulation mix. This is where Mordor Intelligence treats the market as chemical sales tied to metal cleaning use cases, updates the mix assumptions by region, and then converts volumes into USD.
Benchmark comparison
| Source | Market Size | Gaps in Research Methodology |
|---|---|---|
| Mordor Intelligence | USD 16.47 B (2026) | |
| Industry Research Publisher A | USD 15.10 B (2024) | Uses a different base year and a longer historical window, and its scope description suggests broader ingredient and end-use grouping, which can shift the split between cleaning chemicals and related process chemistries. |
| Global Research Group B | USD 18.47 B (2025) | Reported as factory-gate revenue and may include manufacturer-sold services, which can lift the value versus models that focus on chemical consumption value in end-use cleaning applications. |
Looking across the three figures, the spread is mainly explained by base-year timing and what is treated as in-scope revenue versus adjacent services or related chemistries. By keeping the inputs tied to metalworking activity, cleaner mix, and practical replenishment behavior, the estimate remains easier to audit and reproduce when new industrial and pricing signals appear.
Key Questions Answered in the Report
What is the current value of the Metal Cleaning Chemicals market?
The market is valued at USD 16.47 Billion in 2026.
How fast will the Metal Cleaning Chemicals market grow through 2031?
It is forecast to expand at a 4.72% CAGR, reaching USD 20.74 Billion by 2031.
Which region leads demand for metal cleaning chemicals?
Asia-Pacific holds 41.88% of global revenue and will expand at a 5.18% CAGR through 2031.
Why are aqueous formulations gaining popularity?
Regulatory bans on perchloroethylene and VOC-reduction targets drive adoption of water-based chemistries that improve worker safety and environmental compliance.
Which end-user segment is growing the fastest?
Electrical and electronics manufacturing is projected to register a 5.41% CAGR due to the proliferation of semiconductor fabs and miniaturized device assembly.