Medical Dynamometer Market Size and Share
Market Overview
| Study Period | 2020 - 2031 |
|---|---|
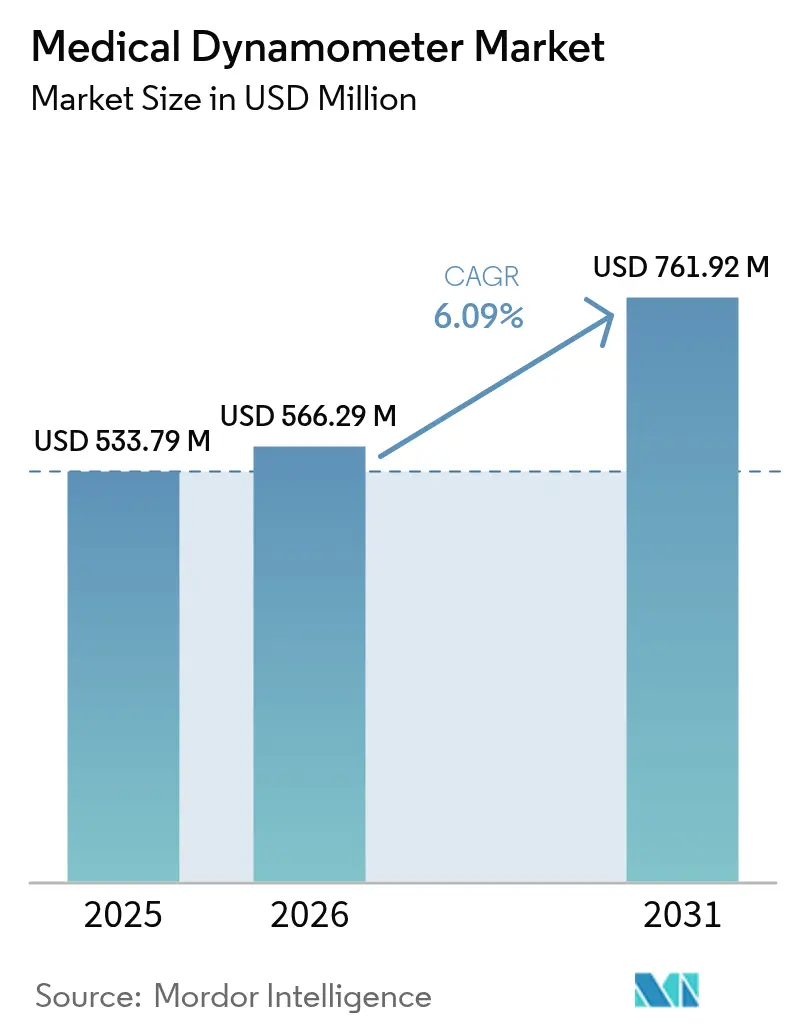
| Market Size (2026) | USD 566.29 Million |
| Market Size (2031) | USD 761.92 Million |
| Growth Rate (2026 - 2031) | 6.09% CAGR |
| Fastest Growing Market | Asia Pacific |
| Largest Market | North America |
| Market Concentration | Medium |
Major Players *Disclaimer: Major Players sorted in no particular order Image © Mordor Intelligence. Reuse requires attribution under CC BY 4.0. | |
Medical Dynamometer Market Analysis by Mordor Intelligence
The medical dynamometer market size in 2026 is estimated at USD 566.29 million, growing from 2025 value of USD 533.79 million with 2031 projections showing USD 761.92 million, growing at 6.09% CAGR over 2026-2031. Demand stems from an aging global population, the clinical recognition of sarcopenia as a distinct disorder, and the rising use of precise muscle-strength data to guide value-based care. Device connectivity has shifted from optional to essential, linking dynamometers to electronic health records and virtual-rehab platforms. Hospitals view connected systems as labor-saving diagnostic tools, while payers reward objective outcome measures generated by these devices. Manufacturers able to merge sensors, analytics, and cloud-based dashboards continue to gain traction.
Key Report Takeaways
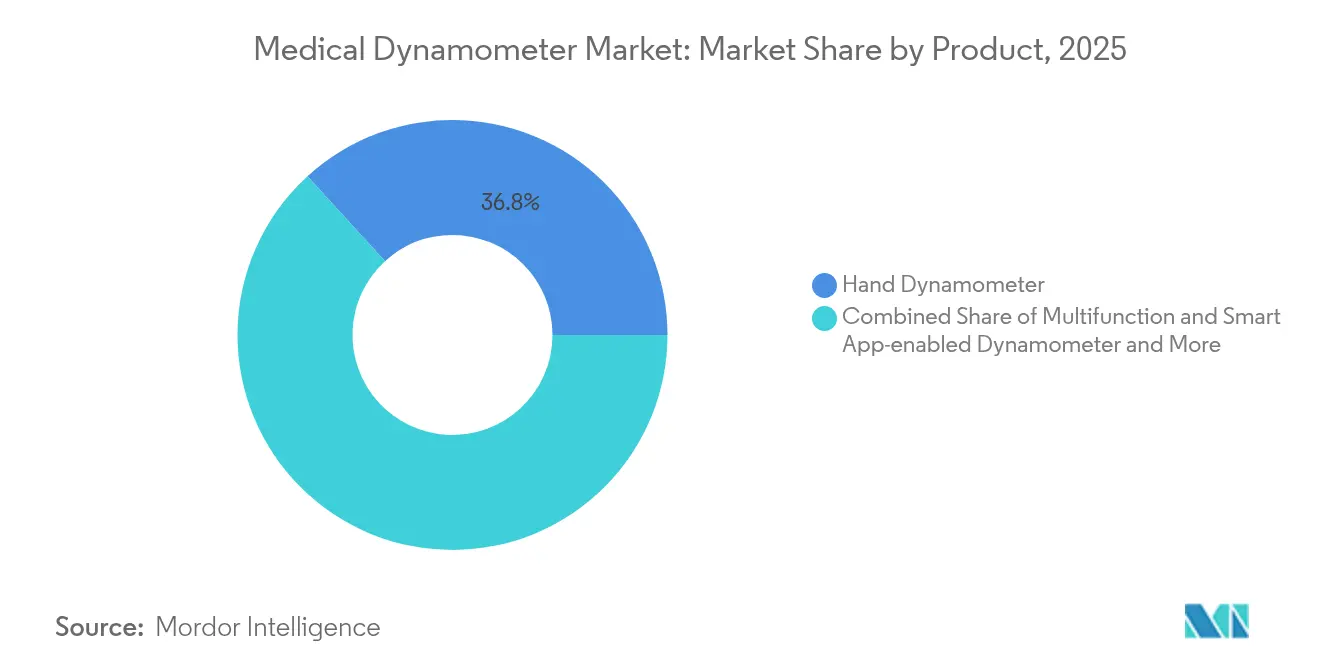
- By product type, hand dynamometers led with 36.78% of the medical dynamometer market share in 2025, while multifunction and smart app-enabled dynamometers are rising at a 12.64% CAGR through 2031.
- By application, orthopedics and sports medicine held 45.02% of the medical dynamometer market size in 2025; neurology and stroke rehabilitation is expanding at an 11.32% CAGR to 2031.
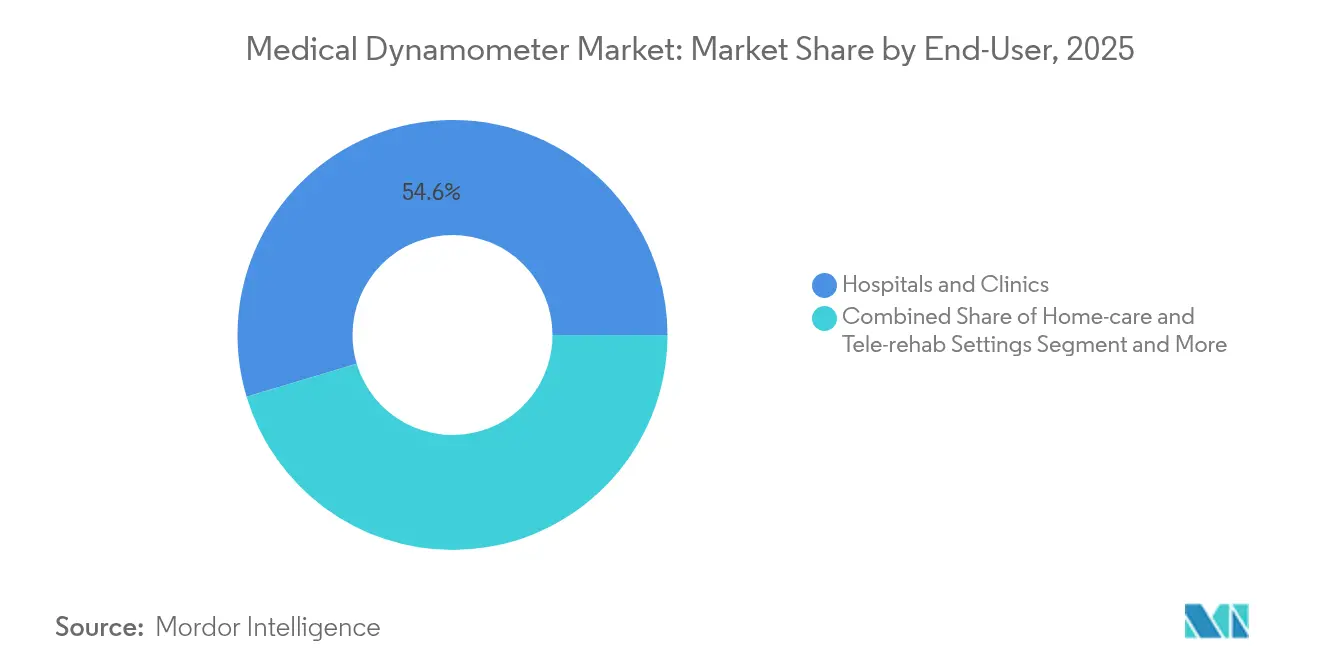
- By end-user, hospitals and clinics retained 54.63% share in 2025, yet home-care and tele-rehab settings are forecast to rise at a 14.05% CAGR to 2031.
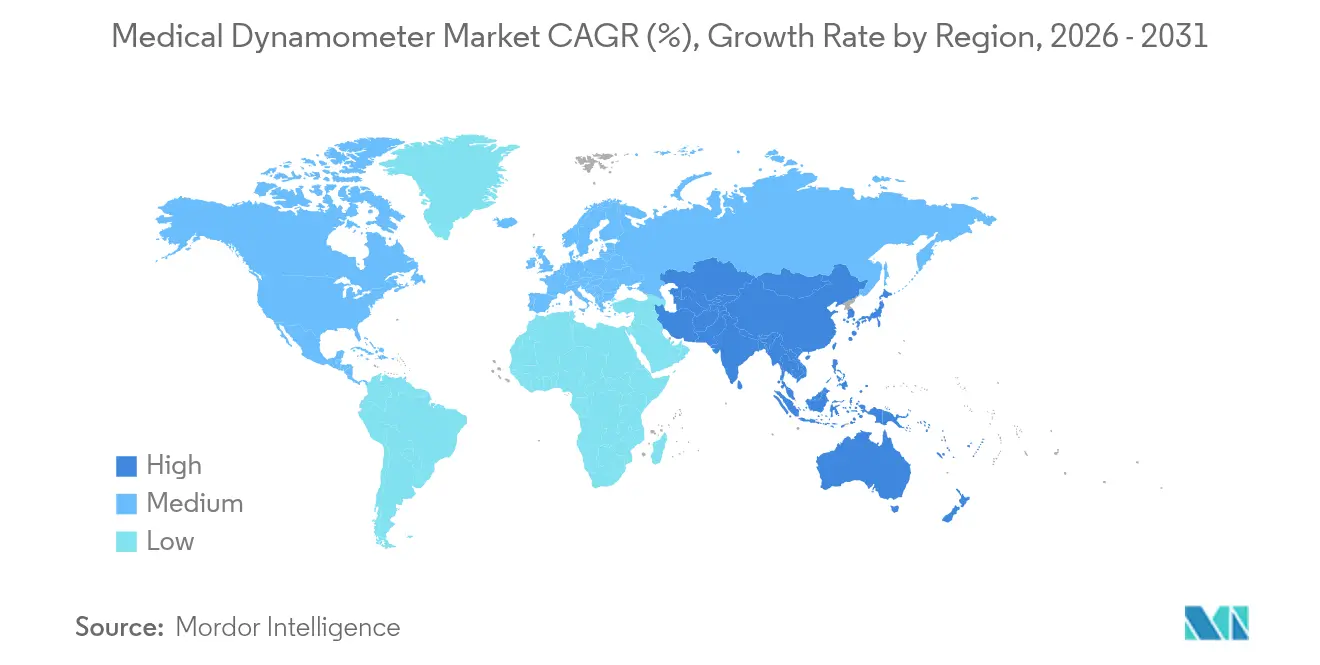
- By geography, North America accounted for 34.95% of revenue in 2025, whereas Asia-Pacific is poised for a 10.25% CAGR through 2031.
Note: Market size and forecast figures in this report are generated using Mordor Intelligence’s proprietary estimation framework, updated with the latest available data and insights as of 2026.
Global Medical Dynamometer Market Trends and Insights
Drivers Impact Analysis*
| Driver | (~) % Impact on CAGR Forecast | Geographic Relevance | Impact Timeline |
|---|---|---|---|
| Rising Incidence Of Osteoporosis | +1.2% | Global, concentrated in Asia-Pacific | Long term (≥ 4 years) |
| Increasing Sports-Related Musculoskeletal Injuries | +0.9% | North America & EU, expanding to APAC | Medium term (2-4 years) |
| Ageing Population & Sarcopenia Prevalence | +1.5% | Global, acute in developed economies | Long term (≥ 4 years) |
| Expanding Physiotherapy & Rehab Reimbursement | +0.8% | North America & EU core markets | Medium term (2-4 years) |
| Integration With Digital MSK-Care Platforms | +1.1% | Global, led by North America innovation hubs | Short term (≤ 2 years) |
| Workplace Ergonomic-Screening Mandates | +0.7% | EU & select US states, expanding globally | Medium term (2-4 years) |
| Source: Mordor Intelligence | |||
Ageing Population & Sarcopenia Prevalence
Clinical guidelines now classify sarcopenia as a stand-alone condition that warrants early screening in primary care. Global prevalence reaches 21% among older adults, and Chinese cohort data link low grip strength to hip-fracture risk[1]Huang S. et al., “Sarcopenia and Hip Fracture Risk Among Chinese Adults,” Nature Scientific Reports, nature.com. Hospitals embed handheld dynamometers into geriatric checkups to flag mobility decline and tailor strength-training plans. Community clinics prefer portable units that withstand frequent transit between locations. Digital dashboards aggregate grip-strength baselines, enabling clinicians to spot rapid deterioration and intervene before fall-related admissions increase costs.
Rising Incidence of Osteoporosis
Asia-Pacific reports osteoporosis rates as high as 30% for women aged 40+ and fracture incidence up to 1,000 per 100,000 person-years. Orthopedic departments appreciate that weak grip strength predicts fragility fractures and use dynamometers as low-cost triage tools when DEXA scanners are unavailable. Retail pharmacies in Japan have begun community screening days with smartphone-linked devices that upload anonymized data to hospital networks. Public-health agencies now list dynamometer grip testing alongside bone-density scans in fall-prevention guidelines, broadening procurement budgets.
Integration With Digital MSK-Care Platforms
Handheld dynamometers increasingly pair with AI-driven motion-analysis software, allowing therapists to visualize force curves during each rep[2]EverEx, “EverEx Products,” everex.co.kr. Rehabilitation apps push personalized strength targets to patients at home; results automatically sync to clinicians, closing feedback loops between visits. Early pilots cut in-person session requirements by 15%, lowering co-pays and freeing therapist capacity. Cloud-based platforms normalize data across device models, aiding multi-site health systems in quality benchmarking. Vendors differentiating on analytics rather than raw force capacity are winning new contracts.
Expanding Physiotherapy & Rehab Reimbursement
Payers in the United States now reimburse remote therapeutic monitoring codes that require objective muscle-strength documentation. Europe’s largest statutory insurers followed suit, citing evidence that supervised strength programs cut joint-replacement costs. Clinics invest in Bluetooth dynamometers that transmit encrypted datasets to billing portals, automating compliance. Policy analysts expect similar code additions in Australia and South Korea within two years, giving manufacturers a window to localize firmware and language support.
Restraints Impact Analysis*
| Restraint | (~) % Impact on CAGR Forecast | Geographic Relevance | Impact Timeline |
|---|---|---|---|
| High Device & Calibration Cost | -0.8% | Global, acute in emerging markets | Short term (≤ 2 years) |
| Shortage Of Trained Clinicians In Emerging Markets | -0.6% | Asia-Pacific & MEA emerging economies | Long term (≥ 4 years) |
| Low-Cost Asian Imports Eroding ASPs | -0.9% | Global, concentrated in price-sensitive segments | Medium term (2-4 years) |
| Data-Integration & Interoperability Gaps | -0.5% | Global, varying by healthcare system maturity | Medium term (2-4 years) |
| Source: Mordor Intelligence | |||
High Device & Calibration Cost
Annual calibration expenses run 3-5% of a clinic’s equipment budget, and FDA rules mandate certified service providers. Small practices often delay recalibration, risking inaccurate readings that can compromise treatment outcomes. Some vendors now bundle multiyear calibration contracts into leasing models to smooth cash flow. Cloud-based self-diagnostics help users schedule service only when drift exceeds thresholds, cutting downtime. Despite such aids, sticker shock still stalls purchases in community hospitals across Latin America.
Shortage of Trained Clinicians in Emerging Markets
India averages 0.6 physiotherapists per 10,000 people, far below WHO recommendations. Without specialists to administer standardized grip tests, hospitals underuse equipment they already own. NGOs run mobile-clinic programs that teach nurses simplified dynamometer protocols, widening basic screening coverage. Manufacturers supply pictogram-based user interfaces that bypass language barriers and cut training time by half. Until broader workforce reforms materialize, under-utilization will temper unit sales despite strong latent demand.
*Our forecasts treat driver/restraint impacts as directional, not additive. The impact forecasts reflect baseline growth, mix effects, and variable interactions.
Segment Analysis
By Product: Smart Integration Transforms Traditional Devices
Hand dynamometers generated 36.78% of 2025 revenue, underlining their role as the baseline tool for quick grip assessments in primary care. However, smart multifunction models are scaling at a 12.64% CAGR, aided by embedded inertial sensors that capture peak, average, and endurance force in one trial. Push-pull devices dominate ergonomic audits in manufacturing plants, where safety officers use force data to redesign workflows. Chest dynamometers, though niche, gained adoption in post-COVID pulmonary rehab programs that monitor inspiratory-muscle strength. Recent designs integrate rechargeable lithium packs, cutting battery replacement costs by 60% and supporting green-procurement mandates.
The medical dynamometer market increasingly rewards suppliers that pair hardware with robust analytics. Cloud dashboards deliver color-coded progress charts to therapists and export HL7-compliant files to hospital record systems, eliminating manual data entry. Companies introducing subscription-based software layers report 25% higher customer retention. As tariffs on Chinese components reached 125% in 2025, North American firms reshored sensor assembly to mitigate supply-chain risk. The shift lifted average selling prices but created marketing room for “domestic-origin” quality claims that resonate with veterans-affairs buyers.


By Application: Neurology Rehabilitation Drives Innovation
Orthopedics and sports medicine maintained 45.02% of 2025 sales, reflecting clinicians’ long-standing use of grip strength to evaluate post-injury recovery. Yet neurology and stroke rehabilitation is projecting an 11.32% CAGR as virtual reality and robotic exosuits demand precise strength baselines for personalization. Hospitals bundle dynamometers with upper-limb VR modules to form turnkey neuro-rehab labs reimbursed under comprehensive stroke care bundles. Cardiopulmonary programs now incorporate hand-grip metrics because they correlate with cardiovascular mortality better than treadmill endurance in frail patients. Trauma centers favor compact devices that fit surgical ICUs, enabling strength readings within 24 hours of injury to inform early mobilization plans.
AI systems trained on 200 million force-curve datapoints classify recovery trajectories and suggest protocol adjustments. Preliminary trials cut plateau periods by two weeks for sub-acute stroke survivors. The medical dynamometer market size for neuro applications is forecast to add USD 86.4 million by 2031, supported by grant-funded pilot sites in Germany and Japan. Clinicians appreciate that automated reporting satisfies insurer documentation, slashing note-writing time.
By End-User: Home-Care Revolution Reshapes Market Dynamics
Hospitals and clinics retained 54.63% market share in 2025, driven by bundled purchases through group-purchasing organizations. Yet home-care and tele-rehab settings are accelerating at a 14.05% CAGR, encouraged by reimbursement codes that pay for remote patient monitoring. Device makers responded with lightweight units under 300 g that elderly users can operate without assistance. Bluetooth Low Energy communication permits continuous grip testing during daily activities, creating dense datasets that predictive algorithms mine for relapse markers.
Occupational-health programs buy push-pull models to comply with new Minnesota ergonomic regulations, which require quantified strain assessments in warehouse jobs. Sports-performance centers integrate grip metrics into athlete dashboards alongside GPS and heart-rate data, supporting precision training loads. Military hospitals deploy ruggedized variants meeting MIL-STD-810H for field rehab after musculoskeletal injuries. The medical dynamometer market share captured by tele-rehab suppliers is set to rise as veteran-affairs facilities scale procurement partnerships such as the PortableConnect deal announced in March 2024.
Geography Analysis
North America generated 34.95% of 2025 revenue, buoyed by high procedure volumes, universal private-payer coverage for outpatient rehab, and early adoption of cloud-linked devices. Large integrated health networks, including Kaiser Permanente and the Veterans Health Administration, now specify data-interoperable dynamometers in tenders. Federal guidelines that reimburse remote therapeutic monitoring further expand order volumes. Domestic manufacturers promote tariffs as catalysts for local production, appealing to public-sector buyers seeking supply-chain resilience.
Asia-Pacific is the fastest-growing region at a 10.25% CAGR to 2031, underpinned by aging demographics and proactive musculoskeletal screening campaigns in Japan, South Korea, and China. Chinese companies now account for more than 80% of component supply to top global brands, which shortens lead times and supports customized builds. Government stimulus funds in Indonesia and India earmark grants for digital rehab equipment in secondary-tier cities, widening access beyond metropolitan hospitals. Regional suppliers leverage language-localized apps to penetrate community health centers.
Europe represents a mature but innovation-driven landscape. Enforcement of the Medical Device Regulation raises documentation costs, yet manufacturers that achieve certification enjoy reduced competitive clutter. Ergonomic-screening mandates such as the 2024 Amazon-OSHA agreement create fresh demand in industrial health and safety. Public-sector tenders prioritize carbon-footprint disclosures, prompting suppliers to shift packaging to biodegradable materials. The European Space Agency’s pilot program assessing astronaut grip strength for muscle-atrophy research offers niche-market publicity that drives hospital interest in similar tech.

Competitive Landscape
The industry remains moderately fragmented; the top five suppliers command a major global revenue. Legacy brands specialize in accredited calibration services, while venture-backed newcomers focus on AI-driven analytics. Competition intensifies as buyers value software ecosystems over raw force capacity. Three strategy clusters dominate: cost leaders build high-volume factories in mainland China; technology leaders embed multi-axis sensors and cloud APIs; service leaders wrap devices with training and outcome-analysis subscriptions.
Recent reshoring and tariff dynamics spur joint ventures between U.S. and Mexican electronics firms to secure sensor supplies. European incumbents invest in cybersecurity certifications to comply with the forthcoming EU AI Act. Marketing narratives emphasize clinical-evidence pipelines: random-controlled trials linking grip-strength gains to reduced hospital readmissions underpin premium pricing.
System integrators bundle dynamometers with EMG sleeves and inertial-measurement-unit wearables, pitching unified musculoskeletal insights to insurers that reward holistic outcome dashboards. Acquisition activity targets software capability—exemplified by Medbridge’s 2024 purchase of Rehab Boost to add computer-vision analytics. Larger players watch adjacent markets such as smart insoles for gait analysis, evaluating cross-selling potential through existing rehab channels.
Medical Dynamometer Industry Leaders
Marsden Weighing Group
JTECH Medical Industries
KERN & SOHN
Charder Electronics
Mirion Technologies, Inc. (Biodex Medical Systems)
- *Disclaimer: Major Players sorted in no particular order

Recent Industry Developments
- May 2025: Hoggan Scientific upgraded its microFET2 handheld dynamometer with new wireless accessories for rapid multi-muscle testing.
- October 2024: Medbridge acquired motion-capture start-up Rehab Boost to integrate real-time body-movement analytics into its rehabilitation platform.


Global Medical Dynamometer Market Report Scope
As per the scope of the report, Medical dynamometers are devices that measure the strength of different muscle groups along with bones and neurons. Medical dynamometers evaluate the intensity of different groups of muscles, nerves, and joints in the body. Some dynamometers provide tolerance to the different requirements of an individual, including treatment for injuries, weakness, discomfort among others.
| Chest Dynamometer |
| Hand Dynamometer |
| Push-Pull Dynamometer |
| Squeeze/Grip Dynamometer |
| Multifunction & Smart App-enabled Dynamometer |
| Orthopedics & Sports Medicine |
| Neurology & Stroke Rehab |
| Cardiology & Pulmonary Rehab |
| Medical Trauma & Post-operative |
| Others |
| Hospitals & Clinics |
| Rehabilitation Centers |
| Home-care & Tele-rehab Settings |
| Occupational Health & Sports Facilities |
| North America | United States |
| Canada | |
| Mexico | |
| Europe | Germany |
| United Kingdom | |
| France | |
| Italy | |
| Spain | |
| Rest of Europe | |
| Asia-Pacific | China |
| Japan | |
| India | |
| South Korea | |
| Australia | |
| Rest of Asia-Pacific | |
| Middle East and Africa | GCC |
| South Africa | |
| Rest of Middle East and Africa | |
| South America | Brazil |
| Argentina | |
| Rest of South America |
| By Product | Chest Dynamometer | |
| Hand Dynamometer | ||
| Push-Pull Dynamometer | ||
| Squeeze/Grip Dynamometer | ||
| Multifunction & Smart App-enabled Dynamometer | ||
| By Application | Orthopedics & Sports Medicine | |
| Neurology & Stroke Rehab | ||
| Cardiology & Pulmonary Rehab | ||
| Medical Trauma & Post-operative | ||
| Others | ||
| By End-User | Hospitals & Clinics | |
| Rehabilitation Centers | ||
| Home-care & Tele-rehab Settings | ||
| Occupational Health & Sports Facilities | ||
| Geography | North America | United States |
| Canada | ||
| Mexico | ||
| Europe | Germany | |
| United Kingdom | ||
| France | ||
| Italy | ||
| Spain | ||
| Rest of Europe | ||
| Asia-Pacific | China | |
| Japan | ||
| India | ||
| South Korea | ||
| Australia | ||
| Rest of Asia-Pacific | ||
| Middle East and Africa | GCC | |
| South Africa | ||
| Rest of Middle East and Africa | ||
| South America | Brazil | |
| Argentina | ||
| Rest of South America | ||


Key Questions Answered in the Report
What is the current value of the medical dynamometer market?
The medical dynamometer market size stands at USD 566.29 million in 2026.
How fast is the market expected to grow?
Between 2026 and 2031 the market is projected to post a 6.09% CAGR, reaching USD 761.92 million.
Which product category leads sales today?
Hand dynamometers remain the top-selling product, accounting for 36.78% of 2025 revenue.
Which end-user segment is expanding quickest?
Home-care and tele-rehabilitation settings are advancing at a 14.05% CAGR through 2031.
Why are smart dynamometers gaining traction?
Smart devices link directly to electronic health records, support AI-based rehab plans, and provide objective data that insurers now require for remote therapeutic monitoring reimbursement.
Which region offers the strongest growth opportunity?
Asia-Pacific is forecast to deliver a 10.25% CAGR thanks to aging demographics, expanded health-technology funding, and competitive local manufacturing.
Page last updated on:


