Medical Devices Reimbursement Market Size and Share
Market Overview
| Study Period | 2021 - 2030 |
|---|---|
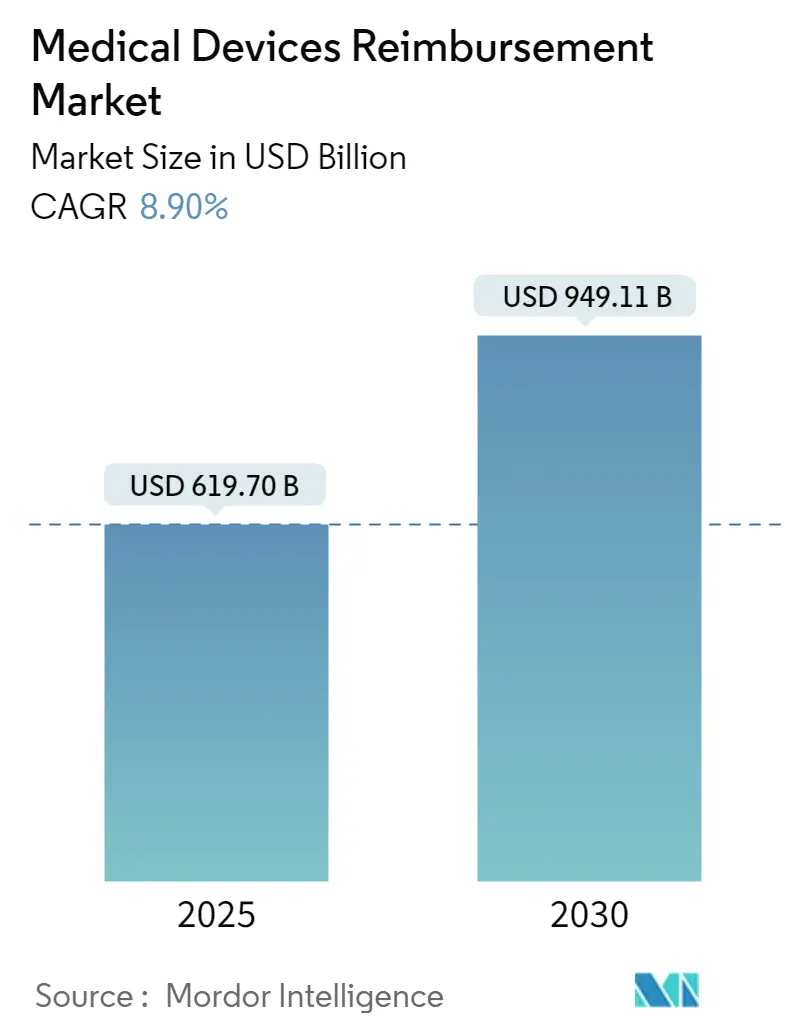
| Market Size (2025) | USD 619.70 Billion |
| Market Size (2030) | USD 949.11 Billion |
| Growth Rate (2025 - 2030) | 8.90% CAGR |
| Fastest Growing Market | Asia Pacific |
| Largest Market | North America |
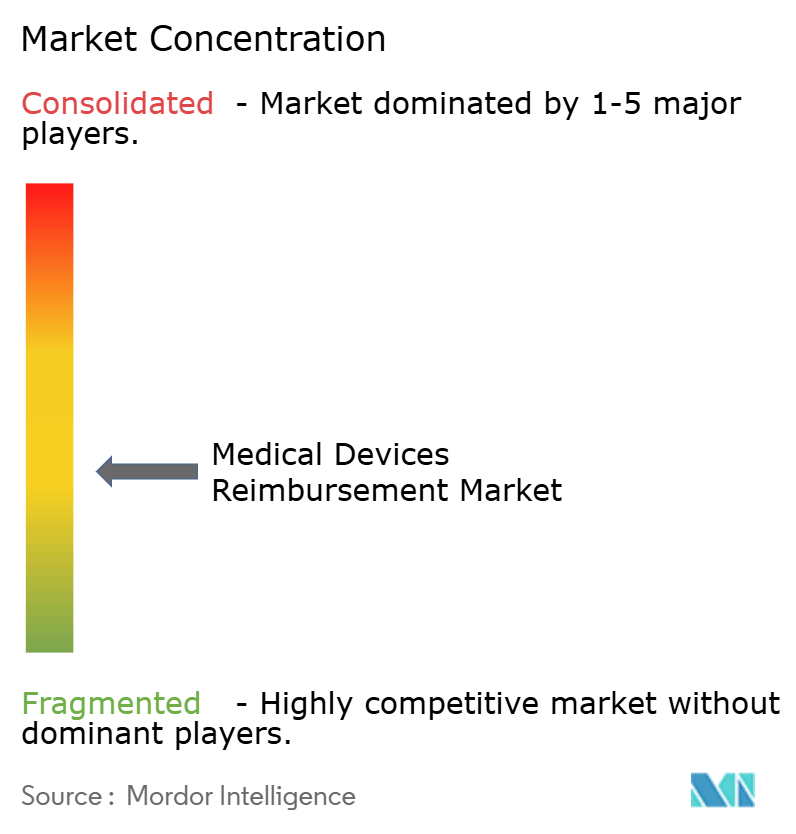
| Market Concentration | Medium |
Major Players *Disclaimer: Major Players sorted in no particular order Image © Mordor Intelligence. Reuse requires attribution under CC BY 4.0. | |
Medical Devices Reimbursement Market Analysis by Mordor Intelligence
The medical device reimbursement market stands at USD 619.70 billion in 2025 and is forecast to reach USD 949.11 billion by 2030, advancing at an 8.90% CAGR. The trajectory is shaped by compulsory value-based models, expanding remote-monitoring codes, and rising implantable device costs that require specialized reimbursement expertise. Hospitals and payers deploy artificial-intelligence tools that cut average claims-processing times by 50%, release working capital sooner, and reduce denial rates American Hospital Association. Mandatory bundled-payment programs, including CMS’s Transforming Episode Accountability Model (TEAM) that begins in 2026, embed device costs inside episode prices Centers for Medicare & Medicaid Services[1]Source: Centers for Medicare & Medicaid Services, “Calendar Year 2025 Medicare Physician Fee Schedule Final Rule,” cms.gov . Growth is further reinforced by Medicare’s widening coverage for remote patient monitoring and by new technology add-on payments that support 40 breakthrough devices in FY 2025. Cybersecurity rules now require every connected device to carry a documented protection plan, increasing compliance costs but also building payer confidence in digital-health adoption FDA.
Key Report Takeaways
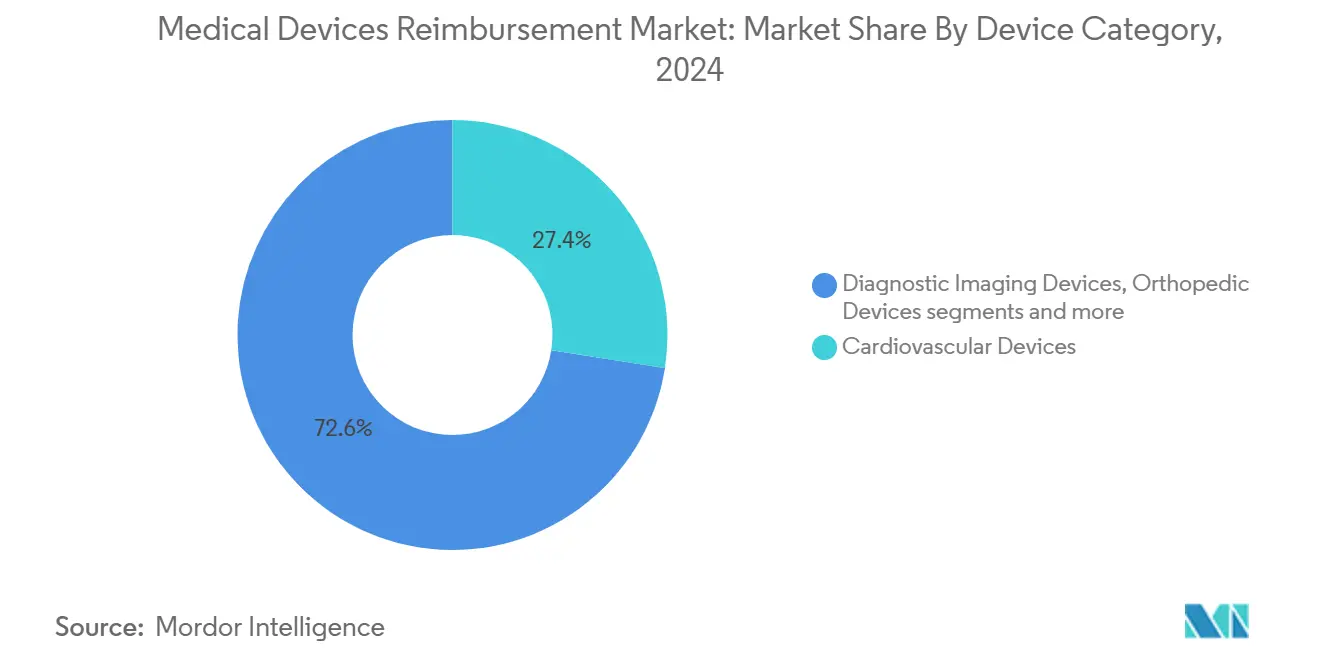
• By device category, cardiovascular devices accounted for 27.45% of the medical device reimbursement market share in 2024, while digital health and wearables are projected to expand at a 9.10% CAGR to 2030.
• By end user, hospitals held 46.34% of the medical device reimbursement market size in 2024; home healthcare leads growth at a 10.25% CAGR through 2030.
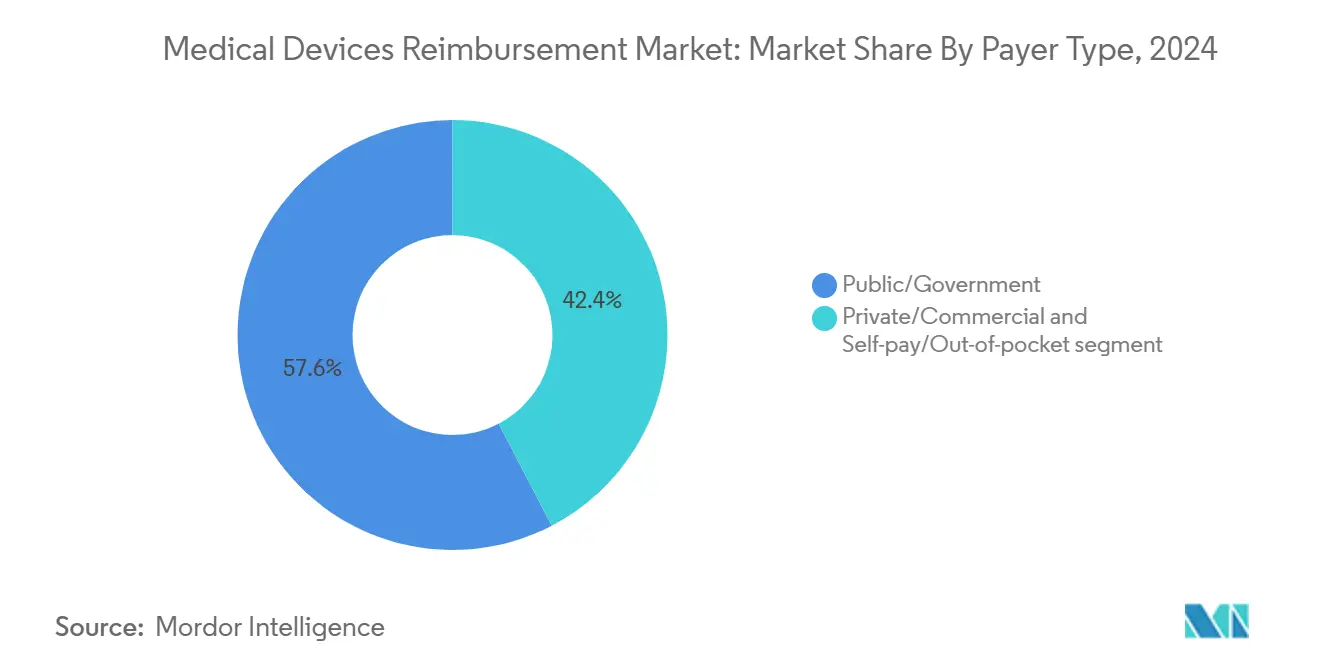
• By payer type, public and government programs commanded 57.63% share of the medical device reimbursement market size in 2024, whereas self-pay is projected to grow at 11.45% CAGR to 2030.
• By geography, North America led with 42.34% medical device reimbursement market share in 2024; the APAC region is advancing at an 11.12% CAGR through 2030.
Global Medical Devices Reimbursement Market Trends and Insights
Drivers Impact Analysis*
| Driver | (~) % Impact on CAGR Forecast | Geographic Relevance | Impact Timeline |
|---|---|---|---|
| Data-driven cost-containment programs | +1.8% | Global, early adoption in North America & EU | Medium term (2-4 years) |
| Shift toward value-based and bundled models | +2.1% | North America leading, expanding to APAC & EU | Long term (≥ 4 years) |
| High-cost implantables and wearables | +1.5% | Global, concentrated in developed markets | Short term (≤ 2 years) |
| AI-enabled claims analytics | +1.4% | North America & EU core, spill-over to APAC | Medium term (2-4 years) |
| Hospital revenue-cycle outsourcing in APAC | +1.2% | APAC core, secondary in MEA | Long term (≥ 4 years) |
| Escalating payer audits on DRGs | +1.0% | Global, intense in North America | Short term (≤ 2 years) |
| Source: Mordor Intelligence | |||
Data-driven cost-containment programs by payers
Medicare Advantage capitation rates rise 2.31% in 2025, rewarding plans that apply predictive analytics to device utilisation patterns Centers for Medicare & Medicaid Services. Payers now require real-world evidence that links device use to total-episode savings, pushing manufacturers to supply cost-effectiveness dossiers. Prior authorisation thresholds are tightening for neuromodulation and structural-heart implants, and social-determinants data is entering coverage algorithms.
Shift toward value-based & bundled payments
CMS’s TEAM model will cover five surgical episodes worth nearly USD 18 billion annually and will affect 741 hospitals American Journal of Managed Care. Device selection therefore moves from unit price comparison to entire-episode cost optimisation, accelerating demand for suppliers willing to cap spend and share risk. Earlier programs, such as BPCI Advanced with a 3% discount target, proved that bundled reimbursement can preserve quality while lowering device-intensive episode costs.
Rapid growth of high-cost implantables and wearables
Forty breakthrough products receive new-technology add-on payment (NTAP) status in FY 2025, directing an extra USD 769.5 million of Medicare spending to innovators MMP Inc. FDA-cleared rhythm monitors that detect atrial fibrillation remotely gain swift coverage as payers recognise their ability to avert costly readmissions. Remote therapeutic monitoring codes now reimburse USD 19.73 to USD 107.07 per month Rimidi, adding a recurring revenue stream for connected implantables.
AI-enabled claims analytics platforms
Nearly 46% of hospitals deploy AI in revenue-cycle functions American Hospital Association. Solventum’s platform scans clinical, coding, and payment data to flag likely denials before submission, tackling USD 19.7 billion in annual denial appeals MedCloudInsider. Natural-language processing automates review of operative notes, improving code accuracy and loosening reliance on shrinking coding workforces. Rising algorithm complexity, however, amplifies cybersecurity exposure that must satisfy FDA Section 524B standards FDA[2]Source: Food and Drug Administration, “Cybersecurity,” fda.gov.
Restraints Impact Analysis*
| Restraint | (~) % Impact on CAGR Forecast | Geographic Relevance | Impact Timeline |
|---|---|---|---|
| Fragmented coding standards | –1.2% | Global, acute in emerging markets | Long term (≥ 4 years) |
| Growing denial rates for novel devices | –0.9% | Global, strict prior-authorisation markets | Medium term (2-4 years) |
| Shortage of certified reimbursement specialists | –0.8% | North America & EU, expanding globally | Medium term (2-4 years) |
| Cybersecurity risks in remote claims processing | –0.6% | Global, highest in digital leaders | Short term (≤ 2 years) |
| Source: Mordor Intelligence | |||
Fragmented coding standards across regions
Single-use devices in Japan, Taiwan, Korea, and Australia are often bundled into procedure fees without discrete funding guidance Value Health Regional Issues. China’s 2024 medical-device law introduces new approval pathways that require parallel reimbursement filings Asia Actual. Manufacturers must therefore staff region-specific coding teams, increasing overhead and lengthening commercial lead times.
Rising payer denial rates for novel devices
Denials now affect 15% of device claims, although 45%–60% of challenged rejections are overturned Medical Economics. Payers frequently cite denial code 55 for investigational technology MD Clarity [mdclarity.com], signalling that FDA clearance is no longer sufficient. Digital therapeutics face particular hurdles because many lack clear Medicare benefit categories, leaving innovators to prove real-world savings before coverage is granted Medicare Payment Advisory Commission.
*Our forecasts treat driver/restraint impacts as directional, not additive. The impact forecasts reflect baseline growth, mix effects, and variable interactions.
Segment Analysis
By Device Category: Cardiovascular Dominance and Digital Surge
Cardiovascular devices held 27.45% medical device reimbursement market share in 2024, reflecting mature pathways for pacemakers, ICDs, and transcatheter valves Cardiovascular Business. NTAP placement of the Barostim device into APC 1580 yields a USD 45,000 outpatient payment ceiling through 2025, demonstrating premium pricing tolerance for transformative heart-failure technologies. Diagnostic-imaging equipment benefits from AI-supported reading efficiencies that secure positive coverage determinations, while orthopedic systems gain from TEAM-bundled incentives to curb revision rates.
Digital health and wearables post the fastest 9.10% CAGR to 2030, supported by Medicare’s rule that remote patient monitoring devices must transmit 16 readings every 30 days to qualify for payment Centers for Medicare & Medicaid Services. Embedded artificial-intelligence modules raise evaluation complexity, forcing payers to split hardware and software valuation under the FDA’s 2024 cybersecurity guidance FDA. The medical device reimbursement market size for connected wearables is projected to escalate as chronic-care programs shift monitoring into homes.


By End User: Hospitals Hold Ground, Home Care Climbs
Hospitals controlled 46.34% of the medical device reimbursement market size in 2024, a position anchored in high-acuity procedures and contract leverage over device suppliers. Episode-pricing models reward systems that standardise implants and curb supply variance, especially in orthopedic service lines bundled by TEAM. Ambulatory surgery centres pick up volume from minimally invasive procedures now reimbursed at site-neutral rates for disposable negative-pressure wound therapy devices at USD 276.57 in 2025 Centers for Medicare & Medicaid Services.
Home-health providers grow at a 10.25% CAGR, propelled by the 2.7% payment boost in the 2025 Home Health Prospective Payment System and by new acceptance-to-service rules that formalise patient intake criteria Centers for Medicare & Medicaid Services [cms.gov]. Monthly Advanced Primary Care Management codes at USD 15.20–USD 107.07 drive device makers to prioritise intuitive user interfaces and cloud-linked data pipelines. The emerging medical device reimbursement industry finds opportunity in turnkey service packages that pair equipment with value-based monitoring.
By Payer Type: Government Scale, Consumer Exposure
Government programs represented 57.63% share of the medical device reimbursement market in 2024, cemented by Medicare’s national coverage determinations that set the tone for private insurers. Public payers intensify value-based procurement, using episode targets and risk-adjustment models that mix hierarchical-condition-category methodologies to refine payments Centers for Medicare & Medicaid Services. Private insurers replicate these models, layering proprietary algorithms on top of CMS-published relative value units.
Self-pay expenditure climbs at an 11.45% CAGR as high-deductible plans expand and elective procedures shift costs toward consumers. Direct-pay channels especially flourish in aesthetic and wellness devices where patients accept out-of-pocket spending for rapid access. The medical device reimbursement industry confronts a dual reality: strict unit-price discipline from public payers and growing retail-style demand signals from consumers funding their own care.
Geography Analysis
North America’s 42.34% share in 2024 reflects sophisticated reimbursement rule-making led by Medicare’s aggressive move into bundled payments and by hospitals’ early adoption of AI billing tools American Hospital Association. Canada’s single-payer system guarantees predictable reimbursement once devices achieve provincial listings, although timelines differ across provinces. Mexican reforms that expand public coverage for high-cost oncology implants broaden addressable volumes but still lack unified payment codes.
APAC records the steepest 11.12% CAGR through 2030 thanks to large unmet need, government localisation policies, and mobile-health uptake. China’s Healthy China 2030 framework fosters domestic innovation while its updated 2024 device law tightens submission requirements Asia Actual. India invests in tertiary-care capacity and telehealth infrastructure, yet fragmented coding restricts immediate premium-device access. Australia recently extended reference-market inclusion rules that fast-track reimbursement evaluations for select imported devices Asia Actual.
Europe offers stable yet diverse reimbursement regimes anchored in health-technology assessments. Germany rewards proven outcome benefits, France emphasises cost-utility, and the United Kingdom refines post-Brexit pathways under the Medicines and Healthcare products Regulatory Agency. EU-wide cybersecurity expectations now mirror FDA provisions, aligning device-safety certification across the Atlantic FDA. Smaller European states adopt reference pricing that links device reimbursement to real-world results captured in larger neighbours, tightening evidence demands on suppliers entering these markets.
Competitive Landscape
The medical device reimbursement market remains moderately fragmented but is tilting toward scale. Optum’s 2024 integration with Change Healthcare created a platform that processes over 15 billion transactions annually Optum. In 2025 McKesson spent USD 850 million for an 80% stake in PRISM Vision Holdings to deepen specialty-care billing reach McKesson Corporation. New Mountain Capital’s USD 3 billion combination of Rawlings Group, Apixio, and Varis assembled payment-integrity expertise covering 160 million insured lives Eir Partners.
Technology is the main differentiator. AI-first clearinghouses detect coding anomalies in milliseconds, trimming the USD 100 billion improper-payment burden across federal programs. Blockchain pilots trial smart contracts that auto-release payment on verified outcome attainment, promising administrative cost cuts. FDA Section 524B pushes vendors to embed security-by-design, positioning cybersecurity credentials as a new market lever after the 2024 Change Healthcare breach disrupted USD 2.55 billion of Medicare payments Holland & Knight.
White-space potential lies in digital therapeutics and AI diagnostics that defy legacy benefit categories. Suppliers that pair economic guarantees with clinical dashboards are winning early conditional coverage, signalling a shift from product-centric selling to service-oriented value propositions that blend device, software, and analytics under one reimbursement-ready contract.
Medical Devices Reimbursement Industry Leaders
Allianz
UnitedHealthcare
Cigna Healthcare
Aetna Inc.
Anthem Insurance Companies, Inc.
- *Disclaimer: Major Players sorted in no particular order

Recent Industry Developments
- February 2025: McKesson acquires 80% of PRISM Vision Holdings for USD 850 million, expanding ophthalmology reimbursement services McKesson Corporation.
- September 2024: Rawlings Group, Apixio, and Varis merge into a USD 3 billion payment-accuracy platform serving 160 million members Eir Partners.


Research Methodology Framework and Report Scope
Market Definitions and Key Coverage
Our study defines the medical devices reimbursement market as all monetary transfers from public insurers, commercial insurers, and out-of-pocket payers that are specifically earmarked to cover the cost of diagnostic, therapeutic, and monitoring devices used across hospitals, ambulatory centers, specialty clinics, and home-care settings. Values are expressed in nominal U.S. dollars and include administrative fees that are bundled with the device claim.
Scope Exclusions. We deliberately omit pharmacy dispensing fees, stand-alone service reimbursements, and capital equipment leasing charges, as these are tracked in separate Mordor Intelligence studies.
Segmentation Overview
- By Device Category (Value)
- Diagnostic Imaging Devices
- Cardiovascular Devices
- Orthopedic Devices
- In-Vitro Diagnostics (IVD)
- Surgical Instruments
- Digital Health & Wearables
- Others
- By End User (Value)
- Hospitals
- Ambulatory Surgical Centers
- Specialty Clinics
- Home-Healthcare Providers
- Medical Device Manufacturers
- By Payer Type (Value)
- Public / Government
- Private / Commercial
- Self-pay / Out-of-pocket
- By Geography (Value)
- North America
- United States
- Canada
- Mexico
- South America
- Brazil
- Argentina
- Rest of South America
- Europe
- United Kingdom
- Germany
- France
- Italy
- Spain
- Russia
- Rest of Europe
- Asia-Pacific
- China
- Japan
- India
- South Korea
- Australia
- Rest of Asia-Pacific
- Middle East and Africa
- GCC
- South Africa
- Rest of Middle East and Africa
- North America
Detailed Research Methodology and Data Validation
Primary Research
We supplemented the desk work with interviews and short surveys involving hospital reimbursement managers, private insurer benefit analysts, and ministry of health officials across North America, Europe, and key Asia-Pacific economies. These conversations helped us validate co-payment levels, emerging device categories gaining coverage, and the typical lag between policy approval and first claims.
Desk Research
We began by mining authoritative open data sets such as CMS National Health Expenditure tables, Eurostat health-care financing accounts, and OECD SHA databases, which gave us payer-level spending splits. Trade bodies like MedTech Europe and the Advanced Medical Technology Association added device-specific outlay trends, while peer-reviewed journals supplied benchmark ratios for procedure-to-device cost apportioning. Our team then pulled firm-level revenue clues from SEC 10-Ks, investor decks, and healthcare budget bills, and we checked news flows via Dow Jones Factiva to spot sudden policy shifts that might distort year-on-year growth. This list illustrates, not exhausts, the secondary sources we accessed for data gathering, sense-checking, and context.
Market-Sizing & Forecasting
Our model starts with a top-down reconstruction of national health spending that is disaggregated into device-related payouts using historical shares, procedure volumes, and average claim values. Results are cross-checked through a selective bottom-up roll-up of leading payer spend plus sampled average selling price multiplied by units for high-ticket categories to align totals. Key variables include cardiac implant penetration, point-of-care testing uptake, public-private insurance mix, aging-population growth, regulatory reimbursement ceilings, and local currency inflation. We forecast using multivariate regression blended with scenario analysis to capture shifts in value-based purchasing rules flagged by our primary sources. Gaps in category granularity are bridged with nearest-neighbor ratios from countries with fuller data.
Data Validation & Update Cycle
Before sign-off, Mordor analysts triangulate model outputs against external expenditure indicators, flag anomalies for senior review, and rerun sensitivities. Reports refresh annually, and we trigger mid-cycle revisions whenever substantive policy or pricing events arise. A final analyst pass ensures clients receive the latest vetted view.
Why Mordor's Medical Devices Reimbursement Baseline Stands Firm
Published estimates differ because firms choose divergent device lists, payer mixes, and update cadences. Our disciplined scope selection and yearly refresh keep the baseline current and transparent for decision makers.
Benchmark comparison
| Market Size | Anonymized source | Primary gap driver |
|---|---|---|
| USD 619.70 B (2025) | Mordor Intelligence | - |
| USD 832.75 B (2025) | Global Consultancy A | Includes bundled service fees and telehealth hardware, inflating totals |
| USD 621.38 B (2025) | Market Analyst B | Excludes self-pay segment, leading to narrower pool |
| USD 552.52 B (2024) | Industry Publisher C | Older base year and static currency rates, understating present value |
The comparison shows that diverging scopes and price escalator choices explain most gaps. By anchoring estimates to payer-verified claim data and updating currency conversions quarterly, Mordor delivers a balanced, repeatable baseline clients can rely on.


Key Questions Answered in the Report
How big is the Medical Devices Reimbursement Market?
The Medical Devices Reimbursement Market size is expected to reach USD 619.70 billion in 2025 and grow at a CAGR of 8.90% to reach USD 949.11 billion by 2030.
What is the current size of the medical device reimbursement market?
The medical device reimbursement market is valued at USD 619.70 billion in 2025 and is projected to grow to USD 949.11 billion by 2030 at an 8.90% CAGR.
Which device category generates the highest reimbursement revenue?
Cardiovascular devices lead, holding 27.45% of medical device reimbursement market share in 2024, supported by established payment pathways for pacemakers, ICDs, and transcatheter valves.
Why is APAC considered the fastest-growing region?
APAC posts an 11.12% CAGR through 2030, driven by government initiatives that expand domestic manufacturing capacity and by rapid adoption of remote-monitoring technologies.
How will CMS’s TEAM model change reimbursement?
Starting 2026, TEAM embeds device costs inside bundled payments for five surgical episodes worth USD 18 billion annually, pushing hospitals to prioritise total-episode value over individual device prices.
What role does artificial intelligence play in reimbursement?
About 46% of hospitals leverage AI to predict denials and optimise coding, trimming claims-processing times by up to 50% while reducing administrative waste.
Page last updated on:


