Marine Fenders Market Size and Share
Market Overview
| Study Period | 2019 - 2030 |
|---|---|
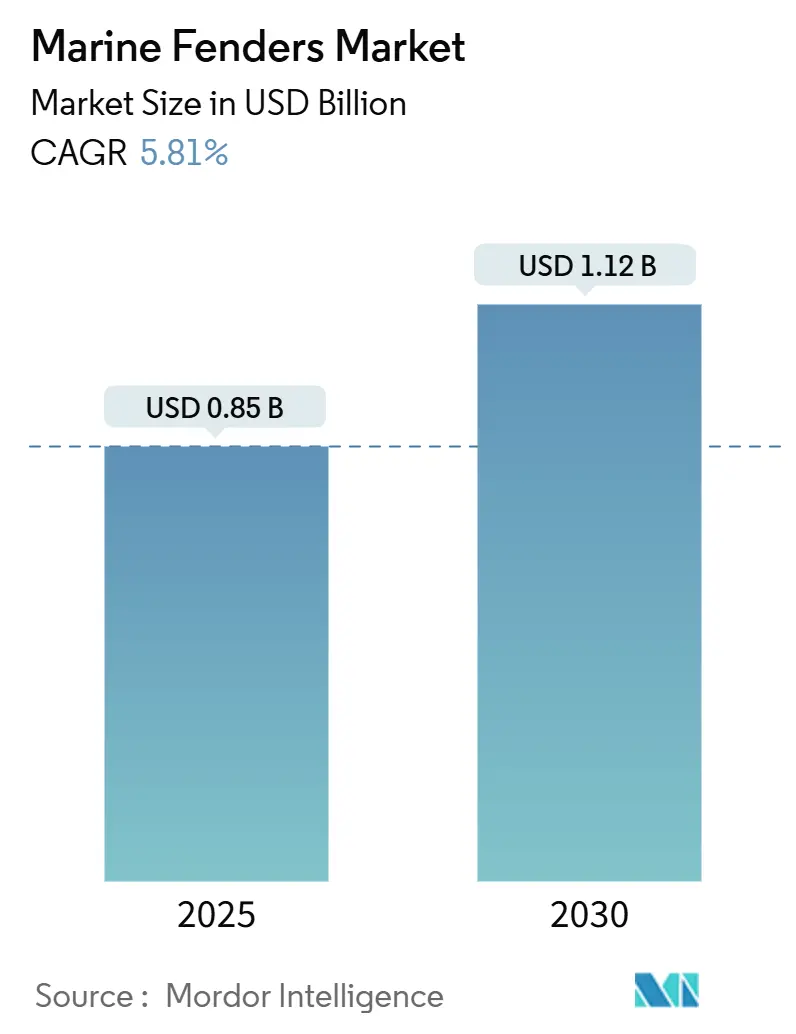
| Market Size (2025) | USD 0.85 Billion |
| Market Size (2030) | USD 1.12 Billion |
| Growth Rate (2025 - 2030) | 5.81% CAGR |
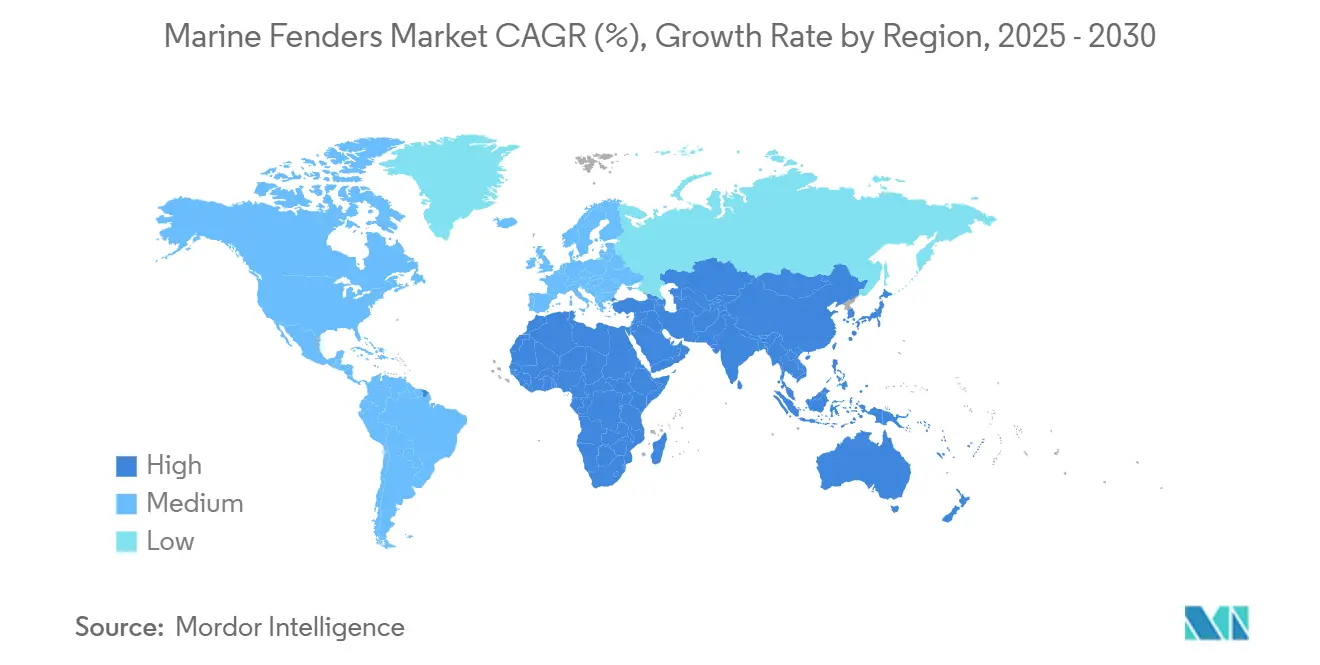
| Fastest Growing Market | Middle East and Africa |
| Largest Market | Asia Pacific |
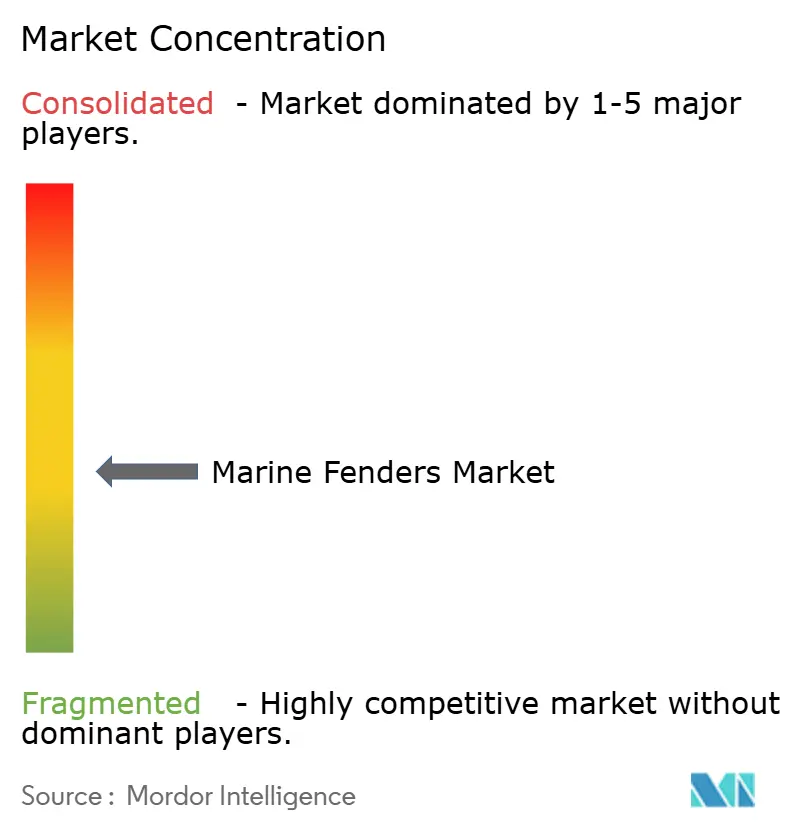
| Market Concentration | Medium |
Major Players *Disclaimer: Major Players sorted in no particular order Image © Mordor Intelligence. Reuse requires attribution under CC BY 4.0. | |
Marine Fenders Market Analysis by Mordor Intelligence
The Marine Fenders Market size is estimated at USD 0.85 billion in 2025, and is expected to reach USD 1.12 billion by 2030, at a CAGR of 5.81% during the forecast period (2025-2030). The steady trajectory is underpinned by global seaborne trade that now moves around four-fifths of all goods, rising container-port throughput, and a persistent need to protect vessels and port infrastructure from berthing impacts. Rising investments in mega-container terminals, LNG facilities, and offshore renewable platforms keep procurement momentum high. Port authorities favor advanced rubber and foam technologies with predictive-maintenance sensors to reduce unplanned berth downtime. Supply‐side pressures from volatile natural-rubber prices and high retrofit costs for legacy berths temper near-term margins, yet the marine fenders market continues to benefit from defense modernization, smart-port adoption, and stricter PIANC / ISO guidelines that require certified high-energy-absorption systems.
Key Report Takeaways
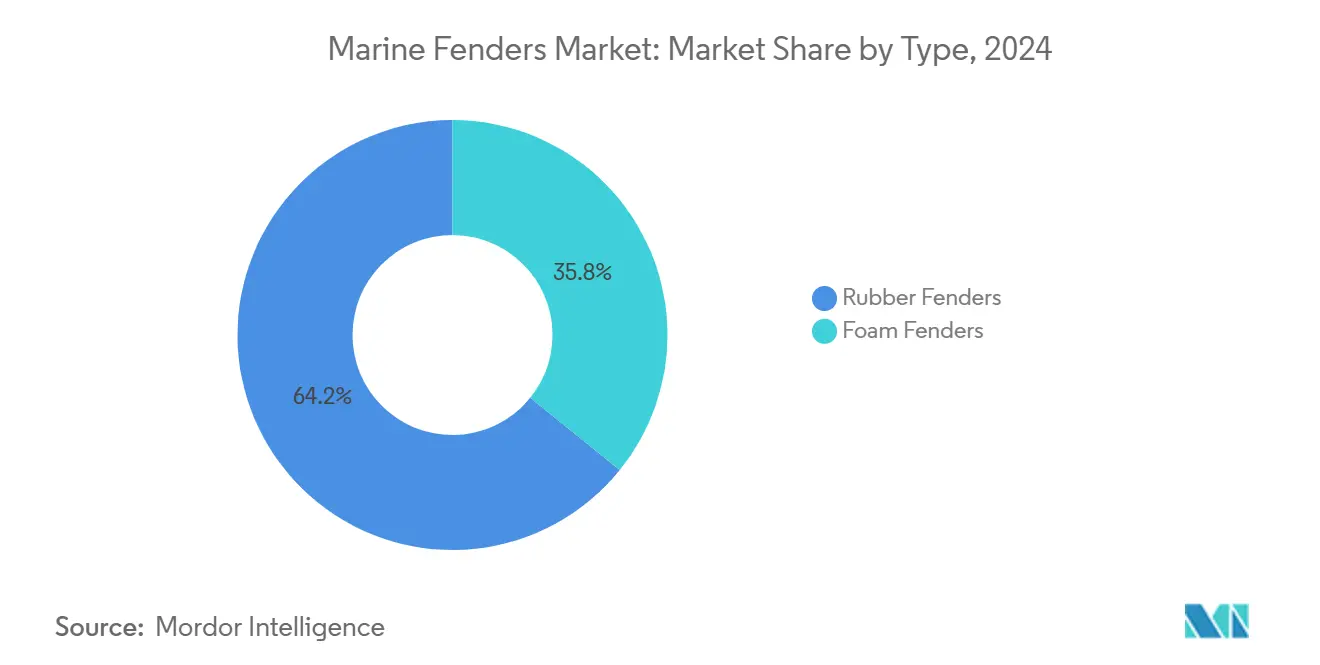
- By type, rubber fenders commanded 64.17% of marine fenders market share in 2024, whereas foam fenders are projected to grow at a 5.87% CAGR through 2030.
- By manufacturing process, extrusion held 56.37% share of the marine fenders market size in 2024, while molding is set to expand at 5.85% CAGR to 2030.
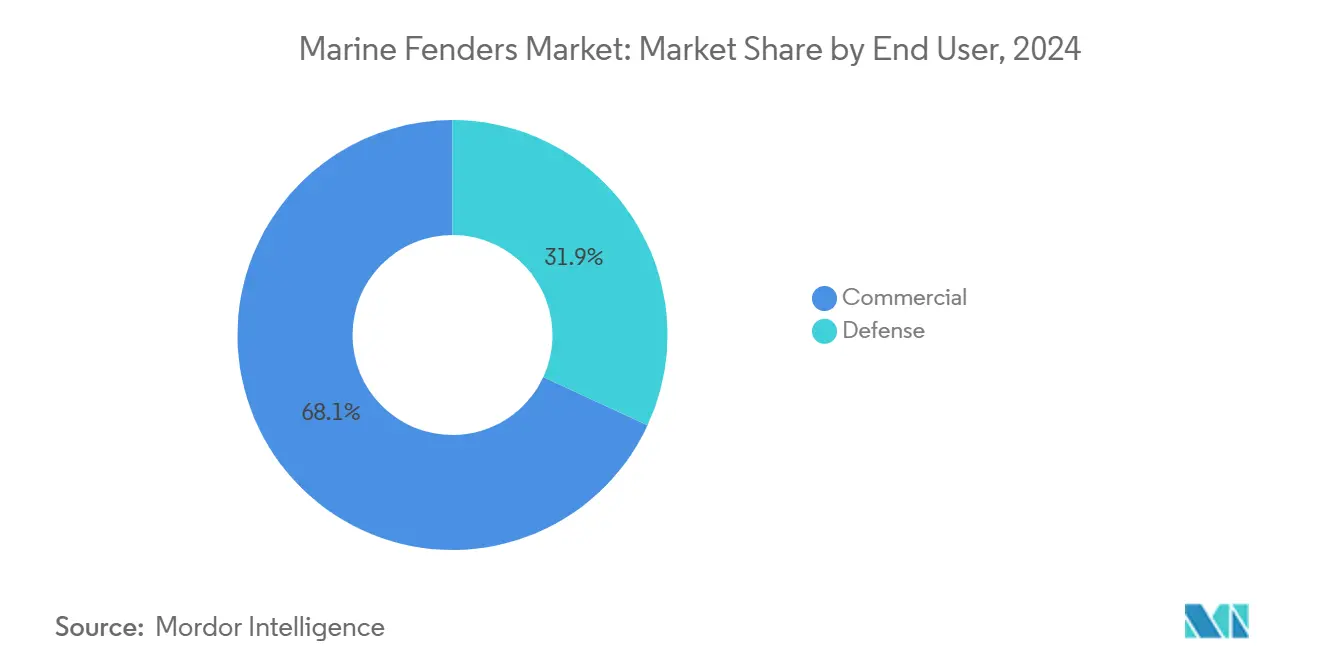
- By end-user, the commercial segment contributed 68.14% revenue in 2024; the defense segment is advancing at a 5.93% CAGR to 2030.
- By installation location, dock systems captured 57.85% share of the marine fenders market size in 2024, whereas ship-side applications are pacing fastest at a 5.98% CAGR.
- By geography, Asia-Pacific occupied 36.73% of marine fenders market share in 2024; the Middle East & Africa segment records the highest regional CAGR at 5.94% to 2030.
Global Marine Fenders Market Trends and Insights
Drivers Impact Analysis*
| Driver | (~) % Impact on CAGR Forecast | Geographic Relevance | Impact Timeline |
|---|---|---|---|
| Rising Global Seaborne Trade Volumes | +1.8% | Global, with Asia Pacific leading growth | Long term (≥ 4 years) |
| Expansion Of Mega-Container | +1.5% | Asia-Pacific, Middle East and Africa | Medium term (2-4 years) |
| Naval Modernization Programs | +0.8% | North America, Europe, Asia-Pacific | Long term (≥ 4 years) |
| Stricter PIANC/ISO Port-Safety Regulations | +0.6% | Global, with Europe leading compliance | Medium term (2-4 years) |
| Sensor-Integrated "Smart" Fenders Enabling Predictive Maintenance | +0.4% | North America, Europe, advanced Asia Pacific ports | Short term (≤ 2 years) |
| Offshore Renewable Projects Requiring Specialty Fenders | +0.3% | Europe, North America, emerging Asia Pacific markets | Long term (≥ 4 years) |
| Source: Mordor Intelligence | |||
Rising Global Seaborne Trade Volumes
World seaborne trade expanded drastically from 1970 to 2021, spurring continuous berth upgrades and fender replacements. Container throughput grew more than half between 2010 and 2022, and larger vessels above 20,000 TEU now demand energy-absorption ratings previously unneeded. Traffic rerouting around the Suez Canal in 2024 pushed port operators to accelerate fender procurement for alternative hubs. Higher call frequencies shorten replacement cycles, favoring premium systems with certified fatigue life. The marine fenders market therefore benefits directly from every incremental ton of maritime cargo handled.
Expansion Of Mega-Container & Lng Terminals
Projects such as the Commonwealth LNG terminal in Louisiana and the Paradip port expansion in India set high performance baselines for fenders. LNG carriers impose strict positional tolerances and high windage loads, prompting ports to specify foam-filled or pneumatic units with extended warranties. Floating LNG facilities like Grand Isle add offshore demand for portable fenders rated to absorb lateral impacts during cargo transfer. Procurement departments increasingly mandate certified service lives beyond 25 years, driving a technology shift toward wear-free skins and closed-cell cores.
Naval Modernization Programs Boosting Defense Demand
The overhaul of Norfolk Naval Shipyard to berth Ford-class carriers highlights defense-sector requirements for robust, security-graded fenders. Military buyers demand materials resilient to blast loads, extreme climates, and electromagnetic signatures. Faster dry-dock turnarounds reduce operational downtime, so suppliers offer modular cone and cell systems installable without hot-work on quay walls. Geopolitical tensions raise naval budgets globally, enlarging the addressable marine fenders market in this niche.
Stricter Pianc/Iso Port-Safety Regulations
PIANC 2002 guidelines and ISO 17357 set minimum four-fifths energy-absorption criteria and minimal residual strain limits, effectively excluding low-grade imports. Europe embeds these standards in national port codes, and Japan adopted them within public-works specifications in 2010. Certification costs elevate entry barriers, consolidating demand around established brands. Regulators now pilot predictive-maintenance mandates, encouraging sensor integration that pushes average selling prices higher.
Restraints Impact Analysis*
| Restraint | (~) % Impact on CAGR Forecast | Geographic Relevance | Impact Timeline |
|---|---|---|---|
| Volatile Natural-Rubber Prices | -1.2% | Global, with Asia-Pacific production centers most affected | Short term (≤ 2 years) |
| High Installation and Retrofit Costs | -0.8% | North America, Europe mature port infrastructure | Medium term (2-4 years) |
| Intense Price Pressure From Low-Cost Asian Entrants | -0.6% | Global, with Europe and North America premium markets most affected | Medium term (2-4 years) |
| Longer Life Of Foam-Filled and Pneumatic Designs | -0.4% | Global, with developed markets leading adoption | Long term (≥ 4 years) |
| Source: Mordor Intelligence | |||
Volatile Natural-Rubber & Petro-Chemical Input Prices
Natural-rubber output is forecast to lag demand for a fifth straight year in 2025, as Thailand and Indonesia battle labor shortages and weather swings. Styrene-butadiene rubber prices also rose with petrochemical feedstock spikes, elevating bill-of-materials costs by up to one-tenth. Fender suppliers pass some increases to buyers, but long-term framework contracts limit flexibility, compressing margins. Manufacturers intensify R&D on bio-based thermoplastic polyurethanes to hedge raw-material volatility. The cost headwind most acutely affects price-sensitive port operators in emerging markets, restraining near-term adoption.
High Installation & Retrofit Costs For Legacy Berths
Upgrading 1970s-era timber piles to modern cone fenders demands quay-wall drilling, resin anchoring, and berth closures that can surpass fender hardware costs by threefold. Ports in North America and Europe often defer projects, opting for patch repairs that raise maintenance budgets but delay capital outlays. Engineering studies must confirm structural reinforcement to handle higher energy ratings, extending project timelines. These hurdles slow replacement cycles at mature ports, curbing immediate growth for the marine fenders market despite clear long-term benefits.
*Our forecasts treat driver/restraint impacts as directional, not additive. The impact forecasts reflect baseline growth, mix effects, and variable interactions.
Segment Analysis
By Type: Rubber Dominance Faces Foam Innovation
Rubber products accounted for 64.17% of the marine fenders market share in 2024, outpacing foam alternatives. Foam units, however, are gaining traction with a 5.87% CAGR that exceeds the broader marine fenders market. Commercial ports value rubber’s cost efficiency and proven cell, cone, and cylindrical designs, yet military and offshore operators increasingly select foam for its zero-maintenance closed-cell core and higher abrasion tolerance. Hybrid formulations that embed foam cores within rubber sleeves target users seeking the best of both systems. Over the forecast window, foam suppliers will press the channel with warranties exceeding 30 years, narrowing lifecycle-cost advantages long held by rubber.
Cell, cone, and arch forms remain staples under the rubber umbrella, each tailored to vessel displacement and hull geometry. Cone fenders exhibit efficient energy per ton ratios suited for ultra-large container ships. Cylinder and pneumatic variants dominate ship-to-ship operations, whereas arch types serve small coastal docks. Foam-filled buoys increasingly protect offshore platforms, floating LNG units, and naval piers. Sustainability pressure propels R&D in bio-elastomers, and breakthroughs like biodegradable TPU skins could erode rubber’s incumbency. Vigorous competition keeps average selling prices stable even as the marine fenders market grows.


By Manufacturing Process: Extrusion Leads Molding Innovation
Extrusion lines produced 56.37% of the marine fenders market size in 2024, largely covering commoditized D- and square profiles for low-to-medium energy berths. Molding processes post a 5.85% CAGR, propelled by demand for complex geometries that extrusion cannot achieve. Cone, cell, and element designs rely on precision molding to maintain dimensional tolerances and integrate reinforcement ribs. Automated presses with digital curing profiles raise consistency while trimming scrap rates, improving cost parity with extrusion for larger parts.
Suppliers now combine automated material mixing, vision inspection, and robotic demolding to cut cycle times by two-fifths. Some plants embed RFID tags during molding, allowing life-cycle tracking once installed. Extrusion maintains relevance through capacity scale and rapid changeovers, serving ferry terminals and inland docks that favor standard profiles. Innovation in mandrel design improves profile uniformity, yet gains are incremental. In contrast, molding opens avenues for embedded sensor housings and composite inserts, aligning with smart-port programs that value predictive maintenance features.
By End-User: Commercial Dominance Amid Defense Growth
Commercial operators represented 68.14% of marine fenders market revenue in 2024, a function of global container throughput expansion. These buyers stress lifecycle cost and low service interruption, placing a premium on warranties and certified energy ratings. Many ports adopt drone-based inspection to optimize replacement timing, minimizing berth downtime. Defense demand, while smaller, grows at 5.93% annually as navies modernize dry docks for next-generation carriers and submarines. Contracts often specify MIL-STD coatings, blast-resistant designs, and anti-spark properties, with acceptance testing more rigorous than in commercial tenders.
Defense spending is less cyclical than trade volumes, affording suppliers volume stability. Naval bases also opt for portable pneumatic units that can redeploy with fleet movements, extending product variety. Commercial terminals face rising vessel size, necessitating high-performance cone fenders and high-density foam variants. Both segments converge on sensor-enabled systems that feed berth-management software, though security constraints sometimes limit data sharing at military sites.
By Installation Location: Dock Systems Lead Ship Applications
Fixed dock installations held 57.85% of the marine fenders market revenue in 2024, reflecting the ubiquity of quay-wall protection across 10,000+ commercial berths worldwide. These systems favor modular cone, cell, and element units anchored with steel bolts and UHMW-PE pads, ensuring low friction during vessel contact. Ship-side fenders, registering a 5.98% CAGR, benefit from increased ship-to-ship transfers of crude, LNG, and ammonium nitrate. Operators favor pneumatic Y-okohama-type units and foam-filled buoys that can be rapidly deployed.
Dock owners prioritize systems with long service lives and minimal pier maintenance, while ship operators look for fenders that stow easily and resist UV degradation. The rise of offshore floating wind and aquaculture farms creates new avenues for ship-side fender sales. Engineering consultancies advise on mixed installations where fixed cone units combine with floating foam elements to accommodate wide tidal ranges, as exemplified by the Uig Ferry Terminal project in Scotland.
Geography Analysis
Asia-Pacific generated 36.73% of 2024 revenue, anchored by China’s manufacturing scale and ongoing port megaprojects like Vadhvan, which positions India among the top global container hubs[1. Regional governments earmark multi-billion-dollar spending on smart-port automation, ensuring steady uptake of high-specification fenders. Supplier proximity reduces logistics cost, reinforcing Asia-Pacific’s leadership in the marine fenders market.
The Middle East & Africa segment records the fastest 5.94% CAGR through 2030, catalyzed by Saudi Arabia’s logistics roadmap and DP World’s USD 3 billion African port portfolio by 2029[2]“African Ports Investment Plan 2024,” DP World, dpworld.com . Coastal states upgrade berths to handle critical mineral exports, and LNG ambitions in Qatar and Mozambique add specialty foam demand. Limited local manufacturing capacity allows international players to set up assembly plants or license technology.
North America and Europe retain sizeable shares through naval modernization and environmental regulation that mandate PIANC-compliant systems. Both regions invest in predictive-maintenance platforms, accelerating upgrades at mature terminals despite high retrofit costs. South America shows emerging growth tied to grain and lithium exports, yet funding volatility slows project finalization. Overall, geographic diversification cushions suppliers against regional downturns and keeps the marine fenders market on a stable ascent.

Competitive Landscape
The marine fenders market features moderate fragmentation with a cluster of global leaders and numerous regional specialists. Trelleborg Marine & Infrastructure deploys over a lakh units worldwide and is constructing a Vietnam plant to reinforce Asia-Pacific delivery timelines by 2026[3]“Corporate Fact Sheet 2025,” Trelleborg Marine & Infrastructure, trelleborgmarine.com . ShibataFenderTeam leverages German engineering and Asian manufacturing to offer turnkey solutions including design software and onsite commissioning. In China, Qingdao Xincheng aggressively competes on price, delivering EVA foam-filled fenders that have seen a significant per-unit price increase[4]“Product Catalog 2025,” Qingdao Xincheng, xcrubber.com .
Technology convergence sees fender makers branch into automated mooring equipment like Trelleborg’s DynaMoor, bundling fender supply with integrated quay solutions that raise switching costs for customers. Patent filings under WIPO for sensor-embedded elastomers and digital twins have tripled since 2018, signaling an R&D race.
Market entry barriers include certification expenses, track-record requirements, and global service networks. Suppliers differentiate through remote monitoring centers and predictive-maintenance contracts that lock in annuity revenue. Niche entrants focus on biodegradable materials or specialty offshore designs to carve share without confronting incumbents head-on.
Marine Fenders Industry Leaders
Trelleborg Marine & Infrastructure
Bridgestone Corp. (Marine Products)
Yokohama Rubber Co., Ltd.
ShibataFenderTeam AG
Sumitomo Rubber Industries
- *Disclaimer: Major Players sorted in no particular order

Recent Industry Developments
- May 2024: Sumitomo Electric began work on a USD 441 million (GBP 350 million) subsea-cable plant at Port of Nigg, Scotland, to support offshore-wind transmission and create 150 skilled jobs.
- March 2024: Algenesis Corporation and UC San Diego announced a biodegradable thermoplastic polyurethane aimed at marine coatings and fender skins, mitigating micro-plastic pollution.


Global Marine Fenders Market Report Scope
| Rubber Fenders | Cell Fenders |
| Cone Fenders | |
| Cylindrical Fenders | |
| Arch Fenders | |
| Others | |
| Foam Fenders |
| Extrusion |
| Molding |
| Other Manufacturing Processes |
| Defense |
| Commercial |
| Ship Fenders |
| Dock Fenders |
| Others |
| North America | United States |
| Canada | |
| Rest of North America | |
| South America | Brazil |
| Argentina | |
| Rest of South America | |
| Europe | Germany |
| United Kingdom | |
| Spain | |
| Italy | |
| France | |
| Netherlands | |
| Rest of Europe | |
| Asia-Pacific | India |
| China | |
| Japan | |
| South Korea | |
| Indonesia | |
| Rest of Asia-Pacific | |
| Middle East and Africa | United Arab Emirates |
| Saudi Arabia | |
| Turkey | |
| Egypt | |
| South Africa | |
| Rest of Middle East and Africa |
| By Type | Rubber Fenders | Cell Fenders |
| Cone Fenders | ||
| Cylindrical Fenders | ||
| Arch Fenders | ||
| Others | ||
| Foam Fenders | ||
| By Manufacturing Process | Extrusion | |
| Molding | ||
| Other Manufacturing Processes | ||
| By End-User | Defense | |
| Commercial | ||
| By Installation Location | Ship Fenders | |
| Dock Fenders | ||
| Others | ||
| Geography | North America | United States |
| Canada | ||
| Rest of North America | ||
| South America | Brazil | |
| Argentina | ||
| Rest of South America | ||
| Europe | Germany | |
| United Kingdom | ||
| Spain | ||
| Italy | ||
| France | ||
| Netherlands | ||
| Rest of Europe | ||
| Asia-Pacific | India | |
| China | ||
| Japan | ||
| South Korea | ||
| Indonesia | ||
| Rest of Asia-Pacific | ||
| Middle East and Africa | United Arab Emirates | |
| Saudi Arabia | ||
| Turkey | ||
| Egypt | ||
| South Africa | ||
| Rest of Middle East and Africa | ||


Key Questions Answered in the Report
What is driving demand for marine fenders after 2025?
Rising container throughput, mega-terminal projects, and stricter PIANC / ISO safety standards sustain steady growth.
How large will the marine fenders market be by 2030?
Forecast value is USD 1.12 billion, reflecting a 5.81% CAGR from 2025.
Which region is expanding fastest in marine fender adoption?
The Middle East & Africa records a 5.94% CAGR through 2030 due to large-scale port investments.
Are foam fenders overtaking rubber units?
Foam systems grow faster at 5.87% CAGR but rubber still held 64.17% share in 2024.
How are smart-port initiatives affecting fender procurement?
Ports integrate sensors for predictive maintenance, raising specification levels and average selling prices.
Page last updated on:


