Marine Propulsion Engine Market Size and Share
Market Overview
| Study Period | 2019 - 2031 |
|---|---|
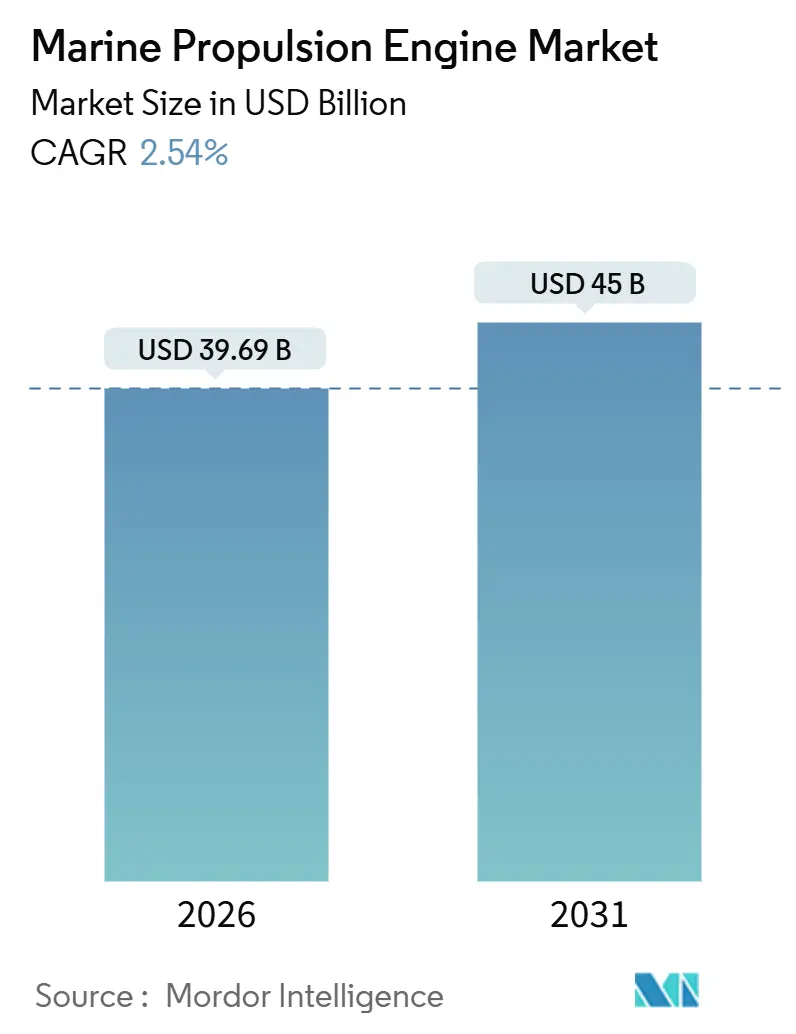
| Market Size (2026) | USD 39.69 Billion |
| Market Size (2031) | USD 45 Billion |
| Growth Rate (2026 - 2031) | 2.54% CAGR |
| Fastest Growing Market | Middle East |
| Largest Market | Asia-Pacific |
| Market Concentration | Medium |
Major Players *Disclaimer: Major Players sorted in no particular order Image © Mordor Intelligence. Reuse requires attribution under CC BY 4.0. | |
Marine Propulsion Engine Market Analysis by Mordor Intelligence
The marine propulsion engine market size stood at USD 39.69 billion in 2026 and is projected to reach USD 45 billion by 2031, registering a 2.54% CAGR over the forecast period (2026-2031). The measured expansion reflects operators’ preference for repowering existing hulls rather than building new tonnage, as IMO Tier III nitrogen-oxide limits and the Energy Efficiency Existing Ship Index drive capital toward dual-fuel and hybrid platforms. Dual-fuel orders that toggle between LNG, methanol, and traditional fuel oil now dominate backlogs, while hybrid-electric auxiliaries gain traction in emission-control areas. Asia-Pacific continues to underpin demand thanks to Chinese and South Korean yards, but sovereign investment in the Middle East is the fastest-growing regional catalyst. Heightened bunker-price volatility and limited alternative-fuel infrastructure are expected to temper the near-term pace; however, digital-twin maintenance platforms and fuel-agnostic engine architectures are anticipated to sustain long-term efficiency gains across the marine propulsion engine market.
Key Report Takeaways
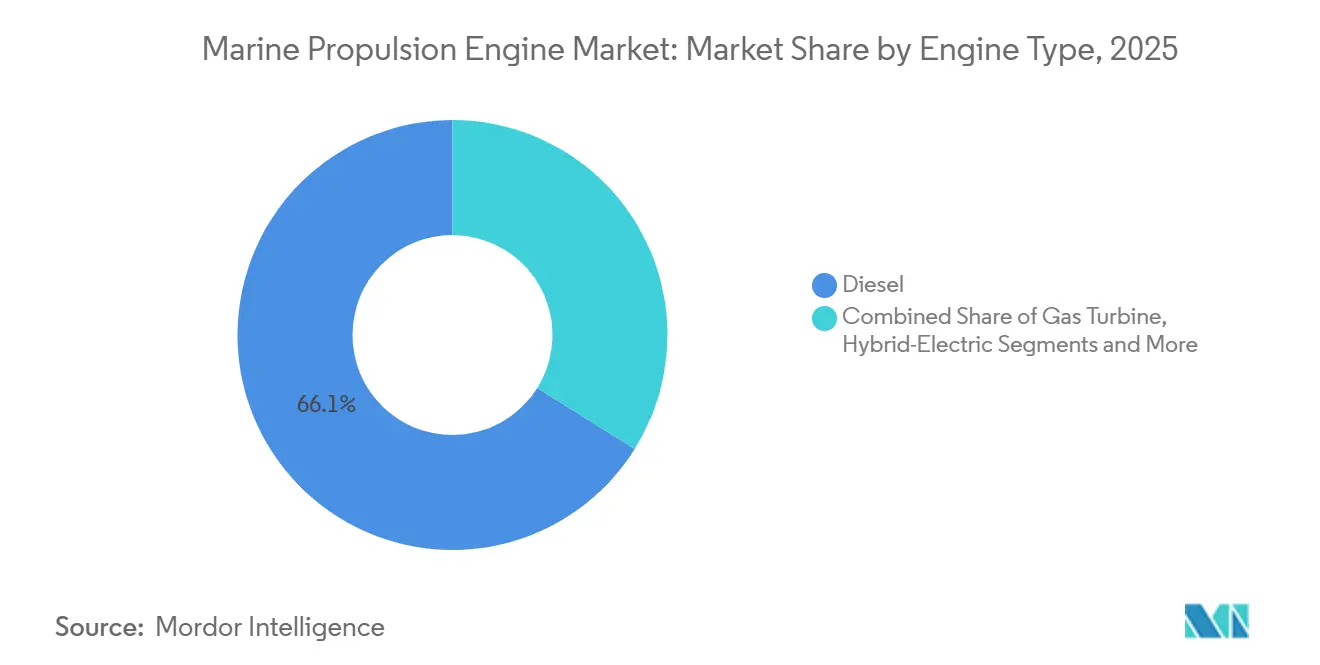
- By engine type, diesel commanded 66.12% of the marine propulsion engine market share in 2025, while fuel-cell systems are projected to grow at a 2.76% CAGR to 2031.
- By application, commercial cargo held 57.37% of the marine propulsion engine market size in 2025; passenger shipping is set to expand at a 2.41% CAGR through 2031.
- By ship type, bulk carriers led with 31.28% revenue share in 2025; offshore support vessels are poised for a 3.12% CAGR during the forecast window.
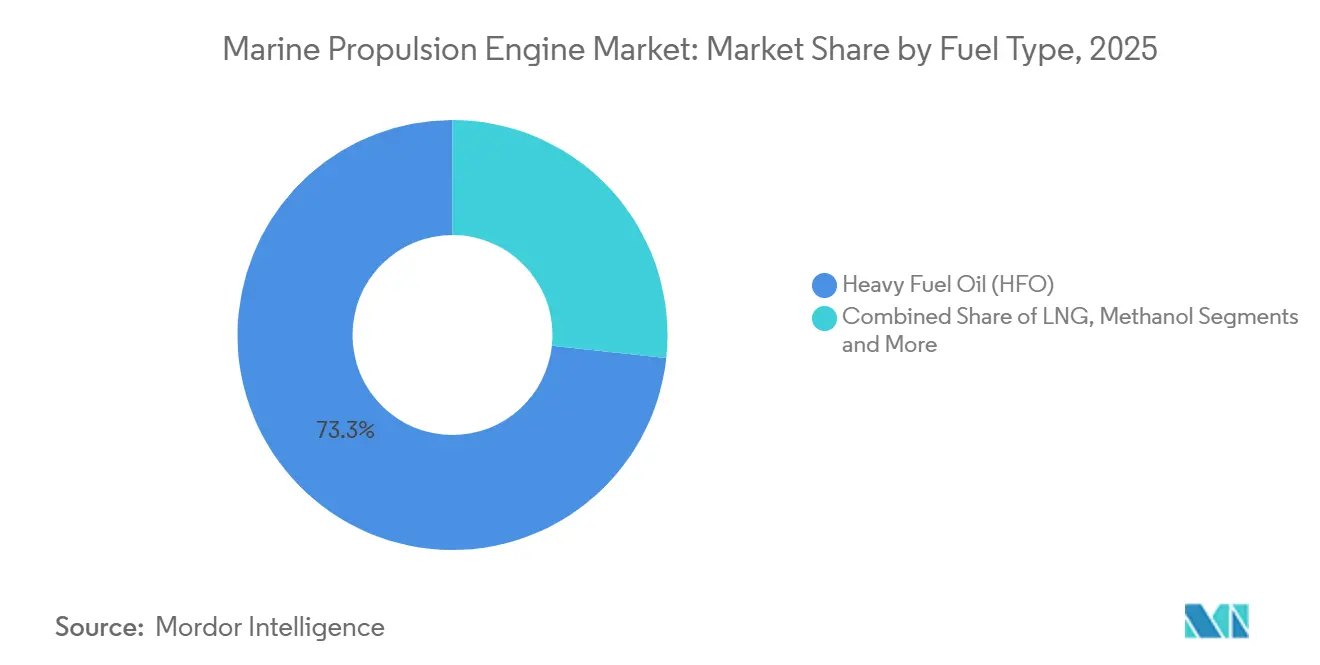
- By fuel type, HFO accounted for a 73.25% share of the marine propulsion engine market size in 2025, whereas methanol is forecast to advance at a 2.88% CAGR to 2031.
- By power range, engines with a capacity of 10,001-20,000 kW captured 37.11% of the marine propulsion engine market size in 2025; units above 20,000 kW are projected to post the fastest growth rate of 3.24% through 2031.
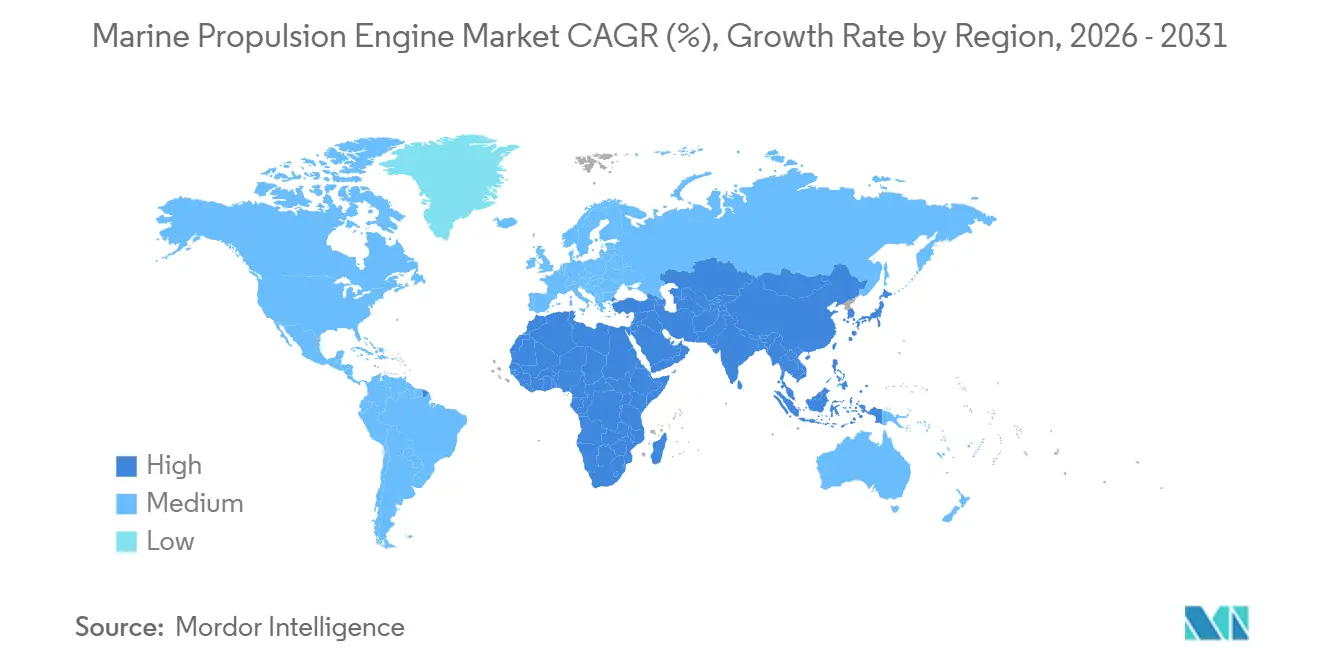
- By geography, the Asia-Pacific region accounted for 43.36% of the marine propulsion engine market share in 2025; the Middle East and Africa are projected to grow at a 3.37% CAGR through 2031.
Note: Market size and forecast figures in this report are generated using Mordor Intelligence’s proprietary estimation framework, updated with the latest available data and insights as of January 2026.
Global Marine Propulsion Engine Market Trends and Insights
Drivers Impact Analysis*
| Driver | (~) % Impact on CAGR Forecast | Geographic Relevance | Impact Timeline |
|---|---|---|---|
| Engine Retrofits Accelerated by IMO Tier III and EEXI | +0.6% | Global, strongest in EU and North America | Short term (≤ 2 years) |
| Asia-Pacific Surge in Container and LNG Orders | +0.5% | China, South Korea, Japan, Southeast Asia | Medium term (2–4 years) |
| Rapid Uptake of LNG & Methanol Dual-Fuel | +0.4% | Europe, North America, Asia-Pacific | Medium term (2–4 years) |
| Zero-Emission Auxiliary Propulsion in Port Zones | +0.3% | Rotterdam, Antwerp, Hamburg, California, Singapore | Short term (≤ 2 years) |
| Digital-Twin Predictive Maintenance Cuts Ownership Costs | +0.2% | Global, early lead in North America and Northern Europe | Long term (≥ 4 years) |
| Defense CODAD and CODAG Procurement Boom | +0.2% | North America, Europe, India, Australia | Long term (≥ 4 years) |
| Source: Mordor Intelligence | |||


IMO Tier III and EEXI Compliance Push Retrofits
Owners of vessels built before a specific period are required to install SCR or EGR systems to comply with nitrogen-oxide limits in emission-control zones. Many owners are also implementing dual-fuel conversions alongside these upgrades to achieve operational flexibility [1] “Energy Efficiency Existing Ship Index Guidelines,” International Maritime Organization, imo.org. The Energy Efficiency Existing Ship Index assigns letter grades to ship hulls, and vessels with lower grades have faced charter penalties in European markets. Retrofit orders for SCR units have increased at MAN Energy Solutions, reflecting carriers' focus on upgrading existing assets rather than commissioning new builds during freight rate fluctuations. FuelEU Maritime will enforce stricter limits on greenhouse-gas intensity, driving European-bound tonnage toward engines capable of transitioning to fuels like methanol or ammonia [2]“FuelEU Maritime Regulation Text,” European Commission, europa.eu. Current classification regulations integrate emissions monitoring into engine control software, providing financiers and insurers with compliance data and contributing to the trend of retrofitting.
Asia-Pacific Container and LNG New-Build Boom
Chinese and South Korean shipyards increased container capacity deliveries, driven by orders for large vessels equipped with advanced dual-fuel two-stroke engines. LNG carrier orderbooks reached new heights, supported by charter commitments tied to Qatar’s North Field expansion and export terminals in the United States. Hanwha Ocean invested significantly to enhance its Geoje engine-integration line, focusing on methanol-ready modules designed for future deliveries to Maersk. Japanese shipyards shifted their focus to ammonia-fueled coastal tankers, successfully delivering the prototype to Nippon Yusen. While the concentration of engine production in Northeast Asia has reduced lead times, it has also heightened geopolitical risks due to tighter export restrictions on advanced control electronics from the United States.
LNG/Methanol Dual-Fuel Uptake
Maersk has added methanol-capable container ships to its orderbook, each equipped with MAN B&W engines that can operate on bio-methanol, e-methanol, and fuel oil. CMA CGM has introduced LNG-powered ships, achieving significant reductions in CO₂ emissions compared to heavy-fuel baselines. Dual-fuel contracts now account for a notable portion of Wärtsilä’s marine backlog, reflecting shipowners’ increasing preference for fuel flexibility. Rotterdam has established Europe’s first large-scale green methanol bunkering hub, while Singapore has initiated a pilot program to address supply chain constraints. Although capital costs are higher, lifecycle fuel savings become apparent when the prices of methanol or LNG are more favorable compared to marine gas oil.
Port-Entry Zero-Emission Zones
EU regulations require core ports to offer shore power, while California imposes fines on ships running auxiliary diesels at the pier. In response, cruise lines are adopting battery packs capable of powering hotel loads for extended periods, thereby reducing emissions at the port. ABB’s Onboard DC grid demonstrates how batteries and generators work together to enable silent maneuvering and recharging during journeys. Singapore’s Green Port Programme incentivizes ships with tariff rebates for achieving zero auxiliary emissions, encouraging hybrid retrofits in ferry fleets across the Asia-Pacific. These regulatory measures are driving hybrid-electric auxiliaries into prominence within the marine propulsion engine market.
Restraints Impact Analysis*
| Restraint | (~) % Impact on CAGR Forecast | Geographic Relevance | Impact Timeline |
|---|---|---|---|
| Fuel-Price Volatility Complicates Engine Choice | -0.3% | Global, most acute where fuel contracts lack hedging | Short term (≤ 2 years) |
| High CAPEX for SCR, EGR & After-Treatment | -0.2% | Global, especially fleets built before 2010 | Medium term (2–4 years) |
| Limited Green-Methanol & Ammonia Bunkering | -0.2% | Infrastructure concentrated in Northern Europe | Medium term (2–4 years) |
| Rare-Earth Magnet Supply Risk for Motors | -0.1% | Global, high reliance on China | Long term (≥ 4 years) |
| Source: Mordor Intelligence | |||
Fuel-Price Volatility Complicates Engine Choice
Marine gas oil prices experienced significant fluctuations, creating challenges for dual-fuel payback models. LNG bunker costs in key markets negated the anticipated savings that had driven many LNG orders. Methanol prices increased substantially in certain regions, driven by tight supply and rising demand from the chemical and shipping industries [3]“Methanol Supply Still Tight,” ICIS, icis.com. A portion of dual-fuel vessels shifted to operating exclusively on fuel oil due to unfavorable LNG pricing. Limited availability of hedging tools for methanol or ammonia left operators exposed to price volatility during the period between contract signing and delivery.
High Capex for SCR/EGR After-Treatment
Installing an SCR on a diesel engine can be a significant expense, often surpassing the residual value of older ships. Adding an EGR increases the cost of a new engine and requires additional cooling capacity. Catalyst cartridges, which need periodic replacement, further inflate operational expenditure forecasts. These rising costs make it difficult for smaller carriers to fund retrofits, leading some to exit the market or merge, thereby reshaping regional fleets. The International Chamber of Shipping estimates the global retrofit expenses to be substantial, excluding losses incurred during dry-dock idle periods.
*Our forecasts treat driver/restraint impacts as directional, not additive. The impact forecasts reflect baseline growth, mix effects, and variable interactions.
Segment Analysis
By Engine Type: Diesel Reliance Meets Fuel-Cell Momentum
Diesel engines accounted for 66.12% of the marine propulsion engine market share in 2025, primarily due to their familiarity with service and a widespread network of parts. Leadership is eroding at the margins as dual-fuel engines take orders that were once committed to straight diesel engines. Gas turbines once reserved for naval craft are re-entering commercial designs in hybrid pairings, where a turbine supplements cruise diesels for occasional high-speed needs. Hybrid-electric architectures integrating batteries with medium-speed gensets gained ground in European ferries that must cut port-side emissions.
Fuel-cell packages, though embryonic, posted the fastest climb at a 2.76% CAGR through 2031 on the back of European ferry pilots and Ballard’s 50,000 operating hours milestone. Regulatory clarity is improving, as DNV and Lloyd’s Register have published guidelines for fuel cells and ammonia. Container fleets with predictable routes tend to convert to dual-fuel more quickly than bulk carriers that operate on tramp schedules. Nuclear propulsion remains strictly naval, sustaining niche demand that is insulated from commercial cycles. Overall, fuel-agnostic modular engines are the future revenue sweet spot for the marine propulsion engine market.


By Application: Commercial Cargo Dominance and Passenger Upside
Commercial cargo accounted for 57.37% of the marine propulsion engine market share in 2025, reflecting the volume of commodities and competitive fuel-cost pressures. Cargo operators prioritize thermal efficiency and bunker optionality, resulting in a higher uptake of dual-fuel two-stroke engines on container and LNG carriers. Passenger vessels, which are growing at a rate of 2.41%, are also chasing low-emission credentials to attract environmentally conscious travelers. Cruise lines integrate batteries and shore-power interfaces that slash in-port emissions, and vibration-damped crankshafts protect guest comfort at sea. Defense and coast-guard procurement follows distinct criteria, such as redundancy and sprint speed, locking in multi-year engine contracts once a design is selected.
Power-takeoff arrangements that drive reefer compressors on cargo ships reduce auxiliary generator fuel consumption by 15%, providing a quick savings win. Short-sea ferries in Norway operate on fully battery-electric propulsion, demonstrating viability for crossings under one hour. Cargo operators adopt digital-twin scheduling to further reduce fuel costs, whereas passenger lines market hybrid capability as a brand differentiator. Naval platforms embed CODAD and CODAG combinations to deliver both efficiency and combat survivability, bolstering demand stability within the marine propulsion engine industry.
By Ship Type: Bulk Carrier Scale vs Offshore Support Agility
Bulk carriers supplied 31.28% of the marine propulsion engine market demand in 2025. Long replacement cycles and marginal freight rates slow technology refresh, so many bulk carriers will run Tier II diesels until forced to retrofit. Container ships adopt dual-fuel two-strokes at a faster clip to satisfy cargo owners’ emission mandates on scheduled liner routes. Tankers, with lower design speeds, continue to favor robust low-speed diesels that function efficiently at 80 RPM.
Offshore support vessels posted the top CAGR of 3.12% through 2031, as deepwater drilling campaigns require dynamic positioning drives with variable-speed diesel-electric systems. Naval vessels maintain CODAG and CODLAG mixes to balance patrol endurance with high-speed sprints. Passenger and cruise segments, although small in terms of units, deliver outsized visibility because shore-side regulators spotlight them for urban air-quality compliance. Bulk carriers will lag in hybrid adoption until global iron-ore and coal routes deploy methanol or ammonia bunkers; however, offshore units will continue to adopt next-generation engines as oil majors finance low-carbon retrofits into their supply contracts.
By Fuel Type: HFO Incumbency Meets Methanol Momentum
Heavy fuel oil remained dominant, with 73.25% of the marine propulsion engine market share in 2025, due to its cost advantages and the massive installed fleet. Scrubbers or 0.5% sulfur blends enable many operators to stay within the IMO 2020 sulfur caps without switching to a different fuel type. LNG supplied 8% of the fleet's energy, concentrated in large container and dedicated LNG carriers, where cryogenic bunkers are readily available. Methanol rose the fastest at a 2.88% CAGR through 2031, propelled by Maersk’s 25-ship orderbook and new bunkering hubs in Rotterdam and Copenhagen.
Ammonia and hydrogen remain at pilot scale yet anchor the industry’s 2050 decarbonization roadmap, aided by MAN’s ammonia-ready Type Approval. Conversion costs are substantial: LNG retrofits can exceed USD 10 million per mid-size container vessel, while methanol’s corrosive properties necessitate the use of stainless piping. Fuel-density penalties reduce cargo capacity, pushing operators to secure long-term low-carbon fuel supply contracts before committing. Agencies like the International Energy Agency forecast ammonia could cover 30% of shipping energy by 2050, contingent on scaling green-ammonia production from today’s sub-million-tonne base.
By Power Range: Mid-Range Stability, Ultra-High Growth
The 10,001–20,000 kW bracket accounted for 37.11% of the marine propulsion engine market size in 2025, primarily serving core to mid-sized container ships and tankers that rely on four-stroke diesel engines. Engines above 20,000 kW are expected to expand at a 3.24% CAGR through 2031, driven by the need for ultra-large container ships to operate at 22 knots, requiring 60,000-80,000 kW of power. Hybrid-electric configurations are gaining traction in the 1,000–5,000 kW class for offshore supply and patrol vessels, as batteries can effectively handle low-speed loads during port operations.
Small craft under 1,000 kW remain fragmented, with service networks provided by Yanmar, Cummins, and Caterpillar dealers. Ultra-high-power two-stroke diesels operate at cylinder pressures exceeding 200 bar, necessitating the use of exotic coatings that increase overhaul costs but deliver unmatched fuel economy. Dual-fuel penetration is most pronounced in the top power tier, where compliance benefits justify the 20% capital premium. Battery packs complement diesel generators in the 1,000–5,000 kW range, and ABB’s recent contracts demonstrate how integrated grids are expanding hybrid adoption beyond ferries.
Geography Analysis
The Asia-Pacific region led the marine propulsion engine market with a 43.36% share in 2025. Chinese yards supplied nearly half of global deadweight deliveries, and South Korean builders dominated the high-value container and LNG niches. Japan’s pivot toward ammonia-ready propulsion underscores the region’s push for zero-carbon leadership, while India’s defense shipbuilding programs bolster CODAG demand for combined diesel and gas-turbine engines. Southeast Asian yards fill offshore support vessel backlogs as exploration intensifies in the South China Sea. Vertical integration enables Hyundai Heavy Industries Engine & Machinery to supply its own shipbuilding lines, thereby compressing delivery times and securing margins.
The Middle East, forecasted to grow at a 3.37% CAGR through 2031, benefits from Saudi and Emirati sovereign capital targeting LNG carriers that will transport volumes from new liquefaction trains. Saudi Aramco’s long-term charters could require 20–30 hulls with dual-fuel two-stroke engines above 25,000 kW. Abu Dhabi invests in hybrid-electric harbor craft to cut port emissions. Turkish yards capture offshore support orders by offering cost quotes 20% lower than those of European competitors, although they still source Tier III engines from Western OEMs. Regional demand remains closely tied to Brent crude trajectories, as a slide toward USD 60 may defer deepwater commitments.
Europe held a significant share in 2025, driven by Norway’s demand for offshore wind support vessels and Germany’s naval frigate programs, which specify Tier III diesels. FuelEU Maritime tightens greenhouse-gas limits annually, pushing European owners toward dual-fuel or hybrid power, or face fines of up to one million euros per hull by 2031.
North America’s engine demand stems from the United States Navy’s new frigates and Alaskan fishing fleets, where Cummins and Caterpillar engines dominate remote-port service networks. South America and Africa remain smaller but strategic markets. Brazil’s FPSO expansions require medium-speed gensets, and Nigerian coastal shipping operates aging engines that are ripe for Tier III retrofits when financing becomes available.

Competitive Landscape
Competition remains moderate, with the top suppliers controlling a significant portion of the revenue share. Wärtsilä’s modular engine block allows operators to easily attach methanol injectors without the need to swap crankcases. This flexibility has boosted dual-fuel contracts, now making up a notable part of its backlog. MAN Energy Solutions has obtained IMO Type Approval for its ammonia-ready two-stroke engines. This positions the company as an early mover, allowing clients to place orders now and convert later as bunkering becomes more prevalent. In a strategic move, Rolls-Royce has taken a minority stake in a Norwegian battery integrator, indicating a push to combine propulsion systems with energy storage solutions.
Patent filings underscore the industry's next wave of innovations: Ballard has secured multiple marine fuel-cell patents, emphasizing membrane durability in saline conditions. Meanwhile, ABB's patents focus on algorithms optimizing battery charge cycles during port dockings. Chinese firms, such as Weichai and CSSC Diesel, enjoy a cost advantage but lag in emissions-control technology by a few years. High switching costs arise from service contracts and digital-twin data lock-ins. For instance, Wärtsilä oversees engines on numerous vessels across Asia, while Rolls-Royce’s Intelligent Awareness technology monitors hundreds of hulls worldwide. Emerging opportunities lie in hybrid-electric systems for coastal fishing fleets and the budding ammonia engine supply market.
Marine Propulsion Engine Industry Leaders
MAN Energy Solutions SE (Everllence)
Rolls-Royce plc
HD Hyundai Heavy Industries Co., Ltd.
Wärtsilä Corporation
Yanmar Holdings Co., Ltd.
- *Disclaimer: Major Players sorted in no particular order

Recent Industry Developments
- October 2025: In Friedrichshafen, Rolls-Royce has achieved a significant milestone by testing the world's first high-speed marine engine, which is solely powered by methanol. This achievement, in collaboration with partners from the meOHmare research project, underscores Rolls-Royce's commitment to pioneering climate-neutral and eco-friendly propulsion solutions for the shipping industry.
- August 2025: In a move underscoring South Korea's dedication to bolstering the U.S. shipbuilding sector, Hanwha Group unveiled a USD 5 billion infrastructure initiative for Hanwha Philly Shipyard. This announcement coincided with the christening of a new training vessel, the U.S. Maritime Administration’s (MARAD) third National Security Multi-mission Vessel (NSMV), and is part of a broader USD 150 billion investment fund aimed at the U.S. shipbuilding industry.
- June 2025: Everllence, formerly known as MAN Energy Solutions, has significantly expanded its portfolio to include heat pumps, carbon capture, and electrolyzers. This strategic move underscores the company's commitment to meeting the increasing demand for sustainable and energy-efficient technologies, thereby solidifying its market position.


Research Methodology Framework and Report Scope
Market Definitions and Key Coverage
Our study defines the marine propulsion engine market as factory-built main engines that provide thrust to ocean-going, coastal, and inland vessels, covering diesel, dual-fuel, gas turbine, hybrid-electric, fuel-cell, and nuclear units rated above 500 kW. These values represent engines sold for newbuilds as well as complete replacements delivered through authorized channels, valued at OEM net prices.
Scope exclusion: auxiliary gensets, propellers, shaftlines, gearbox-only retrofits, and shore-power equipment are not counted.
Segmentation Overview
- By Engine Type
- Diesel
- Dual-Fuel (LNG, Methanol, Ammonia ready)
- Gas Turbine
- Hybrid-Electric
- Fuel-Cell
- Nuclear (Naval)
- By Application
- Passenger
- Commercial Cargo
- Defense / Coast Guard
- By Ship Type
- Container Ship
- Tanker
- Bulk Carrier
- Offshore Support Vessel
- Naval Ship
- Passenger / Cruise
- By Fuel Type
- Heavy Fuel Oil (HFO)
- Marine Diesel/Gas Oil
- Liquefied Natural Gas (LNG)
- Methanol
- Ammonia/Hydrogen
- By Power Range (kW)
- Up to 1,000 kW
- 1,001 kW to 5,000 kW
- 5,001 kW to 10,000 kW
- 10,001 kW to 20,000 kW
- Above 20,000 kW
- By Geography
- North America
- United States
- Canada
- Rest of North America
- South America
- Brazil
- Argentina
- Rest of South America
- Europe
- Germany
- United Kingdom
- France
- Spain
- Russia
- Rest of Europe
- Asia Pacific
- China
- Japan
- South Korea
- India
- Rest of Asia Pacific
- Middle East and Africa
- Saudi Arabia
- United Arab Emirates
- Turkey
- South Africa
- Nigeria
- Rest of Middle East and Africa
- North America
Detailed Research Methodology and Data Validation
Primary Research
Mordor analysts interviewed procurement leads at major shipyards in China, South Korea, and Europe, fleet managers at liner and tanker operators across APAC and the Gulf, and inspectors from two classification societies. These conversations validated average installed power by ship class, typical discount structures, and emerging fuel-retrofit timelines, filling gaps that desktop work alone cannot bridge.
Desk Research
We compiled baseline demand indicators from open sources such as IMO's GISIS orderbook files, UNCTAD Review of Maritime Transport, Eurostat and U.S. Census vessel import tables, Clarkson SIN shipbuilding statistics, and bunker-fuel price trackers run by the World Bank. Trade association briefs from BIMCO and IACS, 10-K filings of listed engine makers, and port authority throughput data sharpened regional mix assumptions. Paid repositories including D&B Hoovers for company splits, Questel for fuel-ready patent counts, and Volza customs logs supplied financial, technology, and shipment clues. The sources cited are illustrative; many additional databases and periodicals informed cross-checks and clarifications.
Market-Sizing & Forecasting
A top-down construct starts with annual vessel deliveries and scrappage, multiplies them by class-specific installed-power norms, and adjusts for retrofit cycles. Aggregate kilowatts are then priced using weighted average selling prices segmented by fuel architecture. Supplier revenue roll-ups and channel checks provide a bottom-up sense-check before totals are finalized. Key variables we model include global dead-weight tonnage additions, mean engine power per hull, EEDI phase-out thresholds, bunker-fuel spreads, and methanol-ready uptake ratios. Five-year projections combine multivariate regression and scenario analysis, where trade volume growth, shipyard capacity, and regulatory stringency interact to shape demand ranges.
Data Validation & Update Cycle
Outputs pass two analyst reviews in which anomalies versus external shipping indices are flagged, discussed, and either rectified or foot-noted. We refresh every twelve months, and an interim sweep is triggered when new IMO mandates, major shipbuilding cancellations, or disruptive fuel-price shocks arise.
Credibility Anchor: Why Mordor's Marine Propulsion Engine Baseline Commands Reliability
Published figures often differ because providers pick distinct scopes, discount regimes, and refresh cadences. By centering on installed-power realities and vetted ASPs, our baseline minimizes such distortions.
Key gap drivers include some publishers omitting high-power naval units, others folding auxiliary gensets into totals, or applying undiluted list prices that inflate values.
Our annual refresh and double-path validation curb those skews.
Benchmark comparison
| Market Size | Anonymized source | Primary gap driver |
|---|---|---|
| USD 38.7 Bn (2025) | Mordor Intelligence | - |
| USD 20.5 Bn (2024) | Regional Consultancy A | Counts only diesel newbuilds, excludes engines above 20 MW |
| USD 36.0 Bn (2025) | Global Consultancy B | Bundles auxiliary gensets and partial retrofit kits |
| USD 39.6 Bn (2024) | Industry Association C | Uses list prices with no regional discount calibration |
The comparison shows that when scope breadth, pricing realism, and timely refresh are harmonized, Mordor's disciplined approach delivers a balanced, transparent baseline that decision-makers can trace back to clear variables and repeatable steps.


Key Questions Answered in the Report
What is the current value of the marine propulsion engine market?
The marine propulsion engine market size reached USD 39.69 billion in 2026.
Which fuel type is growing fastest in new marine engines?
Green methanol is on the steepest rise, with a projected 2.88% CAGR through 2031 and mounting dual-fuel orders.
Which engine type currently holds the largest market share?
Diesel engines lead with 66.12% of the marine propulsion engine market share as of 2025.
Why are dual-fuel engines gaining market share?
They let operators switch between LNG, methanol, and conventional fuel to hedge fuel-price swings and meet tightening emissions rules.
Who are the top suppliers in the sector?
MAN Energy Solutions, Wärtsilä, Rolls-Royce Power Systems, Hyundai Heavy Industries Engine & Machinery, and Caterpillar hold the largest combined share.
How will IMO Tier III regulations impact older vessels?
Pre-2016 ships must retrofit SCR or EGR systems or face speed and charter penalties, fueling a rapid retrofit market.
Page last updated on:


