
Market Overview
| Study Period | 2021 - 2031 |
|---|---|
| Forecast Data Period | 2026 - 2031 |
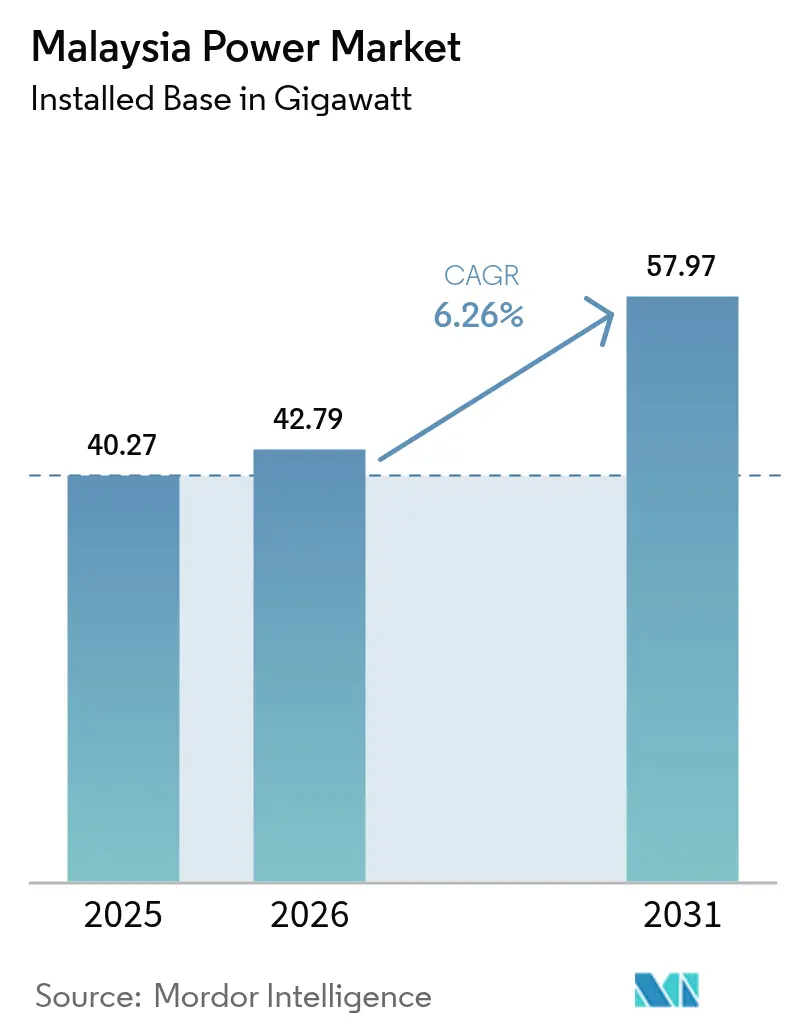
| Base Year Market Size (2025) | 40.27 gigawatt |
| Market Volume (2026) | 42.79 gigawatt |
| Market Volume (2031) | 57.97 gigawatt |
| Growth Rate (2026 - 2031) | 6.26 % |
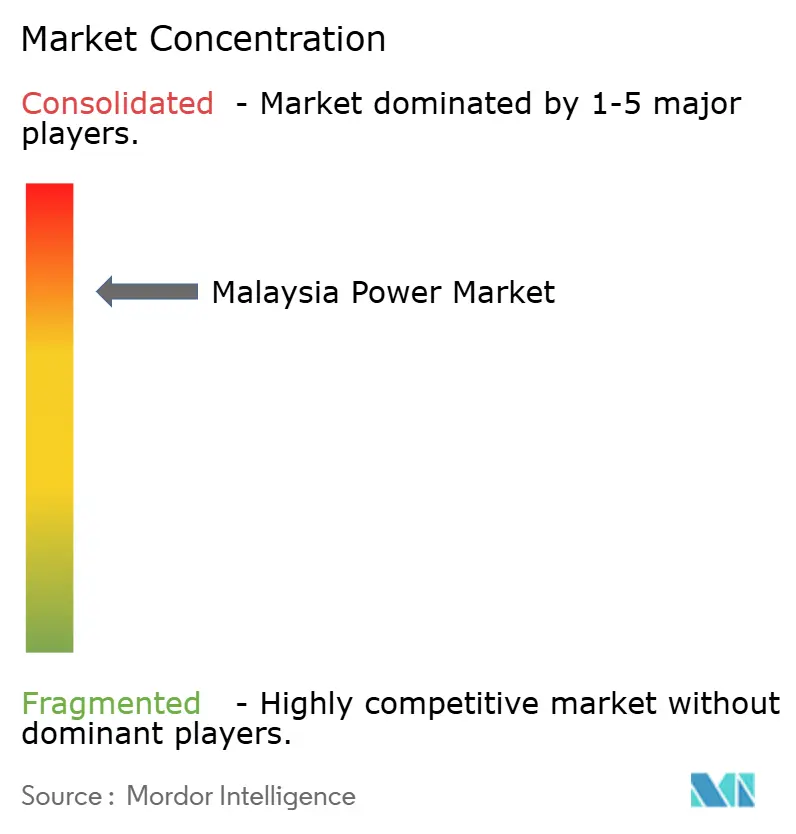
| Market Concentration | High |
Major Players *Disclaimer: Major Players sorted in no particular order Image © Mordor Intelligence. Reuse requires attribution under CC BY 4.0. | |
Malaysia Power Market Analysis by Mordor Intelligence
Malaysia Power Market size in 2026 is estimated at 42.79 gigawatt, growing from 2025 value of 40.27 gigawatt with 2031 projections showing 57.97 gigawatt, growing at 6.26% CAGR over 2026-2031.
Hyperscale data-center clusters account for 11 GW of new load applications, a figure that has doubled in only two years and is forcing Tenaga Nasional Berhad (TNB) to accelerate generation and grid investments.(1) While thermal technologies maintained 75.6% of the Malaysian power market in 2024, renewables are the fastest-growing through 2030 and will re-allocate capital toward solar, hydro, and battery projects at the expense of coal. Third-party access rules are shifting procurement power to corporate consumers, and tariff-subsidy reforms are aligning prices with cost recovery, which, in turn, improves the economics of distributed solar. Semiconductor fabrication and cloud infrastructure hubs in Penang, Selangor, and Johor underpin sustained industrial demand, yet natural-gas supply constraints and curtailment risk in weak East Malaysia grids serve as headline uncertainties.
Key Report Takeaways
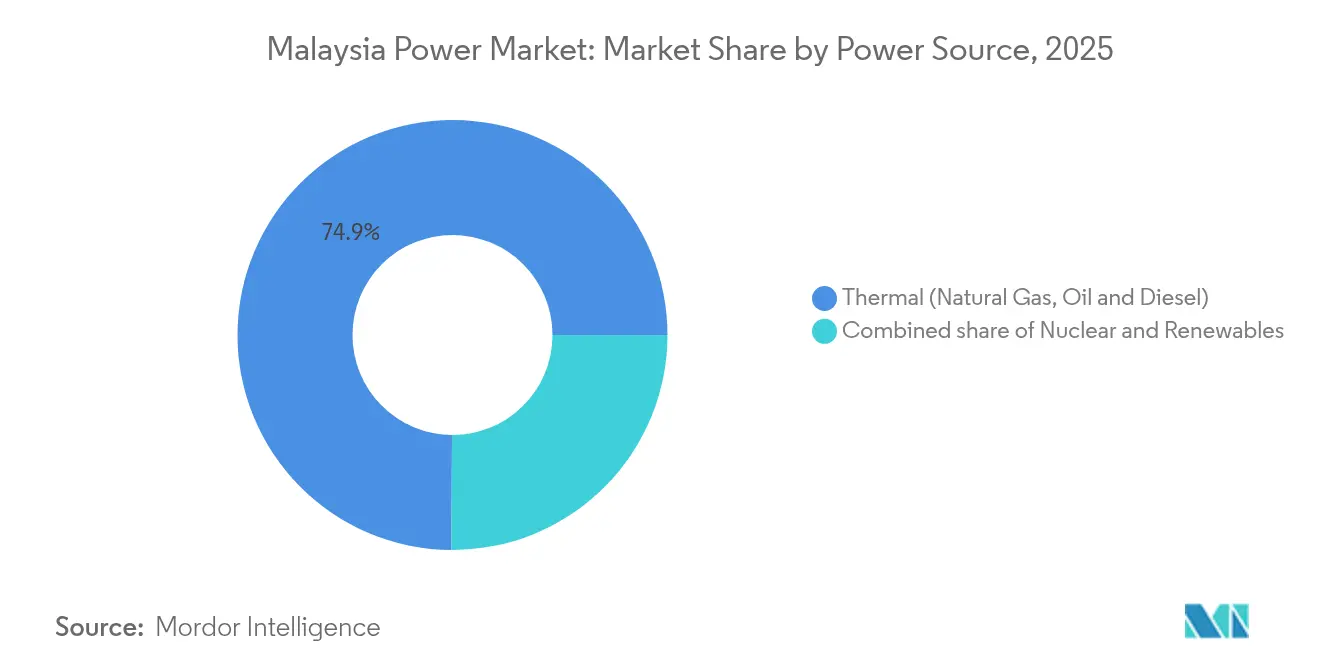
- By power source, thermal generation held a 74.92% Malaysia power market share in 2025, while renewables are rising at a 22.89% CAGR through 2031.
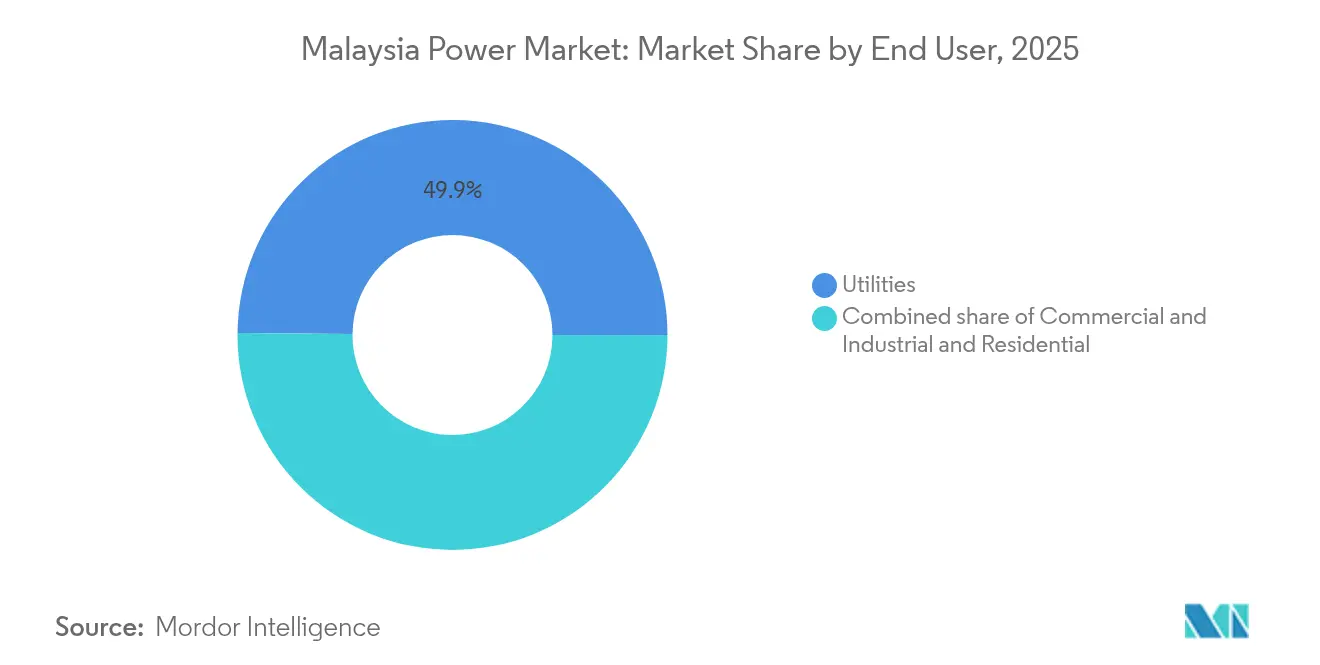
- By end user, utilities controlled 49.85% of installed capacity in 2025; the residential segment is projected to increase at a 16.85% CAGR through 2031.
Note: Market size and forecast figures in this report are generated using Mordor Intelligence’s proprietary estimation framework, updated with the latest available data and insights as of 2026.
Market Trends and Insights
Drivers Impact Analysis of Malaysia Power Market*
| Driver | (~) % Impact on CAGR Forecast | Geographic Relevance | Impact Timeline |
|---|---|---|---|
| Industrial electricity-demand surge | +1.80% | Peninsular Malaysia (Selangor, Penang, Johor industrial corridors); spillover to Iskandar Malaysia SEZ | Medium term (2-4 years) |
| Renewable-energy capacity targets (31% by 2025; 40% by 2035) | +2.10% | National, with concentration in Peninsular Malaysia LSS zones and Sarawak hydro expansion | Long term (≥ 4 years) |
| Aging coal-fleet retirements triggering replacement build-outs | +0.90% | Peninsular Malaysia (Kapar, Tanjung Bin, Jimah clusters); limited East Malaysia exposure | Medium term (2-4 years) |
| Grid-modernisation & T&D capex push | +0.70% | National, priority in Peninsular Malaysia urban load centers and East Malaysia inter-state links | Long term (≥ 4 years) |
| Corporate PPAs enabled by Third-Party Access rules | +1.20% | Peninsular Malaysia (data-center hubs in Johor, Selangor); early adoption in Penang free-trade zones | Short term (≤ 2 years) |
| Hyperscale data-centre clusters driving load pockets | +1.50% | Johor (Iskandar Malaysia), Selangor (Cyberjaya, Shah Alam), Penang (Bayan Lepas) | Short term (≤ 2 years) |
| Source: Mordor Intelligence | |||
Industrial Electricity-Demand Surge
Infineon’s EUR 2 billion silicon-carbide fab in Kulim exemplifies the structural shift from legacy petrochemicals toward precision manufacturing that now underpins the Malaysian power market.(2) TNB has confirmed that data-center applications alone total 11 GW, compelling the utility to reserve 30% of its RM 16.3 billion contingent capital expenditure for unanticipated load growth. Industrial demand is expected to maintain half of total consumption through 2030, but the composition tilts toward semiconductor and cloud workloads that require low-carbon electricity. Any lapse in generation or transmission build-out risks divesting these investments to regional competitors with more advanced renewable procurement frameworks. Consequently, local authorities are fast-tracking substation upgrades and incentivizing battery storage to keep reserve margins adequate.
Renewable-Energy Capacity Targets
The National Energy Transition Roadmap sets milestones of 31% renewable capacity by 2025 and 40% by 2035. Achieving these goals requires annual additions near 1.5 GW, notably faster than historical build-out rates.(3) Large-Scale Solar Round 5 allocated 2 GW in 2024 to Malaysian-controlled bidders, favoring domestic content capture but narrowing the developer field. TNB’s 2.5 GW floating-solar program across hydro reservoirs leverages existing transmission corridors and minimizes land-use conflicts, while Sarawak Energy’s 7,300 MW hydro fleet positions East Malaysia as a potential clean-power exporter once cross-border interconnections advance. The 70% renewable aspiration by 2050 implies near-zero coal, with hydrogen-ready combined-cycle gas turbines providing a bridge technology, albeit with fuel-supply uncertainties.
Aging Coal-Fleet Retirements Triggering Replacement Build-Outs
Malaysia plans to retire 9.1 GW of coal capacity between 2024 and 2030, eliminating all coal plants by 2044. Replacement projects favor natural-gas hybrids and floating solar rather than like-for-like builds, yet delays at Pulau Indah and Gurun underline schedule risk. Four combined-cycle units totaling 2.2 GW had already closed by 2023, and the 500 MW Miri gas plant is vital to offset closures once it enters service in 2027. The coal phase-out aligns with decarbonization targets yet heightens reliance on gas and hydrogen supply chains, placing risk on fuel price volatility and LNG import costs. Independent producers that commission gas or renewable capacity ahead of schedule can lock in favorable tariffs, whereas coal-centric operators face growing stranded-asset exposure.
Hyperscale Data-Center Clusters Driving Load Pockets
Bridge Data Centres contracted 150 MWp of renewable power through the Corporate Renewable Energy Supply Scheme, illustrating how hyperscalers bypass traditional utility agreements for direct green procurement. Johor’s Iskandar Malaysia and Selangor’s Cyberjaya have emerged as preferred locations due to proximity to Singapore and competitive land prices. The 24/7 uptime standard demands reliable generation, prompting TNB to bundle battery storage into new substations and upgrade transmission earlier than envisaged. Concentrated data-center demand may reach 20% of national installed capacity by 2035, generating both opportunity and stress for grid operators. Third-party access rules thereby fragment utility revenue streams but improve Malaysia’s standing against regional digital hubs.
Restraints Impact Analysis of Malaysia Power Market*
| Restraint | (~) % Impact on CAGR Forecast | Geographic Relevance | Impact Timeline |
|---|---|---|---|
| Natural-gas supply constraints & price volatility | -1.10% | Peninsular Malaysia (gas-dependent generation clusters); indirect impact on East Malaysia via LNG imports | Medium term (2-4 years) |
| Electricity-tariff subsidy reforms | -0.60% | National, acute for commercial & industrial consumers in Peninsular Malaysia | Short term (≤ 2 years) |
| Land & permitting hurdles for utility-scale RE | -0.80% | Peninsular Malaysia (competing land use in Kedah, Perak agricultural zones); East Malaysia (indigenous land rights) | Long term (≥ 4 years) |
| Curtailment risk in East-Malaysia weak grids | -0.50% | Sarawak and Sabah (isolated grids with limited inter-state transmission) | Medium term (2-4 years) |
| Source: Mordor Intelligence | |||
Natural-Gas Supply Constraints and Price Volatility
Domestic gas production has plateaued, and Petronas prioritizes LNG exports, resulting in periodic fuel shortages that force generators to switch to costlier diesel back-up.(4)When global LNG prices spiked in 2022, Malaysia's tariff-pass-through mechanism lagged fuel costs, compressing IPP margins. Planned hydrogen-ready turbines assume green hydrogen will gradually displace gas, yet industrial-scale hydrogen infrastructure remains nascent. Unless coordinated storage, import, and pricing reforms materialize, gas exposure will weigh on Malaysia's power market expansion speed by suppressing investor appetite for flexible thermal assets.
Electricity-Tariff Subsidy Reforms
The government has started phasing out cross-subsidies, aligning tariffs with generation costs under the Incentive-Based Regulation framework. Industrial consumers now bear a larger share of fuel-price risk, which tightens manufacturing margins but bolsters the business case for onsite solar and storage. Although residential tariffs remain partially shielded, subsidy rationalization frees fiscal space for grid upgrades and renewable incentives. In the short term, however, higher bills may delay adoption of electric heating and mobility applications, tempering demand growth.
*Our forecasts treat driver/restraint impacts as directional, not additive. The impact forecasts reflect baseline growth, mix effects, and variable interactions.
Malaysia Power Market Segment Analysis
By Power Source:
Renewables Reconfigure Thermal DominanceThe Malaysian power market size for renewables is projected to rise at a 22.89% CAGR, eating into thermal technology’s 74.92% Malaysia power market share in Malaysia in 2025. Solar leads the renewable surge, propelled by TNB’s 2.5 GW floating-solar roll-out and 2 GW of allocated capacity under Large-Scale Solar Round 5. Hydro remains pivotal in East Malaysia, yet expansion is bound by environmental assessment and community engagement. Coal will decline sharply, with 9.1 GW scheduled to retire by 2030, while hydrogen-ready gas turbines pick up reserve margins and prepare the grid for future fuel transitions. Battery storage adoption becomes a gating factor: adequate storage unlocks higher solar penetration, while shortfalls would keep mid-merit gas plants online longer.
Solar’s levelized cost fell below marginal gas generation in 2024, even before storage, encouraging IPPs to stack corporate PPAs on top of utility tenders. Hydro assets in Sarawak supply near-baseload output at low variable cost, positioning the state as a potential exporter pending interconnection. Wind and geothermal remain exploratory, and biomass expansion slows due to rising feedstock prices. The evolving mix will influence dispatch order, emissions intensity, and investment allocation across the Malaysia power market.

By End User:
Residential Uptake Narrows Utility LeadUtilities held 49.85% of capacity in 2025, yet residential installations under Net Energy Metering Rakyat grew at 16.85% CAGR and exhausted the 350 MW quota months ahead of schedule. The Solar for Rakyat Incentive Scheme accelerates this trajectory by reimbursing up to MYR 4,000 per installation, pushing daily applications from 100 to 150. Commercial and industrial buyers increasingly procure energy directly from IPPs, leveraging Third-Party Access to secure cost and sustainability advantages. As more factories and data centers receive green power via private wires or wheeling arrangements, utility energy sales retreat, but network-service revenue rises.
Further residential gains hinge on low-interest financing and battery price declines, while industrial offtake depends on transparent wheeling fees and grid-connection timelines. Utilities respond by investing in advanced metering and distributed-energy management systems, which open data-driven service opportunities such as demand response. Altogether, shifting end-user behavior reallocates capital toward smaller, decentralized assets and hastens the transformation of the Malaysia power market size distribution across customer segments.
Geography Analysis
Peninsular Malaysia houses the most installed capacity, backed by an interconnected transmission grid that supports multi-state dispatch. TNB allocates over RM 42.9 billion to modernize lines in Selangor, Johor, and Penang, where semiconductor and cloud clusters generate concentrated load. The peninsula’s aggressive coal retirement schedule requires swift replacement by hydrogen-ready gas turbines and utility-scale solar, while floating solar leverages existing reservoirs to reduce land conflict. Industrial corridors in Iskandar Malaysia and Klang Valley draw foreign direct investment predicated on reliable, low-carbon electricity, prompting battery storage and advanced metering deployments ahead of previous plans.
East Malaysia operates two isolated grids. Sarawak’s hydro-dominant portfolio supplies low-carbon energy but faces export bottlenecks, though proposed interconnections with Brunei and Kalimantan could unlock new revenue once regulatory frameworks align. Sabah’s grid remains weaker, leading to curtailment risk that the 400 MWh battery project only partly addresses. New gas capacity at Kimanis improves resilience, yet solar and wind developers still struggle to obtain bankable PPAs due to uncertain offtake. Microgrids and distributed storage are emerging as cost-effective alternatives for remote communities.
Regional disparity shapes investment priorities. Peninsular Malaysia attracts most corporate procurement and utility-scale projects. East Malaysia’s hydro surplus creates potential export advantages but requires capital-intensive transmission. Policymakers weigh nationwide uniform tariff goals against the practicalities of differentiated regional strategies to maximize the Malaysia power market’s economic potential.
Regulatory Landscape
Suruhanjaya Tenaga (ST) regulates electricity and piped gas supply in Peninsular Malaysia and the Federal Territory of Labuan under the Energy Commission Act 2001 (Act 610), covering economic regulation, technical reliability, and safety. The current tariff-setting and performance framework is anchored in Incentive-Based Regulation (IBR), with Regulatory Period 4 commencing in July 2025 and running through December 2027, strengthening the link between allowed revenues, service performance, and approved pass-through items.
Recent rule changes reinforce compliance and cost-recovery mechanisms for licensees. The Licensee Supply (Amendment) Regulations 2025 entered into force in October 2025, updating the Electricity Supply Regulations 1990 requirements applicable to supply licensees, while the Automatic Fuel Adjustment (AFA) mechanism was implemented in July 2025 to replace ICPT for fuel cost adjustments. Operationally, ST enforces mandatory Grid Code compliance for all grid system users under section 50A of the Electricity Supply Act 1990. ST also updated its internal capacity with a new organizational structure implemented in January 2026 to streamline resources and strengthen regulatory oversight as the sector transitions.
Competitive Landscape
The Malaysia power market features high concentration. TNB controls transmission and distribution in Peninsular Malaysia, yet IPPs such as Malakoff, YTL Power, and Edra Power compete vigorously for generation contracts. These incumbents pivot toward solar and storage as coal assets near retirement. New-entrant developers, including Solarvest and Cypark, win Large-Scale Solar Round 5 packages by meeting local-equity criteria and offering cost-competitive bids. Foreign suppliers, JinkoSolar, First Solar, Huawei, and Siemens, localize assembly to qualify for domestic content preferences embedded in tenders, mitigating supply-chain and tariff risks.
Strategic moves reflect a pivot toward flexibility. TNB’s 2.5 GW floating-solar and 400 MWh battery plans reposition the utility as a facilitator of renewable integration rather than solely a baseload provider. Solarvest secured multiple utility-scale contracts while partnering with battery integrators to bid hybrid plants that hedge intermittency. Petronas explores green-hydrogen pilots with TNB, leveraging its LNG portfolio to diversify future fuels. Competitive differentiation increasingly rests on technology adoption: firms that deploy predictive maintenance or curtailment-management software gain cost and availability advantages that translate into lower tariff bids.
White-space opportunity centers on storage integration, hydrogen-ready turbines, and floating-solar engineering. Early movers can lock in long-term service agreements that provide recurring revenue as the Malaysia power market migrates toward a flexibility-first dispatch paradigm. Market participants that cling to legacy thermal paradigms face escalating stranded-asset risk as policy momentum advances toward renewables and carbon reduction.
Malaysia Power Industry Leaders
-
Tenaga Nasional Berhad
-
Sarawak Energy Berhad
-
Sabah Electricity Sdn Bhd (SESB)
-
Edra Power Holdings
-
Malakoff Corporation Berhad
- *Disclaimer: Major Players sorted in no particular order
Malaysia Power Market Companies Covered in this Report
- Tenaga Nasional Berhad (TNB)
- Sarawak Energy Berhad
- Sabah Electricity Sdn Bhd (SESB)
- Edra Power Holdings
- Malakoff Corporation Berhad
- YTL Power International
- Genting Sanyen Power
- Petronas Power Sdn Bhd
- Cypark Resources Berhad
- Solarvest Holdings Berhad
- ERS Energy Sdn Bhd
- Verdant Solar
- LYS Energy Group
- Pathgreen Energy Sdn Bhd
- Sunway Construction Group Bhd (RE EPC)
- JinkoSolar (Malaysia Module Fab)
- First Solar Malaysia
- KEPCO Engineering & Construction
- Huawei Digital Power Malaysia
- Siemens Energy Malaysia
Market Opportunities and Future Outlook
Coal retirements and reliability requirements from hyperscale and industrial load centers are creating investable whitespace in repowering, flexibility, and grid-enabling infrastructure. In July 2026, PETRA referenced a proposed National Coal Site Repurposing Framework to convert retiring coal plant sites into renewable energy hubs and battery storage facilities, aligning with the need to replace dispatchable capacity while reducing permitting friction at established generation locations. This complements utility actions already visible in the market, including Tenaga Nasional Berhad (TNB) receiving a Letter of Notification in February 2026 to develop a 1,400 MW combined-cycle gas turbine plant in Paka, Terengganu under the NewGen25 competitive bid. TNB also secured PPA extensions for three gas-fired plants totaling about 1.3 GW through 2029, prioritizing firm capacity and extending asset lives during the transition.
Fuel security and regional balancing are emerging as a second opportunity cluster, particularly where gas supply constraints intersect with growing renewable penetration. In June 2026, Gas Malaysia Berhad signed a Joint Development Agreement with Tokyo Gas and VTTI to develop a floating LNG regasification terminal (FSRU) in Yan, Kedah with capacity up to 6 MTPA, which supports supply diversification for gas-to-power and peaking needs in the northern peninsula. On the clean power side, government reporting in June 2026 placed renewable installed capacity at around 33% toward the 35% 2030 target, reinforcing the demand for grid modernization, storage, and hybrid plant configurations that stabilize variability. These conditions also support third-party access and corporate procurement scaling without degrading system reliability.
Recent Industry Developments in Malaysia Power Market
- May 2026: Tenaga Nasional Berhad (TNB) received approval for a five-year interim extension of the Kenyir Hydro Power Station power purchase agreement, covering 14 September 2025 through 31 August 2030. The extension helps preserve firm, low-carbon generation in Peninsular Malaysia while the system absorbs new load applications and integrates more variable renewables.
- June 2025: Sarawak Energy, together with the Ministry of Utility and Telecommunication, China Three Gorges International, and Shanghai Electric Power, signed an MoU to study a floating solar facility of up to 1,000 MW on the Bakun Hydroelectric Plant reservoir. Pairing floating solar with an existing hydro asset provides a pathway to add renewable capacity while leveraging existing grid connections and reservoir infrastructure.
- February 2025: Malakoff Corporation Berhad completed the acquisition of 51% of ZEC Solar Sdn Bhd and 49% of TJZ Suria Sdn Bhd, raising its effective renewable energy capacity to 159 MW. The acquisition strengthened Malakoff's renewable platform as competitive dynamics and procurement mechanisms shift toward solar and hybrid solutions.
Malaysia Power Market Report Scope and Research Methodology
Market Definition and Coverage
For this methodology, the Malaysia power market is sized using installed electricity generation capacity within Malaysia, expressed in gigawatts, covering grid connected additions and retirements across the main power sources over the study period.
Scope exclusions: We exclude fuel costs, retail electricity bills, EPC project values, and day to day operations spending because those are value pools that do not track installed capacity.
Segments Covered in This Report
- By Power Source
- Thermal (Coal, Natural Gas, Oil and Diesel)
- Nuclear
- Renewables (Solar, Wind, Hydro, Geothermal, Biomass & Waste, Tidal)
- By End User
- Utilities
- Commercial and Industrial
- Residential
- By T&D Voltage Level (Qualitative Analysis only)
- High-Voltage Transmission (Above 230 kV)
- Sub-Transmission (69 to 161 kV)
- Medium-Voltage Distribution (13.2 to 34.5 kV)
- Low-Voltage Distribution (Up to 1 kV)
Data Sources, Market Sizing, and Validation
Desk Research
Desk research was used to build the fact base on installed capacity, the generation mix, and the pace of net additions. We referenced public and official sources such as Malaysia energy statistics from government bodies, utility and regulator publications, grid planning documents, IEA country electricity indicators, and IRENA renewable capacity series.
To keep assumptions realistic, we also reviewed annual reports and investor presentations for project timelines and commissioning guidance, then used reputable press to track status changes and policy updates. In a few cases, paid subscriptions were used only to cross-check company financials, major news flow, and patent activity related to power equipment and grid technology. The desk research sources listed here are illustrative only, and many other public sources were also used for data collection, validation, and clarification.
Primary Interviews and Surveys
Primary work was done through expert interviews and structured surveys with stakeholders from generation, grid operations, developers, and large electricity users, so pipeline realism and timing could be interpreted correctly. Since this is a country market, we focused on coverage across the main load centers and grid-connected regions in Malaysia, and then used follow-ups to test retirement assumptions and the practical pace of commissioning.
Distribution of primary research fieldwork respondents
| Company type | Respondent position |
|---|---|
| Top tier: 34% | CXOs: 18% |
| Mid tier: 48% | Functional/Unit leaders: 40% |
| Smaller Players: 18% | Managers: 42% |
Market-Sizing & Forecasting
The main sizing logic uses a top-down approach where national installed capacity totals and verified plant additions are reconstructed into an installed base by year, which is then split into power sources using published mix data and commissioning information. To avoid over-relying on a single series, results were corroborated with selective bottom-up approximations, such as summing visible project pipelines, sampling plant-level capacity adds by fuel, and checking implied annual net adds against grid and policy constraints.
Inputs used in the model include announced and under-construction commissioning dates, retirements and life-extension expectations for older units, renewable program volumes and award timing, interconnection readiness signals, and electricity demand growth indicators that affect how quickly new capacity is needed. Where project timing or status was unclear, conservative ranges were applied first, and then narrowed after validation from industry respondents. For forecasting, scenario analysis was used to reflect policy targets and pipeline deliverability, followed by stress checks against historical build rates and near-term execution limits.
Data Validation & Update Cycle
Outputs were validated through triangulation across independent signals, including national capacity totals, observed annual net additions, and the achievable pace of commissioning seen in recent years. Any sharp shifts by fuel type were flagged for variance checks, and assumptions were re-reviewed before sign-off through a multi-step internal review.
The report is refreshed annually, and interim updates are triggered when material events occur, such as major policy shifts, large project cancellations, or unexpected commissioning delays. Before delivery, an analyst performs a fresh pass so clients receive the latest view of the market size and near-term outlook.
Mordor Intelligence's Malaysia Power Market Size Versus Other Published Estimates
Published estimates for the Malaysia power market often do not line up because they measure different things, and they also choose different base years and reporting units. Some sources present a value market in USD linked to electricity supply and related activities, while others track physical system scale using installed capacity in GW.
A second driver is how project pipelines are treated, since planned capacity can be counted too early when timelines slip. Some estimates also bundle transmission and distribution value and end-user spending into the same total. Those add-ons sit outside the scope here, and the table reflects that Mordor Intelligence counts installed generation capacity in Malaysia (GW) using commissioning and retirement signals to keep the time series consistent.
Benchmark comparison
| Source | Market Size | Gaps in Research Methodology |
|---|---|---|
| Mordor Intelligence | USD 40.27 B (2025) | |
| Global Consultancy A | USD 25.50 B (2024) | Uses a USD value market tied to power-sector activity and end-user categories, so the total moves with included value-chain items and price effects rather than net MW additions. |
| Industry Portal B | USD 25.50 B (2024) | Presents a value-based total that includes transmission and distribution and uses a different base-year convention, which can shift the reported size even when physical capacity is unchanged. |
The spread is mainly explained by unit choice and scope, since installed capacity in GW and sector value in USD do not represent the same market. By sticking to verifiable capacity additions and retirements, the estimate stays traceable to public plant and planning signals and can be repeated in each refresh.
Key Questions Answered in the Report
What is the current installed capacity in the Malaysia power market?
Installed capacity reached 42.79 GW in 2026 and is forecast to grow to 57.97 GW by 2031.
How fast are renewables growing within Malaysia’s power mix?
Renewable capacity is expanding at a 22.89% CAGR through 2031, rapidly eroding coal’s share.
Which regions are attracting most new industrial electricity demand?
Penang, Selangor, and Johor host semiconductor and data-center hubs that drive incremental load.
How does Third-Party Access influence corporate electricity procurement?
It lets large users bypass utility contracts and secure long-term renewable PPAs with independent generators.
What role will hydrogen-ready gas turbines play in future generation?
They replace retiring coal plants while preparing for green-hydrogen blends once supply becomes viable.
How significant is battery storage to Malaysia’s grid reliability goals?
Utility projects totaling 400 MWh are underway, anchoring flexibility and enabling deeper solar penetration.