
Market Overview
| Study Period | 2021 - 2031 |
|---|---|
| Forecast Data Period | 2026 - 2031 |
| Base Year Market Size (2025) | 11.09 gigawatt |
| Market Volume (2026) | 13.68 gigawatt |
| Market Volume (2031) | 39.03 gigawatt |
| Growth Rate (2026 - 2031) | 23.33 % |
| Market Concentration | Medium |
Major Players *Disclaimer: Major Players sorted in no particular order Image © Mordor Intelligence. Reuse requires attribution under CC BY 4.0. | |
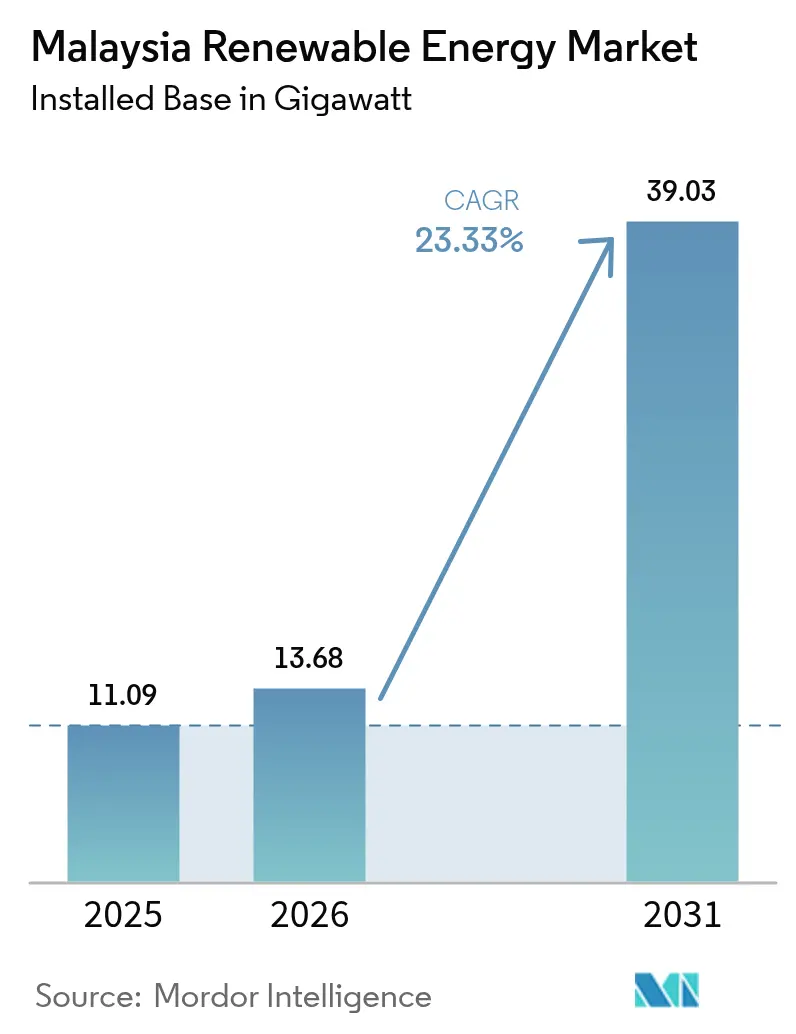
Malaysia Renewable Energy Market Analysis by Mordor Intelligence
Malaysia Renewable Energy Market size in 2026 is estimated at 13.68 gigawatt, growing from 2025 value of 11.09 gigawatt with 2031 projections showing 39.03 gigawatt, growing at 23.33% CAGR over 2026-2031.
The growth outlook is driven by the National Energy Transition Roadmap (NETR), rising corporate power-purchase agreements resulting from the data center boom, and declining solar PV levelized costs. Grid upgrades led by Tenaga Nasional Berhad (TNB) and state initiatives in Sarawak for green hydrogen exports are widening investment opportunities while reducing reliance on imported fossil fuels. Manufacturing localization by global solar majors, expansion of floating-solar pilots on hydro reservoirs, and enhanced Net Energy Metering (NEM 3.0) incentives reinforce project pipelines. In parallel, policy-backed cross-border power trading through the Energy Exchange Malaysia (Enegem) positions the country as a regional clean energy hub within the ASEAN Power Grid.
Key Report Takeaways
- By technology, hydropower led with 65.12% of Malaysia's renewable energy market share in 2025, whereas geothermal is projected to accelerate at a 112.76% CAGR through 2031.
- By end-user, utilities accounted for 67.55% of the Malaysian renewable energy market size in 2025, while the residential segment is projected to grow at a 26.62% CAGR between 2026 and 2031.
Note: Market size and forecast figures in this report are generated using Mordor Intelligence’s proprietary estimation framework, updated with the latest available data and insights as of 2026.
Malaysia Renewable Energy Market Trends and Insights
Drivers Impact Analysis*
| Driver | (~) % Impact on CAGR Forecast | Geographic Relevance | Impact Timeline |
|---|---|---|---|
| National Energy Transition Roadmap (NETR) implementation | 4.20% | National, with priority focus on Peninsular Malaysia | Medium term (2-4 years) |
| Upgraded Feed-in-Tariff & NEM 3.0 schemes | 3.80% | Peninsular Malaysia, limited Sabah/Sarawak coverage | Short term (≤ 2 years) |
| Falling LCOE for utility-scale solar PV | 5.10% | National, particularly high-irradiation regions | Long term (≥ 4 years) |
| Corporate PPAs from regional data-centre boom | 4.70% | Klang Valley, Johor, Penang tech corridors | Medium term (2-4 years) |
| Green hydrogen hub projects in Sarawak | 2.90% | Sarawak, with export potential to ASEAN | Long term (≥ 4 years) |
| Floating solar on hydro reservoirs | 3.40% | Sarawak, Pahang, Perak hydro catchments | Medium term (2-4 years) |
| Source: Mordor Intelligence | |||
National Energy Transition Roadmap Implementation Accelerates Grid Modernization
NETR sets binding targets of 31% renewable energy by 2025 and 40% by 2035, unlocking clearer revenue visibility for developers. TNB's capital expenditure (capex) commitment of MYR 42.9 billion (USD 10.2 billion) earmarks 64% for grid reinforcement, including new inter-regional circuits and advanced system operator tools.[1]The Edge Malaysia, “TNB to Double Capex for Grid Modernisation,” theedgemalaysia.com The roadmap mandates 2.5 GW of floating-solar deployments atop hydro dams and five centralized 150 MWp solar parks, directly addressing land scarcity constraints. By integrating Enegem into policy design, NETR also enables exporters to tap the ASEAN Power Grid, elevating Malaysia's renewable energy market competitiveness. Collectively, these measures ease the 24% solar-penetration cap on peak demand, ensuring additional headroom for variable generation.
Corporate PPAs Drive Demand from Data-Center Expansion
Data-center investments of MYR 162 billion (USD 729 billion) booked from 2021 to H1 2024 underpin long-term offtake commitments under the Corporate Renewable Energy Supply Scheme (CRESS).[2]Asian Power, “Data-Center Investments Spur Malaysian PPAs,” asian-power.comEarly signatories, such as AirTrunk and GDS, locked in 29.9 MW and 22.5 MW of virtual PPAs, respectively, with tenor profiles of up to 25 years. TNB itself secured 150 MWp in green electricity supply to Bridge Data Centres under the same framework, adding annuity-style income streams. Corporate buyers prioritize delivery certainty and traceable renewable certificates, driving developers to bundle battery-storage options. The momentum suggests that corporate PPAs could represent 15-20% of Malaysia's annual renewable energy market additions this decade.
Green Hydrogen Projects Transform Sarawak into Regional Export Hub
Sarawak's H2ornbill partnership aims to achieve 150,000 tonnes per year of green hydrogen and 850,000 tonnes per year of green ammonia by 2028, requiring approximately 3 GW of dedicated renewable energy. Complementary projects, including Eneos-Sumitomo's Bintulu plant, illustrate robust Japanese import demand. Sarawak already generated 62% of electricity from renewables in 2024, surpassing its 2030 goal, providing reserve headroom for industrial offtake. State ambitions for 15,000 MW of green energy by 2035 imply a 161% capacity increase versus 2023, reshaping Malaysia's renewable energy market dynamics from a domestic supply to an export-oriented value chain.
Floating Solar Maximizes Land-Constrained Renewable Deployment
A joint Masdar-Sarawak Energy-Gentari study on the Murum reservoir assesses multi-hundred-MW floating arrays, capitalizing on existing transmission assets. Field data from TNB’s 154 kWp Kenyir pilot confirms 10-15% energy-yield uplift owing to water-based cooling and evaporation reduction of up to 70%. With 2.5 GW of floating-solar capacity under TNB’s roadmap, Malaysia could offset land-use conflicts while optimizing hydro-solar hybrid operations. The Batang Ai project alone is expected to cut 52 kt CO₂ annually upon commissioning in 2024, reinforcing its ESG credentials.
Restraints Impact Analysis*
| Restraint | (~) % Impact on CAGR Forecast | Geographic Relevance | Impact Timeline |
|---|---|---|---|
| Grid congestion & curtailment risks | -2.80% | Peninsular Malaysia, particularly southern regions | Short term (≤ 2 years) |
| Limited on-land wind resource quality | -1.90% | National, with specific challenges in Peninsular Malaysia | Long term (≥ 4 years) |
| Land-use conflicts in Sabah & Sarawak | -2.10% | Sabah & Sarawak states | Medium term (2-4 years) |
| Fragmented palm-biomass collection network | -1.40% | Peninsular Malaysia, Sabah, Sarawak plantation regions | Medium term (2-4 years) |
| Source: Mordor Intelligence | |||
Grid Congestion Creates Renewable Energy Curtailment Risks
Solar output already surpasses the 24% peak-demand threshold, leading to periodic curtailment in southern Peninsular Malaysia, where irradiation levels are highest. TNB has allocated 64% of its MYR 16.3 billion (USD 73.4 billion) contingent capex to alleviate bottlenecks, including a 400 MWh BESS in Sabah. Curtailment exposure erodes project returns, prompting regulators at SEDA Malaysia and the Energy Commission to expedite grid code revisions for improved renewable dispatch priority. Smart-grid pilots employing demand response now accompany every new LSS tender to mitigate intermittence.
Land-Use Conflicts Constrain Large-Scale Project Development
Palm oil contributes 2.8% of Malaysia’s GDP, making land reallocation a politically sensitive issue. Agrivoltaics and reservoir-based floating systems are emerging as compromise solutions, yet approval cycles for greenfield sites still span 18-24 months.[3]SEDA Malaysia, “Palm Biomass Potential Report,” seda.gov.my Palm biomass, tallied at 164 million tons per year, remains underutilized due to fragmented collection and costly logistics. The National Biomass Action Plan 2023-2030 aims to secure MYR 17 billion (USD 76.5 billion) in biorefinery investments; however, achieving scale depends on integrating supply-chain upgrades.
*Our forecasts treat driver/restraint impacts as directional, not additive. The impact forecasts reflect baseline growth, mix effects, and variable interactions.
Segment Analysis
By Technology: Geothermal Disrupts Hydropower Dominance
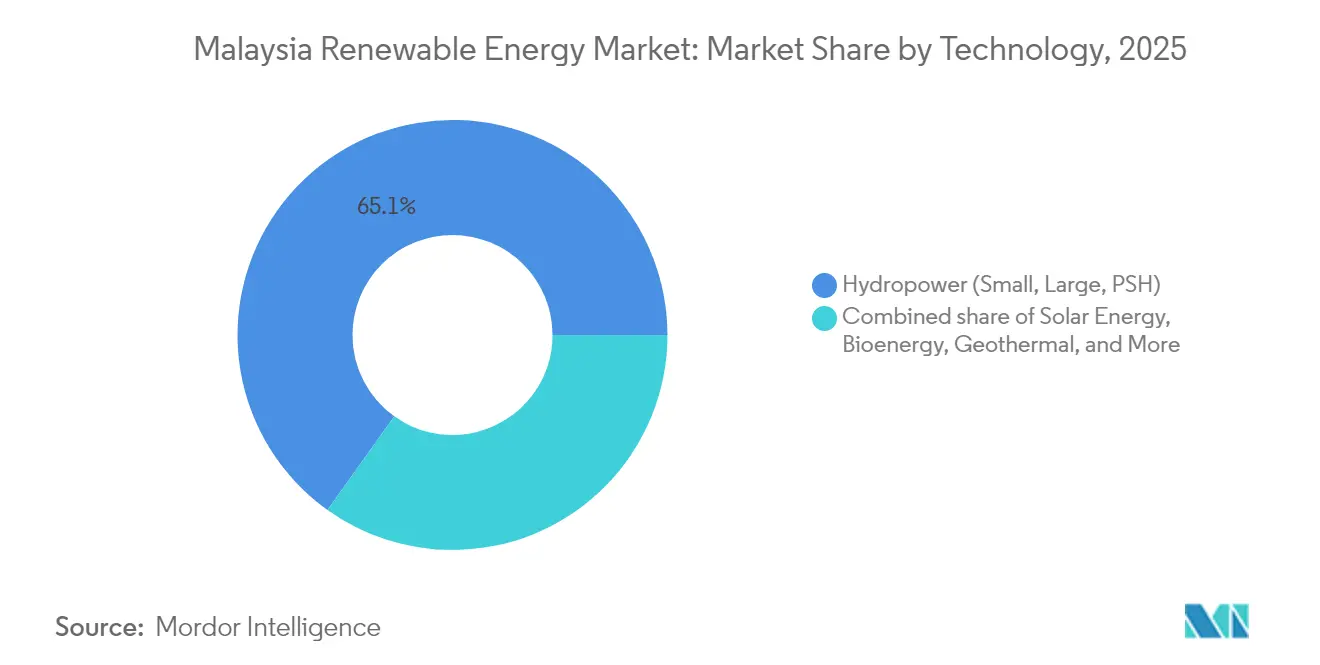
Hydropower retained a 65.12% share of the Malaysian renewable energy market in 2025, anchored by legacy assets such as Bakun and Murum. Yet geothermal, starting from a low base, is forecast to post a 112.76% CAGR, spearheaded by the Tawau project and expanded heat-flow mapping in East Malaysia. Solar PV follows as the volume workhorse amid falling LCOE and corporate offtake appetite. In contrast, onshore wind remains a niche option due to suboptimal wind speeds, while palm biomass offers a technical potential of 2.3 GW under the Biomass Action Plan. Small hydro and nascent ocean-energy pilots round out the mix.
The evolving stack supports grid stability: floating-solar hybrids capitalize on hydro reservoirs, geothermal furnishes baseload, and BESS smooths solar output. Malaysia's renewable energy market size for geothermal is projected to increase rapidly once field development funding is secured, while solar's growth relies on a consistent auction cadence and rooftop adoption. Hydropower's large-dam development is tapering, shifting focus to run-of-river and micro-hydro schemes that minimize ecological impact.



By End-User: Residential Adoption Accelerates Through Enhanced Incentives
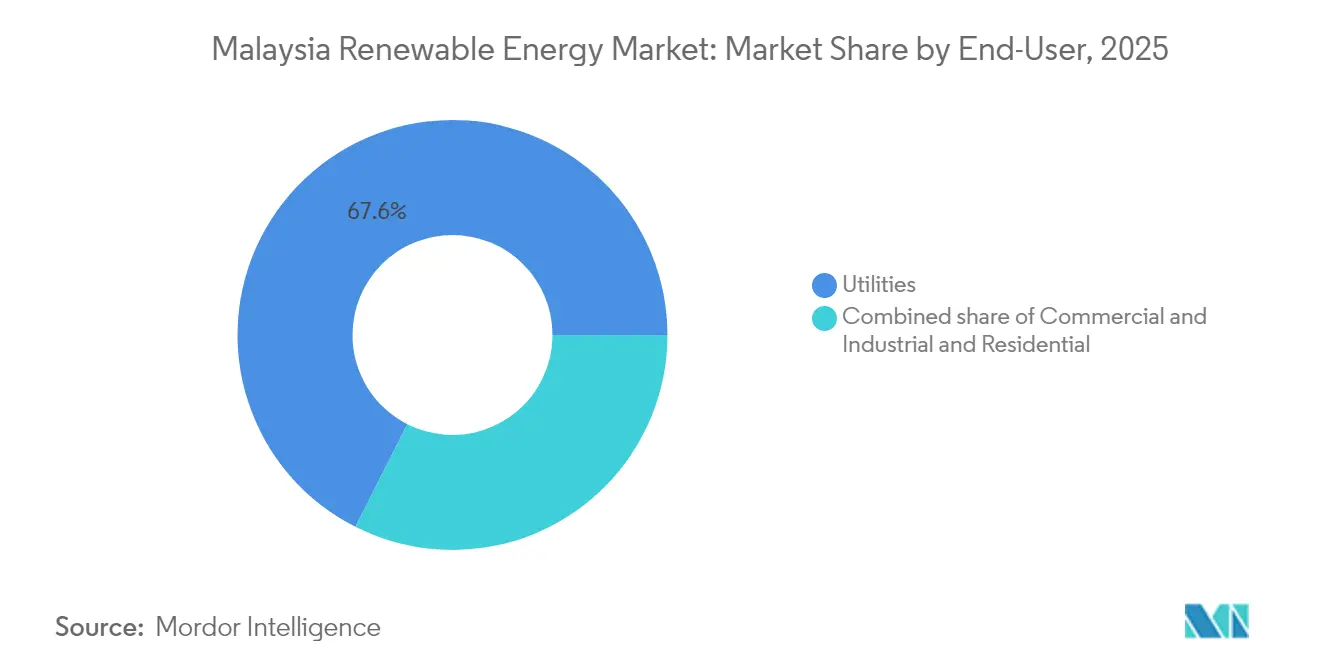
Utilities commanded 67.55% of Malaysia's renewable energy market share in 2025, due to TNB’s consolidated procurement through LSS auctions and bilateral PPAs. The residential segment, however, is on track for a 26.62% CAGR to 2031, catalyzed by NEM 3.0 and the SolaRIS incentive extension through 2025. Commercial and industrial uptake, led by semiconductor fabs and hyperscale data centers, leverages 15-25 year corporate PPAs for tariff hedging and ESG compliance.
Declining rooftop solar system costs and streamlined online approvals have cut payback periods to under seven years for households. Meanwhile, commercial rooftops exploit larger surface areas for self-consumption, qualifying for accelerated capital allowance. Utilities continue to tender multi-gigawatt LSS tranches, ensuring bulk additions but facing curtailment risks unless grid upgrades keep pace.
Geography Analysis
Peninsular Malaysia dominates installations through an extensive TNB network, which delivers proximity to load centers and shorter development cycles. Sarawak, operating an independent grid, is the fastest-growing province, boasting a 62% renewable energy generation mix in 2025 and an ambitious hydrogen export agenda. The state aims for 15,000 MW of green output by 2035, representing a 161% increase from 2023, supported by H2ornbill and other ammonia projects in Sabah.
Sabah's prospects focus on geothermal, and Tawau's; Tawau's geothermal field and 561 MW theoretical biomass capacity represent significant upside. Transmission isolation increases capital expenditures; however, floating-solar and microgrid solutions help address rural electrification gaps. Cross-border trading through Enegem debuted with a 100 MW auction to Singapore in 2024, validating commercial flows and paving the way for gigawatt-scale sales once additional interconnectors with Indonesia come online.
Malaysia's renewable energy market size in Sarawak could surpass incremental additions in the Peninsular regions by the late decade as hydrogen projects absorb multi-gigawatt (GW) of renewable energy. Peninsular Malaysia remains the core for corporate PPAs, data center clusters, and rooftop deployments, while East Malaysia commands resource-driven megaprojects.
Regulatory Landscape
Malaysia's renewable energy framework is administered mainly by the Energy Commission (Suruhanjaya Tenaga, ST) and SEDA Malaysia. It combines auction-based utility procurement (Large Scale Solar, LSS) with distributed-generation and green attributes programs, including Net Energy Metering (NEM 3.0) and Feed-in Tariff (FiT 2.0) e-bidding for biogas, biomass, and small hydropower. NETR sets the broader policy direction, including interim renewable energy milestones and grid-modernization measures, while Energy Exchange Malaysia (ENEGEM), launched in April 2024, provides the route for cross-border renewable electricity trade.
In 2026, implementation-focused instruments expanded corporate and consumer access. ST issued updated guidelines for the Corporate Renewable Energy Supply Scheme (CRESS), allowing businesses to procure renewable electricity through grid-based arrangements, alongside reduced network access charges (including reductions of up to 40% for CRESS and the Community Renewable Energy Aggregation Mechanism, CREAM). For consumer-driven solar, ST operationalized the Solar Accelerated Transition Action Programme (Solar ATAP) from 1 January 2026 to support self-consumption systems with grid export capability. SEDA Malaysia continued FiT 2.0 e-bidding administration, including the closure of a 2026 quota e-bidding window on 17 March 2026 for biogas, biomass, and small hydropower resources.
Competitive Landscape
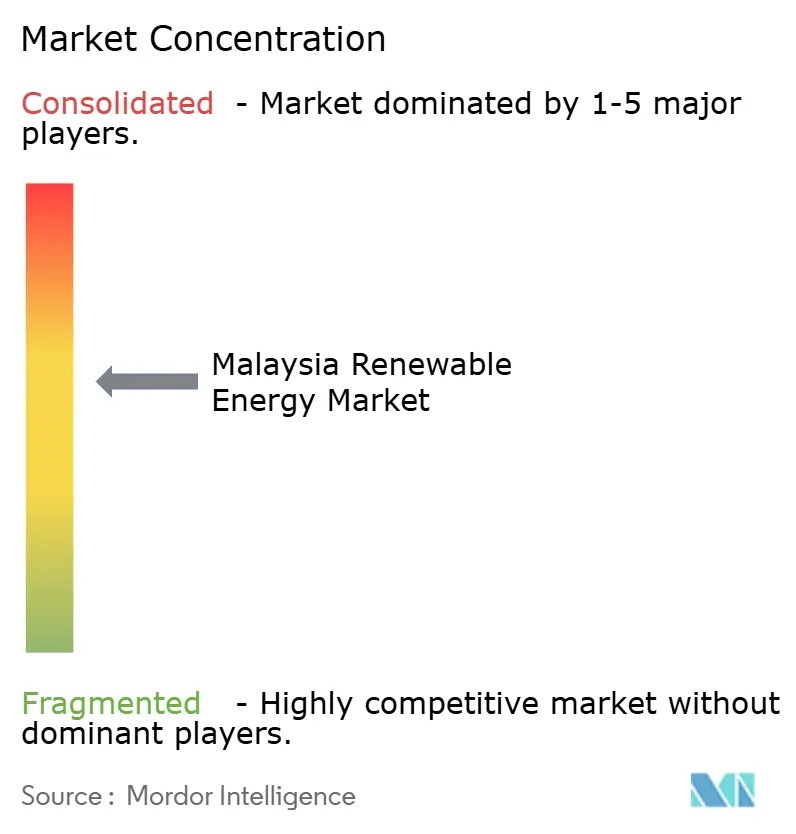
Malaysia's renewable energy market exhibits moderate concentration. State-linked incumbents TNB and Sarawak Energy collectively hold the bulk of grid assets and over 3.3 GW of domestic renewable capacity.[4]The Edge Malaysia, “TNB Renewable Portfolio Update,” theedgemalaysia.comChinese OEMs, including JinkoSolar, LONGi, and Risen, have localized assembly, with JinkoSolar's 500 MW cell and 450 MW panel plant scheduled for inauguration in 2025. This localization mitigates U.S. tariff exposure and reduces supply chain length for ASEAN orders.
Competition hinges on grid integration expertise, storage deployment, and corporate Power Purchase Agreement (PPA) origination. Gentari leverages PETRONAS' balance sheet heft to bundle hydrogen with renewables, while project developers specializing in floating solar and agro-photovoltaic niches gain traction. Biomass developers with efficient palm-waste aggregation networks are well-positioned to secure FiT 2.0 quotas ahead of their peers. Standardized technical rules under SEDA Malaysia ensure equipment quality and installer certification, lowering entry barriers for compliant firms.
Malaysia Renewable Energy Industry Leaders
Tenaga Nasional Berhad (TNB)
Sarawak Energy Berhad
Solarvest Holdings Berhad
Plus Xnergy Holding Sdn Bhd
Cypark Resources Berhad
- *Disclaimer: Major Players sorted in no particular order

Market Opportunities and Future Outlook
Near-term whitespace is concentrated where policy is shifting from capacity additions to bankable grid access and integration. Solar ATAP, effective 1 January 2026, creates a structured pathway for consumer-based solar with export capability, broadening addressable demand beyond traditional self-consumption rooftops. It also pushes project and commercial solution bundles that cover metering, interconnection engineering, and compliance services. On the corporate side, CRESS, with guidelines most recently updated in December 2025, supports physical procurement via the grid, and the combination with reduced access charges (including up to 40% reductions for CRESS/CREAM) improves the commercial case for developers and aggregators serving data centers and industrial buyers that need traceable green supply.
System-level constraints are also shaping where projects can clear approvals and earn stable returns. Grid congestion and efforts to raise the solar penetration ceiling are redirecting capex toward network reinforcement and flexibility assets, in line with NETR-led grid modernization under TNB. Industrial decarbonization demand is being reinforced by policy signals such as the Energy Efficiency and Conservation Act 2024 (in force from January 2025) and Budget 2026's carbon tax introduction for selected hard-to-abate sectors, effective from 2026. In East Malaysia, Sarawak's export-oriented energy agenda supports a pipeline for large renewable generation and the enabling infrastructure needed to monetize it, while ENEGEM provides the institutional mechanism for cross-border renewable electricity flows.
Recent Industry Developments
- May 2026: TNB Kuala Muda Solar Sdn Bhd issued a RM1.05 billion Asean Green SRI Sukuk to finance a 500 MW solar PV facility in Kedah. The financing improves bankability for large-scale solar buildouts and reflects deeper use of labeled capital markets for grid-connected renewables.
- April 2026: A consortium led by Cypark Resources Berhad and Sunview Group Berhad secured a RM1.96 billion EPCC contract from TNB Power Generation Sdn Bhd for the 595 MW Kenyir hybrid-hydro floating solar (HHFS) plant. The award advances commercialization of reservoir-based floating solar at scale and supports a NETR-aligned hybrid template using existing hydro assets for interconnection.
- December 2024: Malaysia announced the Large-Scale Solar 5 (LSS5) programme, extending the auction pipeline for utility-scale solar procurement. The continued tender cadence supports developer visibility on project sequencing and keeps EPC, module supply, and grid-connection activity aligned with national transition targets.


Research Methodology Framework and Report Scope
Market Definition and Coverage
For this study, the Malaysia renewable energy market is defined as the country-level installed renewable power capacity that is connected to the grid or otherwise commissioned, measured in gigawatts across eligible renewable technologies.
Scope exclusions: We exclude fossil-based generation, captive conventional backup sets, and value metrics such as project investment and revenue when they are not directly tied to commissioned renewable capacity.
Segmentation Overview
- By Technology
- Solar Energy (PV and CSP)
- Wind Energy (Onshore and Offshore)
- Hydropower (Small, Large, PSH)
- Bioenergy
- Geothermal
- Ocean Energy (Tidal and Wave)
- By End-User
- Utilities
- Commercial and Industrial
- Residential
Data Sources, Market Sizing, and Validation
Desk Research
Desk research starts with building a clean fact base on Malaysia power capacity additions, policy targets, and grid conditions, and then mapping these signals to renewable commissioning timelines. We used public sources such as Malaysia Energy Commission publications, SEDA Malaysia program updates, the IEA country energy statistics, IRENA renewable capacity series, and Department of Statistics Malaysia releases to anchor definitions and historical direction.
In addition, we reviewed project and developer disclosures from annual reports, investor presentations, and utility announcements, since commissioning dates often move and need to be tracked carefully. In a few places, paid subscriptions for company financials and intelligence, news and financials, and a patent database were used to cross-check ownership changes and technology momentum without over-relying on any single outlet. These sources are illustrative and not exhaustive, and many other public references were used for data collection, validation, and clarification during the work.
Primary Interviews and Surveys
Primary work was used to sanity-check the capacity pipeline, expected commissioning slippage, and the way programs translate into realized megawatts, with inputs from developers, EPC and O&M participants, financiers, and policy and grid-facing experts. Since this is a country market, the focus stayed on Malaysia-wide demand and buildout drivers, and we used these conversations to confirm assumptions on technology mix shifts and typical project execution cycles.
Distribution of primary research fieldwork respondents
| Company type | Respondent position |
|---|---|
| Top tier: 33% | CXOs: 16% |
| Mid tier: 50% | Functional/Unit leaders: 31% |
| Smaller Players: 17% | Managers: 53% |
Market-Sizing & Forecasting
Sizing is built using a top-down approach where national renewable capacity is reconstructed from official capacity series, program allocations, and observed commissioning progress, and then adjusted to match what is practically deliverable in a given year. To avoid over-stating additions, results are corroborated with selective bottom-up approximations such as sampled project roll-ups from public pipelines, channel checks on award to COD timing, and a quick MW-by-technology build that is compared back to the national total.
Key inputs that shaped the model include annual commissioned capacity additions (MW), technology mix changes across solar, hydro, and bioenergy, program-driven award volumes and schedule expectations, grid connection readiness signals, and retirement or re-rating events that can change net capacity. Forecasting is handled through scenario analysis, where a base case is set from policy direction and developer execution feedback, and then stress-tested with slower permitting or faster tender outcomes. Where a full project list is not visible, gaps are handled by applying conservative realization factors to announced pipelines, which are then re-checked with interview insights before finalizing the totals.
Data Validation & Update Cycle
Validation is done through cross-checking the modeled installed capacity against independent signals such as official capacity publications, announced commissioning, and observed trend breaks in additions by technology. When large year-on-year jumps appear, we trace them back to specific programs, project batches, or one-off events, and then re-check with a second source before sign-off.
A multi-step internal review is followed so the definitions, arithmetic, and assumptions remain consistent across years, and any material variance triggers a re-contact with relevant experts to confirm the driver. Reports are refreshed annually, and interim updates are made when major auctions, policy changes, or commissioning surprises can move the near-term trajectory. Before delivery, one more pass is completed so clients receive the latest updated view that aligns with the most recent public releases.
Mordor Intelligence's Malaysia Renewable Energy Market Estimate Compared With Other Published Estimates
Published market sizes for Malaysia renewable energy often do not line up because the unit of measure differs, the boundary between capacity, generation, and revenue is handled differently, and forecast pacing is influenced by different policy and execution assumptions. Even when the topic looks identical, a capacity-based market can move very differently than a value-based market, so the reported number and its growth rate will diverge.
Key gap drivers are usually practical. Some estimates convert installed MW into USD using assumed capex per MW and mix shifts, and then add related spending like storage or grid works, which makes the value number larger but less comparable to a pure capacity view. Others use aggressive tender realization and faster COD timelines, or they keep currency conversion timing and inflation treatment unclear, which can shift the same year noticeably.
Benchmark comparison
| Source | Market Size | Gaps in Research Methodology |
|---|---|---|
| Mordor Intelligence | USD 11.09 B (2025) | |
| Global Consultancy A | USD 3.80 B (2024) | Uses a value-based lens in USD and typically relies on capex and technology-cost assumptions to translate activity into market value, which is not directly comparable to installed capacity totals. |
| Industry Publisher B | USD 7.42 B (2032) | Reports a longer-range value forecast that can reflect optimistic execution and broader inclusion (often adding adjacent spending categories), which can widen the gap versus a capacity-only year-by-year build. |
The table shows that the spread is mainly explained by unit choice and what gets counted, and in Mordor Intelligence's model the market is treated as installed renewable capacity in gigawatts rather than a converted USD spending or revenue pool. With this approach, the final number stays traceable to commissioning, technology mix, and program delivery timing, and it can be repeated each year using the same observable inputs.


Key Questions Answered in the Report
How fast is renewable capacity growing in Malaysia?
Installed capacity is forecast to rise from13.68 GW in 2026 to 39.03 GW by 2031, representing a 23.33% CAGR driven by NETR policy support and corporate PPAs.
Which technology segment is expanding the quickest?
Geothermal is expected to clock a 112.76% CAGR through 2031, outpacing solar and hydropower due to projects like Tawau in Sabah.
Why are corporate PPAs important to Malaysian renewables?
Data-center operators and multinationals sign 15-25-year PPAs that now drive 15-20% of anticipated capacity additions, ensuring predictable revenues for developers.
What role does Sarawak play in green hydrogen?
Sarawak targets 150,000 t/y hydrogen output by 2028, supported by hydro-powered electrolyzers, positioning Malaysia as a regional export hub.
How is the grid being upgraded for higher renewable penetration?
TNB has allocated MYR 42.9 billion for grid reinforcement, including battery storage and new transmission lines that will raise the current 24% solar-penetration ceiling.
What incentives exist for residential rooftop solar?
The NEM 3.0 scheme and SolaRIS program grant favorable tariffs and faster approvals, reducing household payback periods to under seven years.
Page last updated on:




