Locomotive Market Size and Share
Market Overview
| Study Period | 2019 - 2031 |
|---|---|
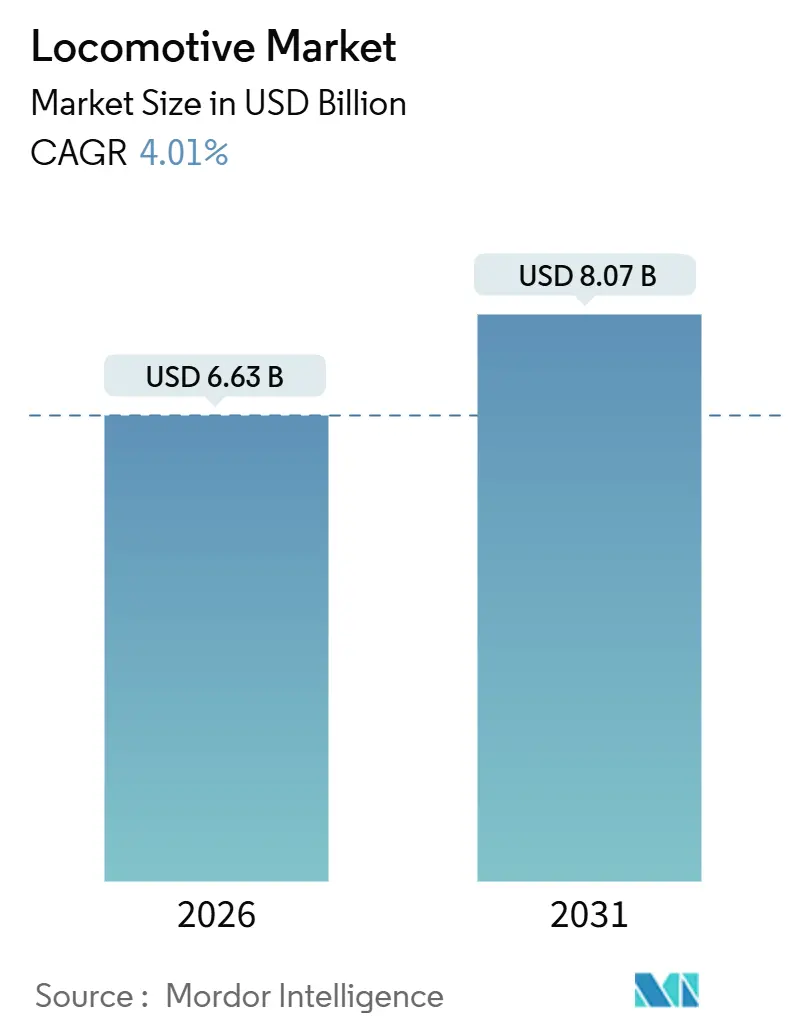
| Market Size (2026) | USD 6.63 Billion |
| Market Size (2031) | USD 8.07 Billion |
| Growth Rate (2026 - 2031) | 4.01% CAGR |
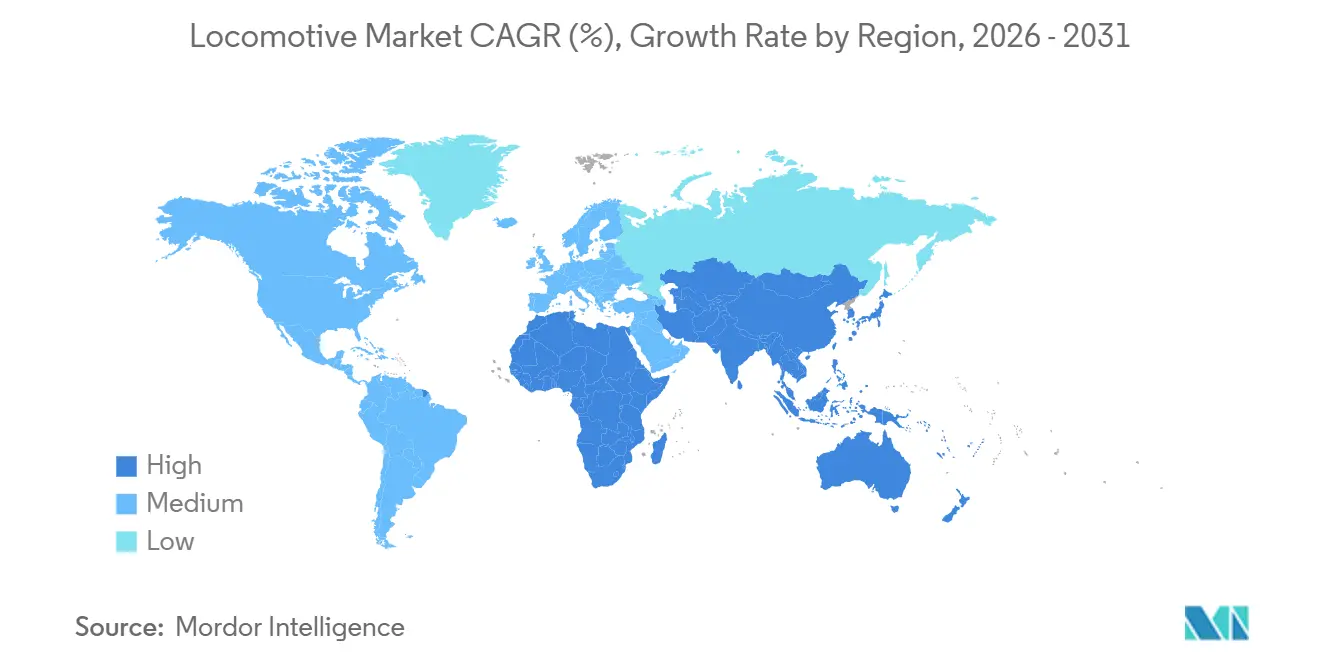
| Fastest Growing Market | Asia Pacific |
| Largest Market | Asia Pacific |
| Market Concentration | Medium |
Major Players *Disclaimer: Major Players sorted in no particular order Image © Mordor Intelligence. Reuse requires attribution under CC BY 4.0. | |
Locomotive Market Analysis by Mordor Intelligence
The locomotive market size was USD 6.63 billion in 2025 and is projected to reach USD 8.07 billion by 2031, growing at a 4.01% CAGR over the forecast period. Rising freight ton-kilometers, national electrification programs, and efficiency gains from silicon-carbide power electronics are supporting the steady expansion of the locomotive traction system market. Diesel propulsion remains the backbone of global fleets, yet battery-electric pilots are gaining traction as operators seek fuel savings and compliance with emissions regulations. The Asia-Pacific region leads both in volume and growth, as India has completed network-wide electrification, while China channels export finance into Belt and Road corridors. Component innovation centers on high-efficiency inverters and large-format battery packs that promise lower life-cycle costs. Several multinational suppliers dominate the installed capacity, indicating a moderate level of competitive intensity. Meanwhile, regional specialists adeptly cater to niche markets, including retrofit and software.
Key Report Takeaways
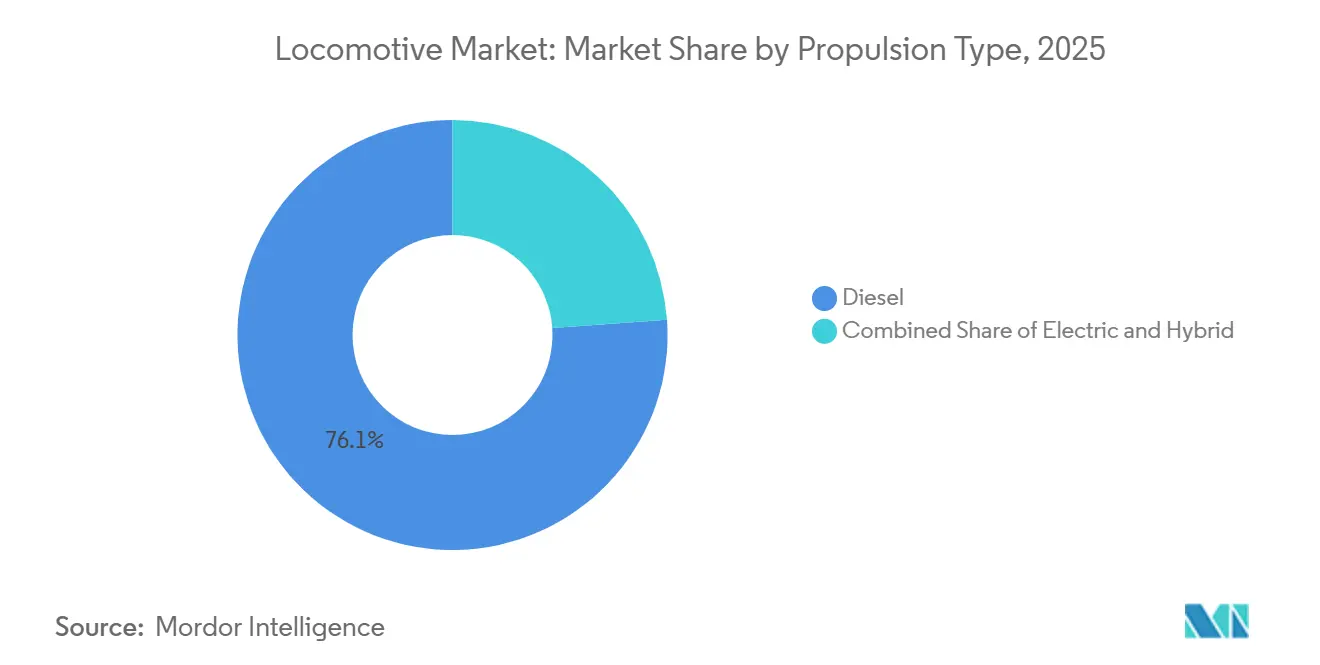
- By propulsion type, diesel platforms held 76.13% share of the locomotive market in 2025, while battery-electric units represent the fastest segment with a 4.61% CAGR to 2031.
- By technology, IGBT modules led with 64.22% of locomotive market share in 2025; Silicon Carbide modules are projected to grow at a 4.75% CAGR through 2031.
- By component, traction motors accounted for 42.32% share of the locomotive market size in 2025 and battery packs are advancing at a 4.38% CAGR through 2031.
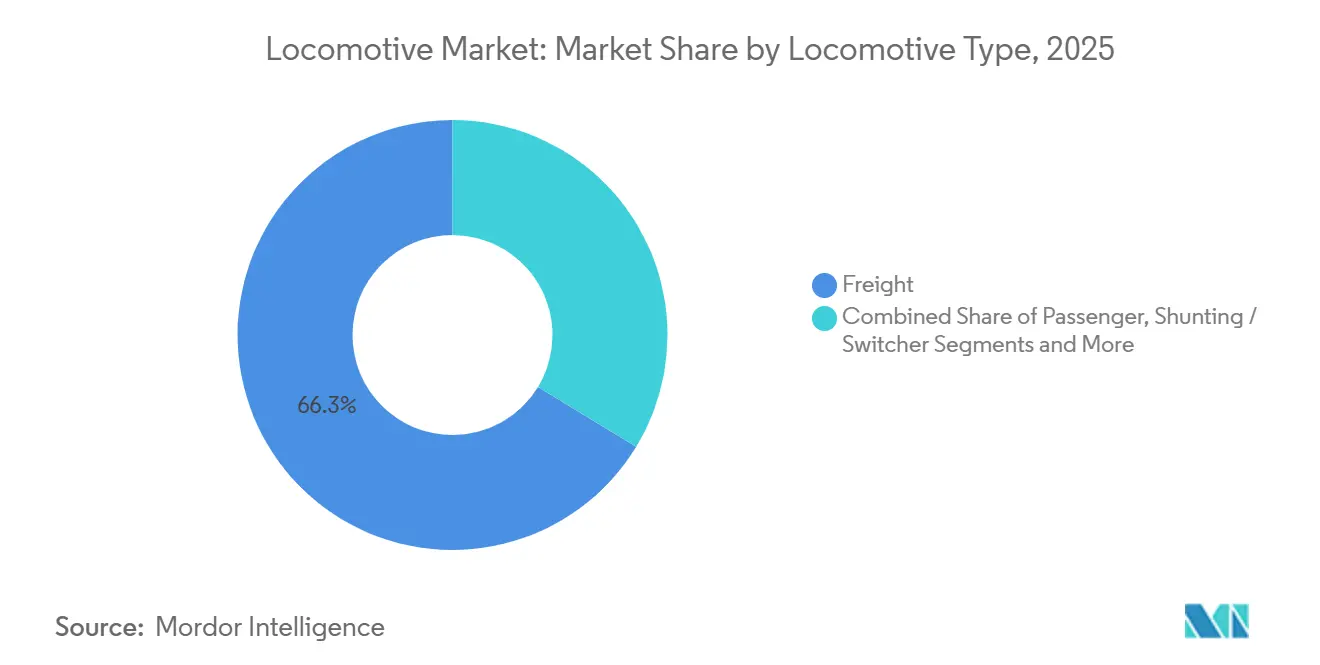
- By locomotive type, freight units captured 66.31% of locomotive market share in 2025; high-speed passenger locomotives are expanding at a 5.33% CAGR to 2031.
- By power rating, the 2,000–4,000 kW class commanded 46.57% share of the locomotive market size in 2025, whereas units above 4,000 kW are growing at a 4.12% CAGR.
- By geography, Asia-Pacific led the locomotive market with a 42.17% share in 2025 and is forecast to grow at a 4.45% CAGR through 2031.
Note: Market size and forecast figures in this report are generated using Mordor Intelligence’s proprietary estimation framework, updated with the latest available data and insights as of January 2026.
Global Locomotive Market Trends and Insights
Drivers Impact Analysis
| Driver | (~) % Impact on CAGR Forecast | Geographic Relevance | Impact Timeline |
|---|---|---|---|
| Rail Electrification and Infra Spend | +1.1% | Europe, India, China; spillover to Middle East and South America | Long term (≥4 years) |
| Global Rail Volume Growth | +0.8% | Global, with concentration in Asia-Pacific and North America | Medium term (2–4 years) |
| High-Efficiency Traction Tech | +0.6% | Global, led by Japan, Germany, United States | Short term (≤2 years) |
| Battery-Electric and Dual-Mode Retrofits | +0.5% | North America, Europe, Australia | Medium term (2–4 years) |
| Carbon Credit and ESG Financing | +0.4% | Europe, North America, select Asia-Pacific markets | Long term (≥4 years) |
| Predictive Maintenance Analytics | +0.3% | Global, early adoption in Europe and North America | Short term (≤2 years) |
| Source: Mordor Intelligence | |||
Government-Led Rail Electrification and Infrastructure Spend
Public spending has significantly increased, with India making a substantial commitment to support the complete electrification and deployment of Vande Bharat trainsets [1]“100% Broad-Gauge Electrification Achieved,”, Indian Railways, indianrailways.gov.in. The United States has allocated a considerable amount under its Infrastructure Investment and Jobs Act, with a portion designated explicitly for the Northeast Corridor, favoring electric or hydrogen traction. Europe’s TEN-T initiative aims to achieve a high level of electrification on its primary routes, necessitating the installation of extensive new catenary infrastructure. Payback periods are shorter when freight volumes reach higher thresholds, prompting main-line projects to adopt overhead power, while branch lines focus on batteries or hydrogen. China has expanded its influence by financing electrified export corridors, strategically bundling CRRC locomotives with infrastructure loans to Southeast Asia.
Growing Freight and Passenger Rail Volumes Worldwide
Global rail freight experienced significant growth, driven by supply-chain re-shoring that shifted cargo to land bridges and North American Class I networks [2]“Rail Traffic Highlights 2024,”, International Union of Railways, uic.org. Passenger traffic also rebounded strongly, nearing pre-pandemic levels, supported by increased demand in India's suburban areas and the expansion of high-speed services in China. Rising volumes are fueling procurement activities, with major freight operators placing substantial orders for locomotives to meet higher utilization thresholds. North American main lines, operating at high capacity, are replacing older fleets with advanced models that significantly reduce fuel consumption. Urban ridership spikes in cities such as Delhi, Mumbai, and Jakarta are driving additional orders for suburban EMUs, emphasizing the importance of maintaining a diversified traction portfolio.
Advancements in High-Efficiency Traction Electronics
Mitsubishi Electric introduced silicon-carbide inverters that significantly reduce switching losses and operate at higher junction temperatures, which also minimizes the required heat-sink volume [3]“3.3 kV SiC Traction Inverter,”, Mitsubishi Electric, mitsubishielectric.com. Hitachi Rail, utilizing advanced SiC MOSFET packages, achieved notable improvements in inverter efficiency. This development not only reduced the weight of the carbody but also created additional space for batteries. Although SiC modules are more expensive compared to IGBTs, high-usage applications can offset the extra cost over time through energy savings and reduced maintenance needs. Wabtec and Siemens are testing hybrid topologies that incorporate SiC in specific stages, capturing most of the efficiency benefits at a fraction of the cost of complete SiC systems. Regulatory changes in the European Union are expected to enforce higher efficiency standards for inverters, accelerating the shift away from older technologies.
Modular Battery-Electric and Dual-Mode Retrofit Solutions
Union Pacific, BNSF, and Norfolk Southern operate fifteen 7 MWh battery units that deliver a full day of yard switching with zero idling fuel burn. Progress Rail offers a kit designed to convert GP38 and SD40 switchers into battery-diesel hybrids, targeting a significant number of aging units in North America. Hitachi's battery-powered EMUs, after charging under catenary, can operate off-wire for extended distances. This feature enables operators to avoid substantial electrification costs on low-density branches. The economics are particularly favorable for high-idle cycles: a typical yard locomotive achieves notable annual fuel savings while also bypassing Tier 4 after-treatment expenses. Battery longevity depends on its chemistry; lithium-titanate batteries retain a higher capacity over more cycles compared to nickel-manganese-cobalt batteries, which limits the latter's suitability for heavy-haul applications.
Restraints Impact Analysis
| Restraint | (~) % Impact on CAGR Forecast | Geographic Relevance | Impact Timeline |
|---|---|---|---|
| High Upfront Costs | -0.8% | Global, particularly acute in emerging markets | Long term (≥ 4 years) |
| Tightening Emission Rules | -0.6% | North America, Europe, with expanding coverage | Medium term (2-4 years) |
| Limited Battery Supply Chain | -0.5% | Global, with bottlenecks in lithium processing | Short term (≤ 2 years) |
| Grid Capacity Bottlenecks | -0.4% | Europe, North America, with infrastructure lag | Long term (≥ 4 years) |
| Source: Mordor Intelligence | |||
High Upfront Procurement and Lifecycle Service Costs
Electric freight locomotives are significantly more expensive than Tier 4 diesel locomotives. Additionally, long-term service agreements further increase the overall cost over their operational lifespan. Battery-electric units require depot chargers, which involve substantial installation costs and can support multiple units. Tenders in emerging markets are often supported by sovereign guarantees, which can lead to delays in contract awards. Electric units also face higher residual-value risks due to concerns among secondary buyers about potential changes in grid standards and the obsolescence of inverters, which negatively impact resale prices. Smaller operators, unable to justify the investment in in-house maintenance facilities, often delay electrification despite the rising costs of fuel.
Limited High-Power Battery Supply Chain for Heavy-Haul Use
Automotive demand has significantly absorbed battery-grade nickel, resulting in extended lead times for nickel-manganese-cobalt cathodes. Heavy-haul locomotives require large battery packs, which are considerably more expensive than automotive packs due to the need for ruggedization and long-term warranties. Current lithium-titanate anode production capacity is insufficient to meet the growing demand for locomotive packs. The validation process for these packs further extends production timelines, delaying deliveries and increasing the risk of penalties for customers. Additionally, North American Class I railroads operate far fewer charging depots than needed to support their planned battery fleets, requiring substantial investment in utility infrastructure upgrades.
Segment Analysis
By Propulsion Type: Diesel Dominance Yields to Battery Momentum
Diesel propulsion captured 76.13% of the locomotive traction system market share in 2025, supported by an installed base of 120,000 diesel-electric units and partial network electrification. Battery-electric models grow at a 4.61% CAGR as 7 MWh retrofit kits strip idle fuel burn from yard duties and improve air quality. In Europe and North America, tighter EPA Tier 5 and Euro Stage VI regulations are significantly increasing the costs of new diesel units. As a result, government mandates and escalating diesel after-treatment expenses are reducing the appeal of electric overhead and hydrogen fuel-cell alternatives.
In India and China, the electrification of main lines supports a steady demand for 25 kV AC systems. Meanwhile, hybrid battery-catenary designs effectively address gaps in networks that are only partially wired. The market for battery-electric units in the locomotive traction system is expected to grow, driven by increasing retrofit activities within the North American switcher fleet. Additionally, hydrogen prototypes, like Alstom’s Coradia iLint, highlight the untapped potential for regional routes that currently lack overhead power.
Note: Segment shares of all individual segments available upon report purchase
By Technology: SiC Modules Challenge IGBT Incumbency
IGBT modules accounted for 64.22% of the revenue in 2025, thanks to mature supply chains and lower pricing. Silicon-carbide modules, though costlier, expand at a 4.75% CAGR by delivering lower switching losses and lighter traction packages. As high-speed and heavy-haul operators prioritize life-cycle energy savings, the locomotive traction system market associated with SiC inverters is expected to experience significant growth in the coming years. Upcoming ecodesign efficiency thresholds are set to accelerate this substitution.
While gate-turn-off thyristors remain in legacy fleets, they're being phased out during mid-life overhauls. Hybrid IGBT–SiC topologies, developed by Siemens and Wabtec, achieve a substantial portion of the SiC efficiency gain at a fraction of the full-SiC cost, facilitating a smoother adoption. However, redesigning components for gate drivers and cooling demands considerable engineering time, underscoring the advantage of vertically integrated suppliers.
By Component: Traction Motors Lead, Battery Packs Surge
Traction motors generated 42.32% of 2025 component revenue, fueled by replacement demand in North America and new orders linked to India’s tender. Battery packs are the fastest growing at a 4.38% CAGR because Class I railroads are retrofitting switchers to reduce idle fuel consumption. Despite ongoing supply chain constraints, the market for battery packs in locomotive traction systems is expected to grow significantly in the coming years.
Inverters constitute a notable portion of the bill of materials value. Additionally, silicon-carbide designs provide substantial energy savings in traction, benefiting both freight and high-speed applications. While transformers and rectifiers remain essential for overhead electric and dual-mode platforms, fuel-cell stacks, though currently minimal, are expanding rapidly, supported by European hydrogen initiatives.
By Locomotive Type: Freight Volume Drives, High-Speed Accelerates
Freight locomotives dominated deliveries, accounting for a 66.31% share in 2025. North American networks achieved a record density, reaching significant gross ton-miles for every route-mile. High-speed units post the quickest 5.33% CAGR as France, Spain, and Japan replace aging fleets with 9.2 MW next-generation trainsets. Passenger units for regional and intercity service remain stable at around 20%, as electrification is mature in Europe and Japan, but lags in North America.
Shunting locomotives, which are responsible for a significant portion of shipments, are now prime candidates for battery retrofits aimed at reducing idling emissions. As China continues to expand its high-speed rail network, the market share for high-speed locomotive traction systems is poised to increase, thereby bolstering demand for high-power traction packages.
Note: Segment shares of all individual segments available upon report purchase
By Power Rating: Mid-Range Leadership Amid High-Power Expansion
Units rated 2,000–4,000 kW accounted for 46.57% of 2025 sales, as they meet the needs of regional passenger and intermodal freight services. Platforms above 4,000 kW will outpace other bands at a 4.12% CAGR as Australian iron-ore and North American coal routes demand 6-axle locomotives that pull 15,000-ton trains.
Below-2,000 kW classes cover switching and industrial niches where capital discipline matters more than raw tractive effort. Battery limitations cap heavy-haul battery prototypes at 4,500 kW because a 10 MWh pack weighs up to 50 tons, equal to the space of 8,000 liters of diesel fuel.
Geography Analysis
Asia-Pacific generated 42.17% of global revenue in 2025 and is expected to compound at 4.45% through 2031, supported by India’s 100% broad-gauge electrification and China’s Belt and Road export financing. India has allocated significant funding for dedicated freight corridors, aiming to enhance its rail infrastructure. China has expanded its high-speed rail network, driving regional demand for advanced power packages. Australia is advancing its iron-ore operations, and Japan is upgrading its Shinkansen services, contributing to overall growth. Local content rules in India, Indonesia, and South Korea are extending procurement timelines but are also strengthening domestic manufacturing capabilities.
Europe holds a substantial share of the market revenue. A major initiative is targeting the development of extensive new catenary lines. Germany has made significant investments in fleet upgrades. France has placed orders for new high-speed train sets, and Italy is transitioning to hydrogen-powered units to replace diesel on non-electrified routes. Electrification delays in the UK are driving demand for bi-mode and battery-powered units. Sanctions on Russia are shifting its production focus to meet domestic requirements.
North America represents a notable portion of market spending. A central infrastructure act is channeling funding into rail projects, prioritizing electric and hydrogen solutions for key corridors. Class I operators are managing a large fleet of predominantly diesel locomotives but are testing battery hybrids to comply with upcoming environmental regulations. Canada is exploring hydrogen-powered intercity services, while Mexico is gradually upgrading its freight rail systems.
South America, along with the Middle East and Africa, contributes a smaller share of the market revenue. Brazil has placed orders for electric locomotives. Saudi Arabia is considering expanding its high-speed rail network. Egypt and Turkey are making gradual improvements to their rail systems, though financial challenges often cause delays.
Competitive Landscape
CRRC, Alstom, Siemens, and Wabtec collectively account for a significant portion of the global locomotive traction system market, indicating a moderate concentration. National procurement rules are reshaping sourcing dynamics: India’s Production-Linked Incentive mandates a high percentage of local content, while the U.S. prioritizes domestic assembly for Amtrak rebuilds. Alstom and Siemens, by keeping traction motors and inverters in-house, protect their gross margins. In contrast, Wabtec, which relies on external power electronics, derives a substantial share of its segment profit from aftermarket services.
Strategic moves are focusing on white-space technologies. Alstom’s Coradia iLint has achieved notable commercial success, and Stadler has secured multiple hydrogen orders across various European countries. Battery switchers address a retrofit market with significant potential in North America. New players, such as Ballard, which provides fuel-cell modules, and innovators in high-density batteries for rail, are gaining traction. Digital twin solutions, such as Siemens Railigent, are equipping numerous units globally, reducing unplanned downtime and generating subscription revenue independent of new builds.
Locomotive Industry Leaders
Alstom SA
Siemens AG
Hyundai Rotem
CRRC Corporation Limited
Wabtec Corporation
- *Disclaimer: Major Players sorted in no particular order

Recent Industry Developments
- May 2025: Kinkisharyo International (KILLC) has inked a deal with Hyundai Rotem USA to handle the final assembly of 182 new railcars, with an option for 50 more, destined for the Los Angeles Metropolitan Transportation Authority (LA Metro).
- May 2025: Siemens India has rolled out India's inaugural 9000 HP electric locomotive, with key components crafted at its facilities in Nashik, Aurangabad, and Mumbai.
- April 2025: Alstom has announced an investment plan of over EUR 150 million to boost production capacity at its French sites. This move is in response to surging demand in both French and global rail markets, with a special focus on very high-speed trains.
Research Methodology Framework and Report Scope
Market Definitions and Key Coverage
Our study defines the global locomotive market as the annual factory-gate value of newly built self-propelled rail vehicles that supply traction power to passenger and freight trains, whether by diesel-electric, pure electric, dual-mode, battery, or hydrogen propulsion. The valuation captures the ex-works price of the complete unit, including traction drive, control electronics, and onboard auxiliary systems, at first sale to rail operators or rolling-stock leasing companies.
Scope exclusion: refurbishment, mid-life overhauls, and maintenance service revenues are deliberately left out.
Segmentation Overview
- By Propulsion Type
- Diesel
- Electric (Overhead)
- Hybrid
- By Technology
- IGBT Module
- GTO Thyristor
- SiC Module
- MOSFET Module
- By Component
- Traction Motor
- Inverter
- Rectifier
- Alternator
- Transformer
- Battery Pack
- Fuel Cell Stack
- By Locomotive Type
- Freight
- Passenger
- Shunting / Switcher
- High-Speed
- By Power Rating (kW)
- Below 2,000 kW
- 2,000 to 4,000 kW
- Above 4,000 kW
- By Geography
- North America
- United States
- Canada
- Rest of North America
- South America
- Brazil
- Argentina
- Rest of South America
- Europe
- Germany
- United Kingdom
- France
- Italy
- Russia
- Rest of Europe
- Asia-Pacific
- China
- India
- Japan
- South Korea
- Australia
- Rest of Asia-Pacific
- Middle East and Africa
- Saudi Arabia
- United Arab Emirates
- Egypt
- Turkey
- South Africa
- Rest of Middle East and Africa
- North America
Detailed Research Methodology and Data Validation
Primary Research
Mordor analysts interviewed rolling-stock procurement managers on three continents, senior engineers at leading OEMs, and government rail-planning officials. These conversations validated electrification timelines, average contract lead times, and replacement cycles, and they calibrated preliminary volume estimates derived from desk research.
Desk Research
We began with public datasets that track rail capacity additions, such as International Union of Railways fleet bulletins, UN Comtrade customs codes for HS 8601/8602 deliveries, the European Railway Agency's annual vehicle authorizations, and the US Federal Railroad Administration procurement filings. Statistics from national transport ministries in India, China, and Germany enriched regional delivery splits, while company filings and investor presentations clarified average selling prices. Paid intelligence from D&B Hoovers and Marklines helped us benchmark manufacturer revenue streams and model production runs. The sources listed are illustrative; numerous additional databases and trade journals were reviewed to confirm figures and resolve discrepancies.
The output from these repositories built the foundational demand pool. Trend articles and patent grants (Questel) signaled emerging SiC traction modules and battery pack design shifts that affect future unit pricing.
Market-Sizing & Forecasting
A top-down reconstruction of global locomotive deliveries was performed by pairing country-level production and import totals with prevailing ex-works ASP brackets. Sampled bottom-up cross-checks, supplier roll-ups, and channel spot quotes then fine-tuned aggregate value.
Key variables in the model include electrified-track share, average power-rating mix, fleet retirement age, and capital-budget allocations announced under stimulus bills. Forecasts to 2030 were generated through multivariate regression that links locomotive demand to freight-ton-kilometers, passenger-rail ridership, and electrification capex, with scenario ranges vetted by interviewed experts.
Data Validation & Update Cycle
Outputs pass three-stage reviews: variance screening against historical fleet patterns, anomaly investigation by a second analyst, and sign-off by the sector lead. We refresh the dataset each year and reopen the model sooner if policy shocks, such as large funding bills or emission norms, materially alter underlying drivers.
Why Mordor's Locomotive Market Baseline Inspires Decision-Maker Confidence
Published estimates vary because firms choose different inclusion rules, base-year price assumptions, and refresh cadences. Mordor restricts scope to first-sale vehicle revenues, applies country-specific ASP ladders, and revisits inputs annually, which keeps our baseline closely tethered to observable production and trade datapoints.
Key gap drivers versus external figures often stem from competitors bundling refurbishment contracts, spreading ASPs from high-speed units across all types, or rolling forward historical exchange rates without parity checks.
Benchmark comparison
| Market Size | Anonymized source | Primary gap driver |
|---|---|---|
| USD 6.63 B (2025) | Mordor Intelligence | - |
| USD 25.6 B (2025) | Regional Consultancy A | Includes maintenance and track electrics; unit ASPs averaged at fleet level |
| USD 13.8 B (2024) | Global Consultancy B | Uses historical exchange rates and groups shunting locomotives with railcars |
In sum, by isolating new-build traction units, triangulating volumes with customs and production logs, and stress-testing prices through both procurement insiders and financial disclosures, Mordor Intelligence offers a balanced baseline that users can trace back to clear, repeatable inputs.
Key Questions Answered in the Report
How large is the locomotive traction system market in 2025 and what is its expected CAGR?
The locomotive traction system market size reached USD 6.28 billion in 2025 and is projected to grow at a 4.01% CAGR to 2031.
Which propulsion technology is expanding the fastest?
Battery-electric locomotives are the fastest-growing segment with a 4.61% CAGR, driven by yard-switcher retrofits and emissions mandates.
What share do IGBT traction inverters hold, and who challenges them?
IGBT modules held 64.22% revenue in 2025, but silicon-carbide designs from Mitsubishi, Hitachi, and Siemens are scaling quickly.
Why is Asia-Pacific the largest regional market?
India’s 100% network electrification and China’s ongoing high-speed rail expansion push Asia-Pacific to 42.17% share and the highest regional CAGR at 4.45%.
Which companies dominate global locomotive manufacturing?
CRRC, Alstom, Siemens, and Wabtec hold the largest combined share.


