
Locomotive Market Size and Share
Market Overview
| Study Period | 2019 - 2031 |
|---|---|
| Market Size (2026) | USD 6.63 Billion |
| Market Size (2031) | USD 8.07 Billion |
| Growth Rate (2026 - 2031) | 4.01 % |
| Fastest Growing Market | Asia Pacific |
| Largest Market | Asia Pacific |
| Market Concentration | Medium |
Major Players *Disclaimer: Major Players sorted in no particular order Image © Mordor Intelligence. Reuse requires attribution under CC BY 4.0. | |
Locomotive Market Analysis by Mordor Intelligence
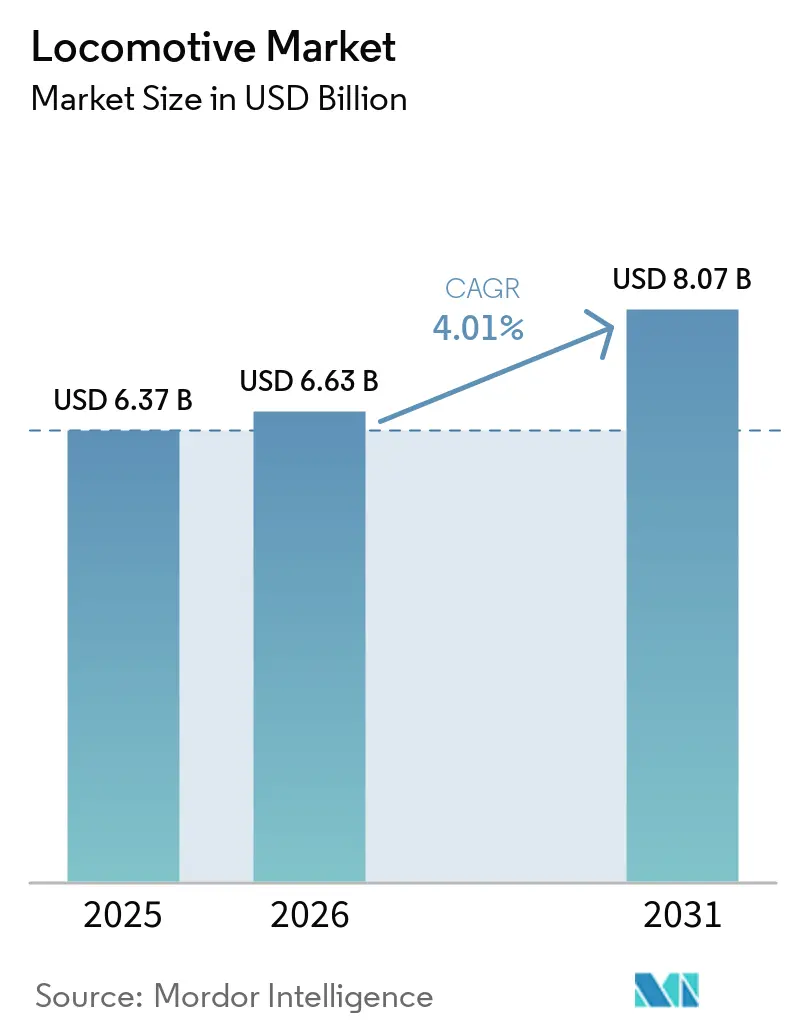
The locomotive market size is expected to grow from USD 6.37 billion in 2025 to USD 6.63 billion in 2026 and is forecast to reach USD 8.07 billion by 2031 at a 4.01% CAGR over 2026–2031. Rising freight ton-kilometers, national electrification programs, and efficiency gains from silicon-carbide power electronics are supporting the steady expansion of the locomotive traction system market. Diesel propulsion remains the backbone of global fleets, yet battery-electric pilots are gaining traction as operators seek fuel savings and compliance with emissions regulations. The Asia-Pacific region leads both in volume and growth, as India has completed network-wide electrification, while China channels export finance into Belt and Road corridors. Component innovation centers on high-efficiency inverters and large-format battery packs that promise lower life-cycle costs. Several multinational suppliers dominate the installed capacity, indicating a moderate level of competitive intensity. Meanwhile, regional specialists adeptly cater to niche markets, including retrofit and software.
Key Report Takeaways
- By propulsion type, diesel platforms held 76.13% share of the locomotive market in 2025, while battery-electric units represent the fastest segment with a 4.61% CAGR to 2031.
- By technology, IGBT modules led with 64.22% of locomotive market share in 2025; Silicon Carbide modules are projected to grow at a 4.75% CAGR through 2031.
- By component, traction motors accounted for 42.32% share of the locomotive market size in 2025 and battery packs are advancing at a 4.38% CAGR through 2031.
- By locomotive type, freight units captured 66.31% of locomotive market share in 2025; high-speed passenger locomotives are expanding at a 5.33% CAGR to 2031.
- By power rating, the 2,000–4,000 kW class commanded 46.57% share of the locomotive market size in 2025, whereas units above 4,000 kW are growing at a 4.12% CAGR.
- By geography, Asia-Pacific led the locomotive market with a 42.17% share in 2025 and is forecast to grow at a 4.45% CAGR through 2031.
Note: Market size and forecast figures in this report are generated using Mordor Intelligence’s proprietary estimation framework, updated with the latest available data and insights as of January 2026.
Market Trends and Insights
Drivers Impact Analysis of Locomotive Market*
| Driver | (~) % Impact on CAGR Forecast | Geographic Relevance | Impact Timeline |
|---|---|---|---|
| Rail Electrification and Infra Spend | +1.1% | Europe, India, China; spillover to Middle East and South America | Long term (≥4 years) |
| Global Rail Volume Growth | +0.8% | Global, with concentration in Asia-Pacific and North America | Medium term (2–4 years) |
| High-Efficiency Traction Tech | +0.6% | Global, led by Japan, Germany, United States | Short term (≤2 years) |
| Battery-Electric and Dual-Mode Retrofits | +0.5% | North America, Europe, Australia | Medium term (2–4 years) |
| Carbon Credit and ESG Financing | +0.4% | Europe, North America, select Asia-Pacific markets | Long term (≥4 years) |
| Predictive Maintenance Analytics | +0.3% | Global, early adoption in Europe and North America | Short term (≤2 years) |
| Source: Mordor Intelligence | |||
Government-Led Rail Electrification and Infrastructure Spend
Public spending has significantly increased, with India making a substantial commitment to support the complete electrification and deployment of Vande Bharat trainsets [1]“100% Broad-Gauge Electrification Achieved,”, Indian Railways, indianrailways.gov.in. The United States has allocated a considerable amount under its Infrastructure Investment and Jobs Act, with a portion designated explicitly for the Northeast Corridor, favoring electric or hydrogen traction. Europe’s TEN-T initiative aims to achieve a high level of electrification on its primary routes, necessitating the installation of extensive new catenary infrastructure. Payback periods are shorter when freight volumes reach higher thresholds, prompting main-line projects to adopt overhead power, while branch lines focus on batteries or hydrogen. China has expanded its influence by financing electrified export corridors, strategically bundling CRRC locomotives with infrastructure loans to Southeast Asia.
Growing Freight and Passenger Rail Volumes Worldwide
Global rail freight experienced significant growth, driven by supply-chain re-shoring that shifted cargo to land bridges and North American Class I networks [2]“Rail Traffic Highlights 2024,”, International Union of Railways, uic.org. Passenger traffic also rebounded strongly, nearing pre-pandemic levels, supported by increased demand in India's suburban areas and the expansion of high-speed services in China. Rising volumes are fueling procurement activities, with major freight operators placing substantial orders for locomotives to meet higher utilization thresholds. North American main lines, operating at high capacity, are replacing older fleets with advanced models that significantly reduce fuel consumption. Urban ridership spikes in cities such as Delhi, Mumbai, and Jakarta are driving additional orders for suburban EMUs, emphasizing the importance of maintaining a diversified traction portfolio.
Advancements in High-Efficiency Traction Electronics
Mitsubishi Electric introduced silicon-carbide inverters that significantly reduce switching losses and operate at higher junction temperatures, which also minimizes the required heat-sink volume [3]“3.3 kV SiC Traction Inverter,”, Mitsubishi Electric, mitsubishielectric.com. Hitachi Rail, utilizing advanced SiC MOSFET packages, achieved notable improvements in inverter efficiency. This development not only reduced the weight of the carbody but also created additional space for batteries. Although SiC modules are more expensive compared to IGBTs, high-usage applications can offset the extra cost over time through energy savings and reduced maintenance needs. Wabtec and Siemens are testing hybrid topologies that incorporate SiC in specific stages, capturing most of the efficiency benefits at a fraction of the cost of complete SiC systems. Regulatory changes in the European Union are expected to enforce higher efficiency standards for inverters, accelerating the shift away from older technologies.
Modular Battery-Electric and Dual-Mode Retrofit Solutions
Union Pacific, BNSF, and Norfolk Southern operate fifteen 7 MWh battery units that deliver a full day of yard switching with zero idling fuel burn. Progress Rail offers a kit designed to convert GP38 and SD40 switchers into battery-diesel hybrids, targeting a significant number of aging units in North America. Hitachi's battery-powered EMUs, after charging under catenary, can operate off-wire for extended distances. This feature enables operators to avoid substantial electrification costs on low-density branches. The economics are particularly favorable for high-idle cycles: a typical yard locomotive achieves notable annual fuel savings while also bypassing Tier 4 after-treatment expenses. Battery longevity depends on its chemistry; lithium-titanate batteries retain a higher capacity over more cycles compared to nickel-manganese-cobalt batteries, which limits the latter's suitability for heavy-haul applications in the locomotive market.
Restraints Impact Analysis of Locomotive Market*
| Restraint | (~) % Impact on CAGR Forecast | Geographic Relevance | Impact Timeline |
|---|---|---|---|
| High Upfront Costs | -0.8% | Global, particularly acute in emerging markets | Long term (≥4 years) |
| Tightening Emission Rules | -0.6% | North America, Europe, with expanding coverage | Medium term (2-4 years) |
| Limited Battery Supply Chain | -0.5% | Global, with bottlenecks in lithium processing | Short term (≤2 years) |
| Grid Capacity Bottlenecks | -0.4% | Europe, North America, with infrastructure lag | Long term (≥4 years) |
| Source: Mordor Intelligence | |||
High Upfront Procurement and Lifecycle Service Costs
Electric freight locomotives are significantly more expensive than Tier 4 diesel locomotives. Additionally, long-term service agreements further increase the overall cost over their operational lifespan. Battery-electric units require depot chargers, which involve substantial installation costs and can support multiple units. Tenders in emerging markets are often supported by sovereign guarantees, which can lead to delays in contract awards. Electric units also face higher residual-value risks due to concerns among secondary buyers about potential changes in grid standards and the obsolescence of inverters, which negatively impact resale prices. Smaller operators, unable to justify the investment in in-house maintenance facilities, often delay electrification despite the rising costs of fuel in the locomotive market.
Limited High-Power Battery Supply Chain for Heavy-Haul Use
Automotive demand has significantly absorbed battery-grade nickel, resulting in extended lead times for nickel-manganese-cobalt cathodes. Heavy-haul locomotives require large battery packs, which are considerably more expensive than automotive packs due to the need for ruggedization and long-term warranties. Current lithium-titanate anode production capacity is insufficient to meet the growing demand for locomotive packs. The validation process for these packs further extends production timelines, delaying deliveries and increasing the risk of penalties for customers. Additionally, North American Class I railroads operate far fewer charging depots than needed to support their planned battery fleets, requiring substantial investment in utility infrastructure upgrades in the locomotive market.
*Our forecasts treat driver/restraint impacts as directional, not additive. The impact forecasts reflect baseline growth, mix effects, and variable interactions.
Locomotive Market Segment Analysis
By Propulsion Type:
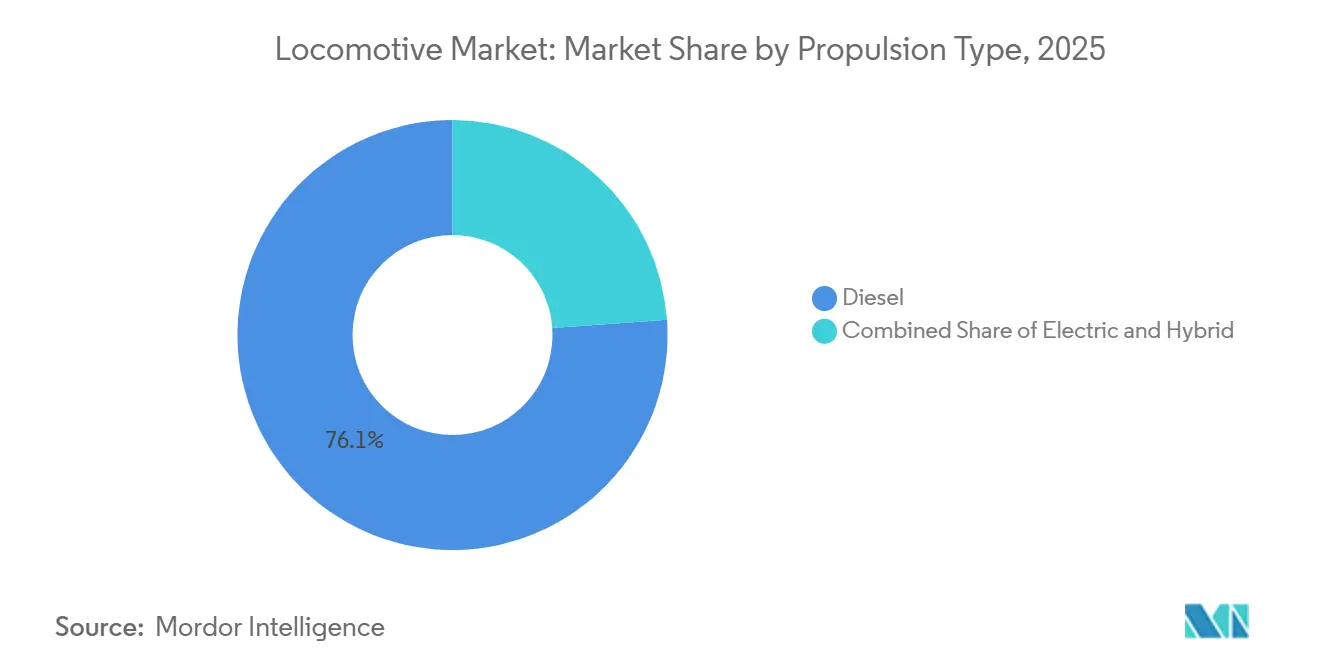
Diesel Dominance Yields to Battery MomentumDiesel propulsion captured 76.13% of the locomotive traction system market share in 2025, supported by an installed base of 120,000 diesel-electric units and partial network electrification. Battery-electric models grow at a 4.61% CAGR as 7 MWh retrofit kits strip idle fuel burn from yard duties and improve air quality. In Europe and North America, tighter EPA Tier 5 and Euro Stage VI regulations are significantly increasing the costs of new diesel units. As a result, government mandates and escalating diesel after-treatment expenses are reducing the appeal of diesel propulsion relative to electric overhead and hydrogen fuel-cell alternatives.
In India and China, the electrification of main lines supports a steady demand for 25 kV AC systems. Meanwhile, hybrid battery-catenary designs effectively address gaps in networks that are only partially wired. The market for battery-electric units in the locomotive traction system is expected to grow, driven by increasing retrofit activities within the North American switcher fleet. Additionally, hydrogen prototypes, like Alstom’s Coradia iLint, highlight the untapped potential for regional routes that currently lack overhead power.



By Technology:
SiC Modules Challenge IGBT IncumbencyIGBT modules accounted for 64.22% of the revenue in 2025, thanks to mature supply chains and lower pricing. Silicon-carbide modules, though costlier, expand at a 4.75% CAGR by delivering lower switching losses and lighter traction packages. As high-speed and heavy-haul operators prioritize life-cycle energy savings, the locomotive traction system market associated with SiC inverters is expected to experience significant growth in the coming years. Upcoming ecodesign efficiency thresholds are set to accelerate this substitution.
While gate-turn-off thyristors remain in legacy fleets, they're being phased out during mid-life overhauls. Hybrid IGBT–SiC topologies, developed by Siemens and Wabtec, achieve a substantial portion of the SiC efficiency gain at a fraction of the full-SiC cost, facilitating a smoother adoption. However, redesigning components for gate drivers and cooling demands considerable engineering time, underscoring the advantage of vertically integrated suppliers.
By Component:
Traction Motors Lead, Battery Packs SurgeTraction motors generated 42.32% of 2025 component revenue, fueled by replacement demand in North America and new orders linked to India’s tender. Battery packs are the fastest growing at a 4.38% CAGR because Class I railroads are retrofitting switchers to reduce idle fuel consumption. Despite ongoing supply chain constraints, the market for battery packs in locomotive traction systems is expected to grow significantly in the coming years.
Inverters constitute a notable portion of the bill of materials value. Additionally, silicon-carbide designs provide substantial energy savings in traction, benefiting both freight and high-speed applications. While transformers and rectifiers remain essential for overhead electric and dual-mode platforms, fuel-cell stacks, though currently minimal, are expanding rapidly, supported by European hydrogen initiatives.
By Locomotive Type:
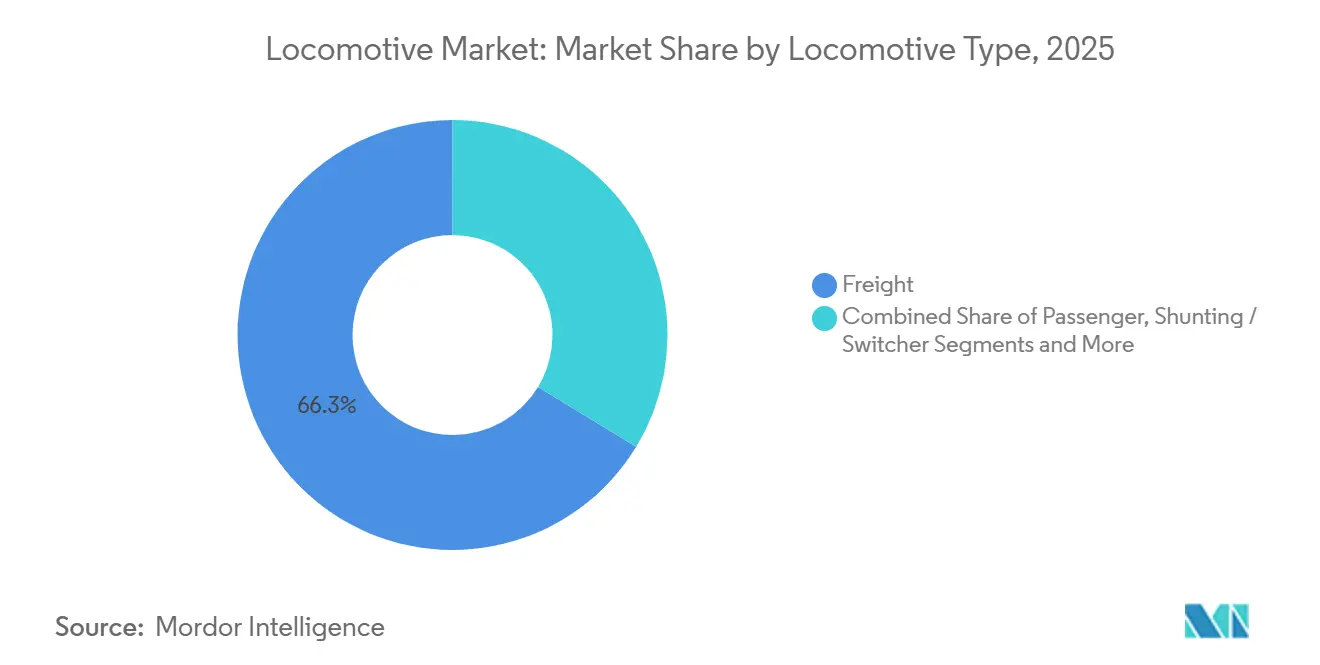
Freight Volume Drives, High-Speed AcceleratesFreight locomotives dominated deliveries, accounting for a 66.31% share in 2025. North American networks achieved a record density, reaching significant gross ton-miles for every route-mile. High-speed units post the quickest 5.33% CAGR as France, Spain, and Japan replace aging fleets with 9.2 MW next-generation trainsets. Passenger units for regional and intercity service remain stable at around 20%, as electrification is mature in Europe and Japan, but lags in North America.
Shunting locomotives, which are responsible for a significant portion of shipments, are now prime candidates for battery retrofits aimed at reducing idling emissions. As China continues to expand its high-speed rail network, the market share for high-speed locomotive traction systems is poised to increase, thereby bolstering demand for high-power traction packages.
By Power Rating:
Mid-Range Leadership Amid High-Power ExpansionUnits rated 2,000–4,000 kW accounted for 46.57% of 2025 sales, as they meet the needs of regional passenger and intermodal freight services. Platforms above 4,000 kW will outpace other bands at a 4.12% CAGR as Australian iron-ore and North American coal routes demand 6-axle locomotives that pull 15,000-ton trains.
Below-2,000 kW classes cover switching and industrial niches where capital discipline matters more than raw tractive effort. Battery limitations cap heavy-haul battery prototypes at 4,500 kW because a 10 MWh pack weighs up to 50 tons, equal to the space of 8,000 liters of diesel fuel.
Geography Analysis
APAC Locomotive Market
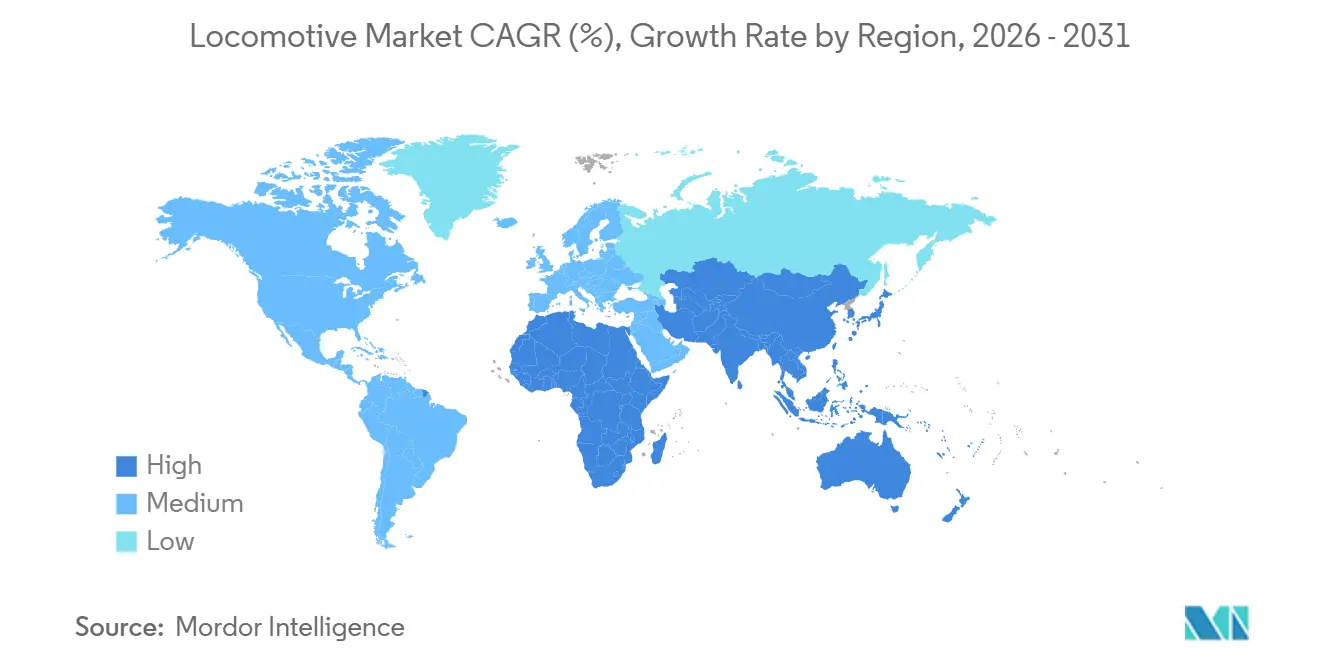
Asia-Pacific generated 42.17% of global revenue in 2025 and is expected to compound at 4.45% through 2031, supported by India’s 100% broad-gauge electrification and China’s Belt and Road export financing. India has allocated significant funding for dedicated freight corridors, aiming to enhance its rail infrastructure. China has expanded its high-speed rail network, driving regional demand for advanced power packages. Australia is advancing its iron-ore operations, and Japan is upgrading its Shinkansen services, contributing to overall growth. Local content rules in India, Indonesia, and South Korea are extending procurement timelines but are also strengthening domestic manufacturing capabilities.
Europe Locomotive Market
Europe holds a substantial share of the market revenue. A major initiative is targeting the development of extensive new catenary lines. Germany has made significant investments in fleet upgrades. France has placed orders for new high-speed train sets, and Italy is transitioning to hydrogen-powered units to replace diesel on non-electrified routes. Electrification delays in the UK are driving demand for bi-mode and battery-powered units. Sanctions on Russia are shifting its production focus to meet domestic requirements.
North America Locomotive Market
North America represents a notable portion of market spending. A central infrastructure act is channeling funding into rail projects, prioritizing electric and hydrogen solutions for key corridors. Class I operators are managing a large fleet of predominantly diesel locomotives but are testing battery hybrids to comply with upcoming environmental regulations. Canada is exploring hydrogen-powered intercity services, while Mexico is gradually upgrading its freight rail systems.
South America and MEA Locomotive Market
South America, along with the Middle East and Africa, contributes a smaller share of the market revenue. Brazil has placed orders for electric locomotives. Saudi Arabia is considering expanding its high-speed rail network. Egypt and Turkey are making gradual improvements to their rail systems, though financial challenges often cause delays.

Regulatory Landscape
Locomotive OEMs work within a fragmented compliance environment where emissions, safety, and interoperability rules are primarily set by rail regulators and standards bodies. At the same time, adjacent road-vehicle requirements are increasingly shaping electrification, battery safety, and hydrogen-handling expectations for components that can carry over into rail traction systems. Internationally, UNECE hosts the World Forum for Harmonization of Vehicle Regulations (WP.29), which in its 199th session (23 to 26 June 2026) adopted proposals for new UN regulations covering areas such as automated driving systems and liquid hydrogen vehicles, indicating continued momentum toward technical alignment that can spill over into rail equipment requirements for hydrogen and digital systems.
In major end markets, compliance planning also reflects evolving safety frameworks for electric and hydrogen systems, including updates to test and reporting requirements on defined schedules. In the United States, NHTSA published a final rule on June 3, 2026, amending FMVSS No. 214, FMVSS No. 305a (Electric-Powered Vehicles), and FMVSS No. 307 (Fuel System Integrity of Hydrogen Vehicles), effective July 6, 2026, and another NHTSA final rule on May 18, 2026 adjusted the Event Data Recorder phase-in schedule beginning September 1, 2028. In Europe, EU-level safety requirements tightened in July 2026 under the General Safety Regulation for newly registered vehicles, pushing suppliers of sensors, power electronics, and hydrogen-related hardware to design to higher baseline safety performance across mobility platforms.
Value Chain Analysis
The locomotive value chain begins with upstream raw materials and energy-intensive inputs (steel, copper, aluminum, and specialized alloys), then moves into critical electronics and electro-mechanical subsystems. These include traction motors, inverters (IGBT and SiC), transformers and rectifiers for overhead platforms, braking systems, and increasingly large-format battery packs and fuel-cell stacks for alternative propulsion. OEM integrators such as CRRC, Alstom, Siemens, and Wabtec assemble complete locomotives and validate systems through long qualification and certification cycles before delivering to railway operators and leasing companies. Downstream, depots and service partners carry out commissioning and warranty support, with availability-oriented service networks acting as a key differentiator in procurement.
Bottlenecks tend to cluster around long qualification lead times and constrained supply of power electronics and battery materials, which can extend delivery schedules and raise inventory costs for OEMs and Tier suppliers. Localization mandates are also reshaping sourcing and manufacturing footprints. India has emphasized high local-content assembly for new high-power electric locomotives, while Kazakhstan has used long-term procurement linked to local capability building to secure supply and service support. Recent supply-chain activity illustrates these dynamics, including Wabtec securing a USD 157 million braking systems contract tied to Siemens 9,000 HP locomotives for Indian Railways (January 2024) and Wabtec signing a USD 4.2 billion supply and service contract with Kazakhstan’s KTZ for 300 TE33AT freight locomotives (September 2025), both showing how component depth, service coverage, and regional presence influence large fleet awards.
Competitive Landscape
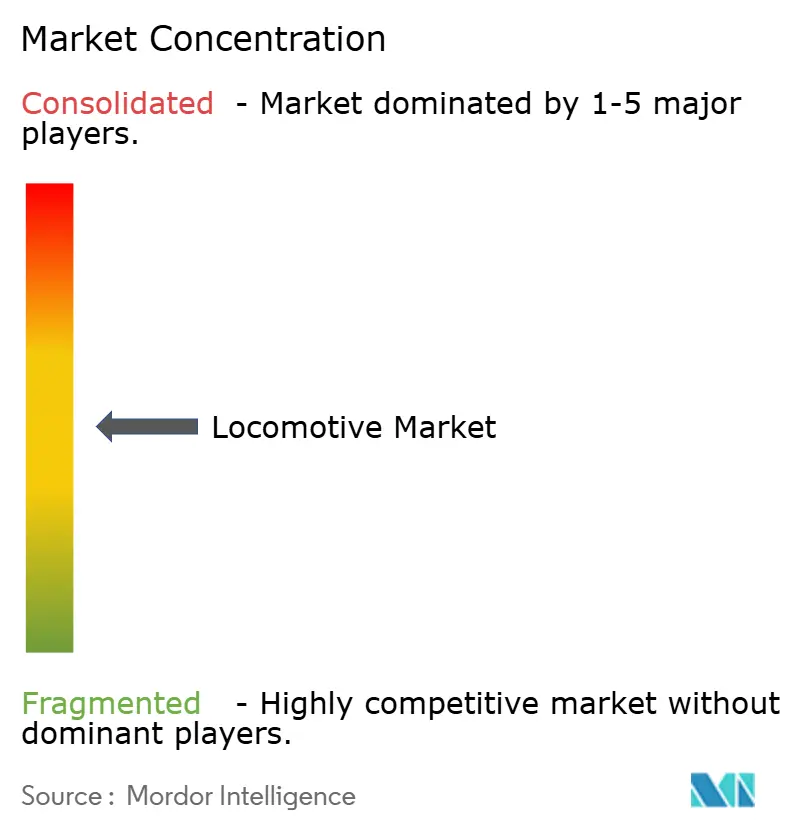
CRRC, Alstom, Siemens, and Wabtec collectively account for a significant portion of the global locomotive traction system market, indicating a moderate concentration. National procurement rules are reshaping sourcing dynamics: India’s Production-Linked Incentive mandates a high percentage of local content, while the U.S. prioritizes domestic assembly for Amtrak rebuilds. Alstom and Siemens, by keeping traction motors and inverters in-house, protect their gross margins. In contrast, Wabtec, which relies on external power electronics, derives a substantial share of its segment profit from aftermarket services.
Strategic moves are focusing on white-space technologies. Alstom’s Coradia iLint has achieved notable commercial success, and Stadler has secured multiple hydrogen orders across various European countries. Battery switchers address a retrofit market with significant potential in North America. New players, such as Ballard, which provides fuel-cell modules, and innovators in high-density batteries for rail, are gaining traction. Digital twin solutions, such as Siemens Railigent, are equipping numerous units globally, reducing unplanned downtime and generating subscription revenue independent of new builds.
Locomotive Industry Leaders
Alstom SA
Siemens AG
Hyundai Rotem
CRRC Corporation Limited
Wabtec Corporation
- *Disclaimer: Major Players sorted in no particular order
Locomotive Market Companies Covered in this Report
- CRRC Corporation Limited
- Alstom SA
- Siemens AG
- Wabtec Corporation
- Hyundai Rotem
- Kawasaki Heavy Industries Ltd.
- Stadler Rail AG
- Hitachi Rail Ltd.
- Progress Rail (Caterpillar Inc.)
- Toshiba Corporation
- CAF S.A.
- Vossloh Locomotives
- Bombardier Transportation (Alstom)
- Mitsubishi Heavy Industries Ltd.
- Bharat Heavy Electricals Ltd.
- Sinara Transport Machines (Ural Locomotives)
- Titagarh Rail Systems Ltd.

Market Opportunities and Future Outlook
Decarbonization pathways are creating whitespace around modular retrofits and dual-mode platforms that reduce exposure to incomplete electrification and the economics of tightening diesel compliance costs. Battery and hybrid retrofits target high-idle duty cycles where operators can capture measurable fuel and emissions reductions without full network wiring, aligning with the report’s observed momentum in yard and switcher applications. Hydrogen is also moving beyond smaller pilots toward higher-power use cases through named programs and contracts, including a January 2026 contract awarded to Advance Rail Controls (Concord Control Systems) to develop a 3,100 HP hydrogen-fueled locomotive for NTPC Limited. In parallel, Vanguard Sustainable Transport Solutions launched the HydroShunter in February 2026 for hydrogen-powered shunting.
On the supply side, manufacturing scale-up and digitalization investments support opportunities in multi-system electric locomotives, cross-border freight corridors, and data-driven fleet availability solutions. Siemens Mobility’s Munchen-Allach facility expansion, completed in July 2025, increased annual capacity to 385 Vectron locomotives and reflects OEM emphasis on throughput for standardized platforms. India’s commissioning of a dedicated high-horsepower electric locomotive factory at Dahod (D Nine) further anchors demand for local traction motors, inverters, and auxiliary systems tied to electrification programs. Together, these moves point to near-term opportunities for suppliers focused on high-efficiency power electronics (including SiC adoption), battery pack ruggedization and depot charging infrastructure, and service-network buildout along strategic routes such as the Middle Corridor, where availability and lifecycle support influence total procurement outcomes.
Recent Industry Developments in Locomotive Market
- June 2026: Siemens Mobility launched Vectron X, positioning new Vectron locomotives around a built-in digital ecosystem for onboard data collection and predictive maintenance. The move embeds software-defined capability into the base platform, strengthening differentiation beyond hardware and supporting fleet-availability focused procurement.
- May 2026: Siemens Mobility reported the start of commercial operations for Indian Railways 9,000 HP electric freight locomotives and opened the first of four planned maintenance depots in Visakhapatnam. Bringing both locomotives and depot capacity online tightens the delivery-to-uptime loop and reinforces local support as a procurement lever in large electrification-linked fleets.
- December 2024: Alstom signed contracts to supply 40 Traxx Universal multi-system electric locomotives (with options for 20 more) to Ontrain sp. z o.o. for operations in Poland. The order underscores demand for interoperable, cross-border electric traction and supports a shift toward standardized multi-system platforms in European freight leasing and operations.


Locomotive Market Report Scope and Research Methodology
Market Definition and Coverage
For this methodology, the locomotive market is defined as revenues earned from the first sale of newly manufactured locomotives that provide traction for passenger and freight trains, valued at the factory gate in USD.
Scope exclusions: Refurbishment, mid-life overhauls, and maintenance service revenues are excluded.
Segments Covered in This Report
- By Propulsion Type
- Diesel
- Electric (Overhead)
- Hybrid
- By Technology
- IGBT Module
- GTO Thyristor
- SiC Module
- MOSFET Module
- By Component
- Traction Motor
- Inverter
- Rectifier
- Alternator
- Transformer
- Battery Pack
- Fuel Cell Stack
- By Locomotive Type
- Freight
- Passenger
- Shunting / Switcher
- High-Speed
- By Power Rating (kW)
- Below 2,000 kW
- 2,000 to 4,000 kW
- Above 4,000 kW
- By Geography
- North America
- United States
- Canada
- Rest of North America
- South America
- Brazil
- Argentina
- Rest of South America
- Europe
- Germany
- United Kingdom
- France
- Italy
- Russia
- Rest of Europe
- Asia-Pacific
- China
- India
- Japan
- South Korea
- Australia
- Rest of Asia-Pacific
- Middle East and Africa
- Saudi Arabia
- United Arab Emirates
- Egypt
- Turkey
- South Africa
- Rest of Middle East and Africa
- North America
Data Sources, Market Sizing, and Validation
Desk Research
To build the base structure of the market, we start with public rail transport and industrial statistics, then align them to locomotive procurement cycles. Useful reference points come from sources such as the International Energy Agency (rail energy and electrification context), the World Bank and OECD (macro indicators tied to infrastructure spend), and UN Comtrade (trade flows for relevant rail equipment categories).
We also review railway policy and fleet renewal signals from official transport ministries and rail regulators, along with content from industry bodies such as the International Union of Railways (UIC). These are supported with company filings, investor presentations, and reputable press coverage of tender awards and delivery schedules, which helps us time demand into the right years. Where needed, paid subscriptions for company financials and intelligence, news and financials, and shipment-level trade visibility are used to cross-check totals and reduce obvious gaps. The desk sources mentioned are illustrative, and many additional references are used during data collection, validation, and clarification.
Primary Interviews and Surveys
Primary work is used to confirm what the desk sources cannot show clearly, especially the split between new-build deliveries and upgrade work, and the pricing logic by propulsion type. We speak with a mix of locomotive OEM and component-side experts, rail operator and leasing stakeholders, and procurement or project teams linked to major fleet programs across APAC, EMEA, and the Americas.
Distribution of primary research fieldwork respondents
| Company type | Respondent position | Region |
|---|---|---|
| Top tier: 34% | CXOs: 18% | APAC: 46% |
| Mid tier: 45% | Functional/Unit leaders: 39% | EMEA: 35% |
| Smaller Players: 21% | Managers: 43% | Americas: 19% |
Market-Sizing & Forecasting
Our sizing starts from a top-down build that reconstructs annual locomotive demand using fleet replacement timing, funded procurement pipelines, and delivery schedules, then converts the unit view into value using region-specific average selling price ladders. Where that initial view looks stretched, we corroborate it with selective bottom-up checks such as sampled unit deliveries by country and propulsion type, and then sampled ASP times volume to tighten the totals.
Key inputs used in the model include new locomotive delivery volumes (units), fleet age and retirement patterns, share of electrified rail corridors, tender award timing, and the mix shift between diesel-electric, pure electric, and emerging battery or hydrogen platforms. Pricing is kept practical by using ex-works unit values and adjusting for configuration differences that were validated in interviews, rather than assuming a single global ASP. For forecasting, we mainly use scenario analysis because order intake can swing with public budgets, electrification mandates, and freight versus passenger investment priorities, and these drivers are best expressed as a set of consistent scenarios agreed with industry participants. When gaps exist in country-level delivery visibility, we fill them through regional allocation keys based on confirmed procurement programs and import or export signals, and then recheck with expert feedback.
Data Validation & Update Cycle
Before results are finalized, totals are checked against independent signals like announced tender values, delivery backlogs, and observable trade and manufacturing momentum, and then variances are investigated. If an outlier is found, we revisit assumptions such as ASP progression, propulsion mix, or the timing of large contracts, and then rerun the model.
A multi-step review is followed where one analyst rebuilds key calculations and another reviews the logic behind the drivers and the geography splits. Reports are refreshed annually, with interim updates triggered by material events such as major multi-country orders, policy shifts on diesel bans, or sharp currency movement. Before delivery, a fresh pass is completed so clients receive the most recently updated view.
Mordor Intelligence's Locomotive Market Size Versus Other Published Estimates
Published locomotive market numbers often differ because some studies count different revenue pools and they also time big orders differently across years. Differences in whether only new-build sales are counted, how propulsion mix is handled, and how currency conversion is treated usually explain most of the spread.
By tracking country-level new-build deliveries and refreshing ex-works ASP ladders, Mordor Intelligence keeps the total tied to first-sale locomotive value instead of bundling in services, railcars, or broader rolling stock revenues. Gaps also come from base-year choice, because a delivery-heavy year can inflate the start point, and from whether aggressive electrification assumptions are used without a practical check against funded tenders and realistic build capacity.
Benchmark comparison
| Source | Market Size | Gaps in Research Methodology |
|---|---|---|
| Mordor Intelligence | USD 6.63 B (2026) | |
| Newswire Summary A | USD 15.45 B (2022) | Uses an earlier base year and appears to include a wider technology and component value pool, which can drift toward a broader rail equipment framing rather than factory-gate new-build locomotive sales. |
| Syndicated Publisher B | USD 24.30 B (2025) | Counts locomotives together with wider rolling stock sales, which expands the numerator beyond locomotives and typically lifts the market size versus a strict locomotive-only scope. |
The table shows that the largest gaps are created by scope boundaries and by how sales are grouped, especially when rolling stock is combined with locomotives or when non-vehicle value is implicitly counted. When the market is kept to new-build locomotive first-sale value and tied back to delivery and pricing checks, the estimate becomes easier to trace and repeat year to year.


Key Questions Answered in the Report
How large is the locomotive traction system market in 2026 and what is its expected CAGR?
The locomotive traction system market size reached USD 6.63 billion in 2026 and is projected to grow at a 4.01% CAGR through 2031.
Which propulsion technology is expanding the fastest?
Battery-electric locomotives are the fastest-growing segment with a 4.61% CAGR, driven by yard-switcher retrofits and emissions mandates.
What share do IGBT traction inverters hold, and who challenges them?
IGBT modules held 64.22% revenue in 2025, but silicon-carbide designs from Mitsubishi, Hitachi, and Siemens are scaling quickly.
Why is Asia-Pacific the largest regional market?
India’s 100% network electrification and China’s ongoing high-speed rail expansion push Asia-Pacific to 42.17% share and the highest regional CAGR at 4.45%.
Which companies dominate global locomotive manufacturing?
CRRC, Alstom, Siemens, and Wabtec hold the largest combined share.
Page last updated on:


 Your data is secure and never sold or shared.


