Liquid Crystal Display (LCD) Market Size and Share
Market Overview
| Study Period | 2020 - 2031 |
|---|---|
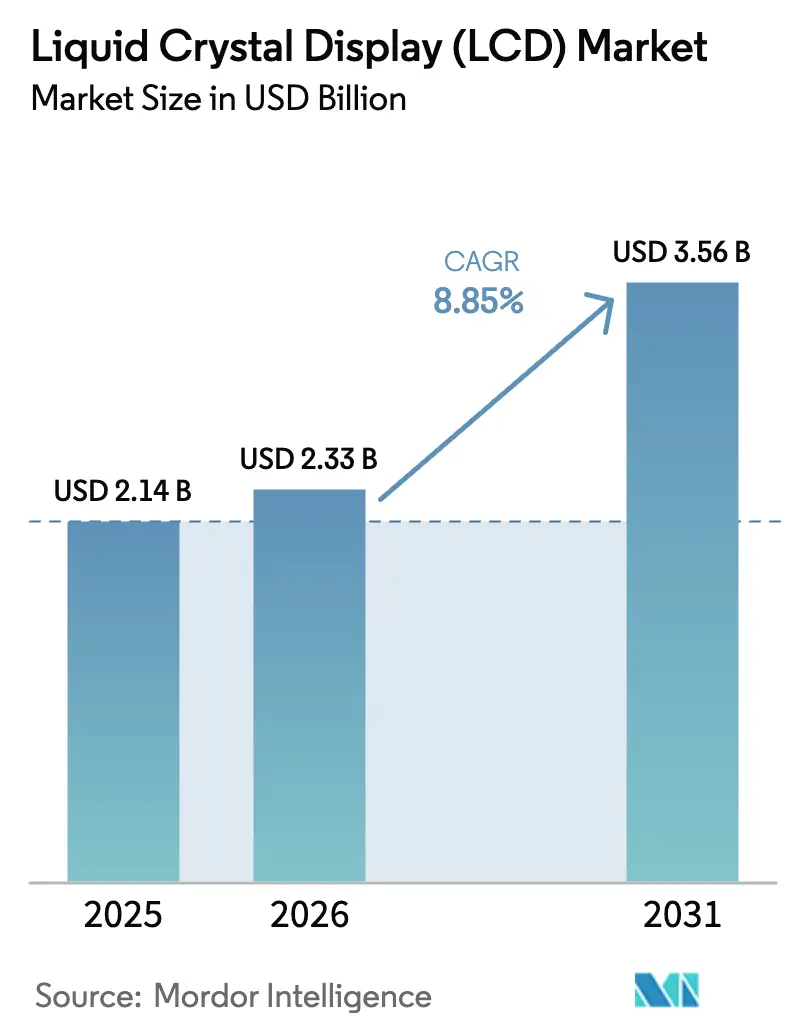
| Market Size (2026) | USD 2.33 Billion |
| Market Size (2031) | USD 3.56 Billion |
| Growth Rate (2026 - 2031) | 8.85% CAGR |
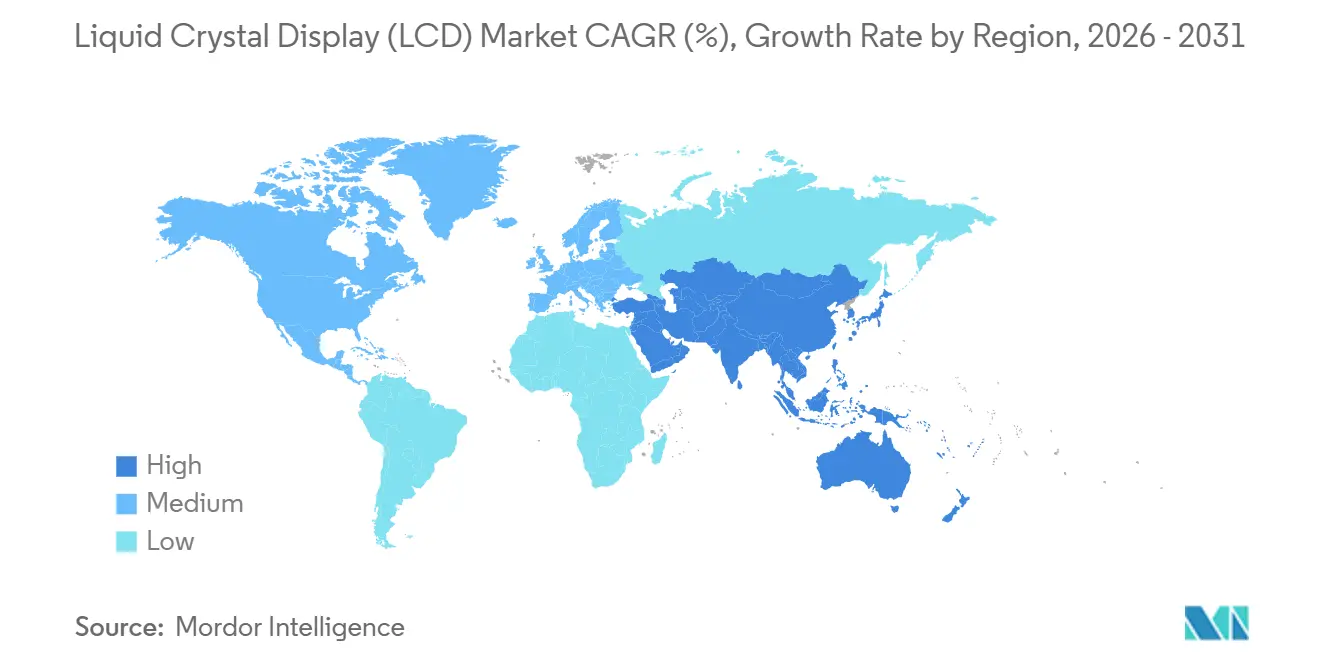
| Fastest Growing Market | Middle East and Africa |
| Largest Market | Asia Pacific |
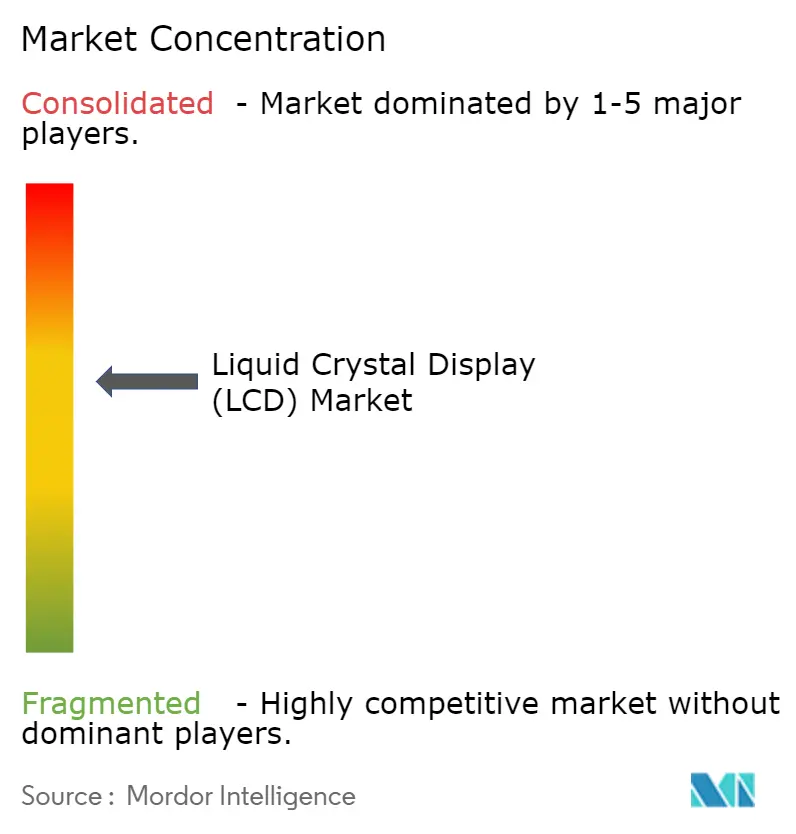
| Market Concentration | Medium |
Major Players
*Disclaimer: Major Players sorted in no particular order Image © Mordor Intelligence. Reuse requires attribution under CC BY 4.0. |
|
Liquid Crystal Display (LCD) Market Analysis by Mordor Intelligence
The liquid crystal display market size was valued at USD 2.14 billion in 2025 and estimated to grow from USD 2.33 billion in 2026 to reach USD 3.56 billion by 2031, at a CAGR of 8.85% during the forecast period (2026-2031). Scale advantages enjoyed by Chinese panel makers, rising demand for high-refresh-rate gaming monitors, and rapid automotive digitization underpin this expansion. Mainland China alone now controls more than 70% of global LCD production capacity, an ascent fueled by state subsidies and acquisitions such as CSOT’s 2025 purchase of LG Display’s Guangzhou plant. Mini-LED backlighting is extending LCD relevance in premium segments where OLED once held a cost-performance edge. Meanwhile, average selling price declines of 5-6% at Korean incumbents are broadening price bands and stimulating adoption in cost-sensitive regions.[1]Park So-ra, Yoon Yeon-hae, “Samsung, LG's Average Selling Prices Go Down in Q1,” Pulse by Maeil Business News Korea, pulse.mk.co.krAutomotive dashboards, head-up displays, and large public information screens are emerging as the fastest-growing end uses, keeping the liquid crystal display market on a stable expansion path through 2030.
Key Report Takeaways
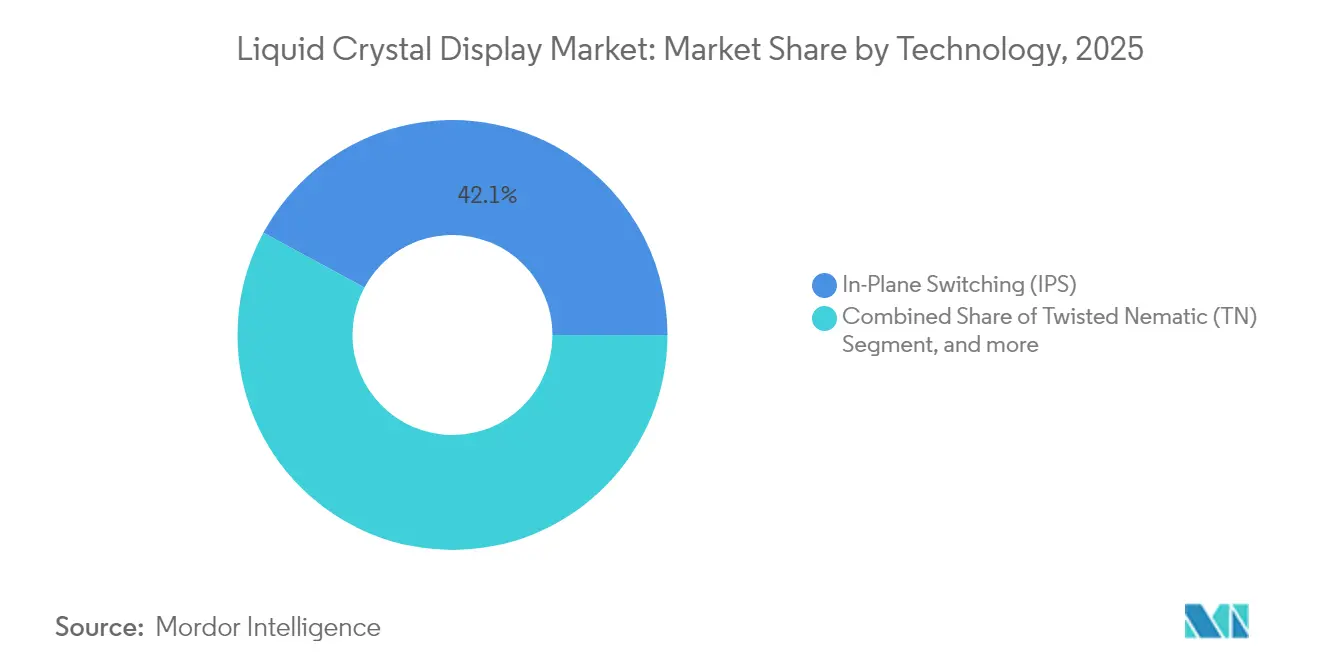
- By technology, IPS panels led with 42.12% revenue share in 2025, while Mini-LED-backlit IPS is forecast to expand at a 10.24% CAGR to 2031.
- By panel size, displays ≥ 50 inches commanded 31.12% of the liquid crystal display market share in 2025 and are advancing at a 9.57% CAGR through 2031.
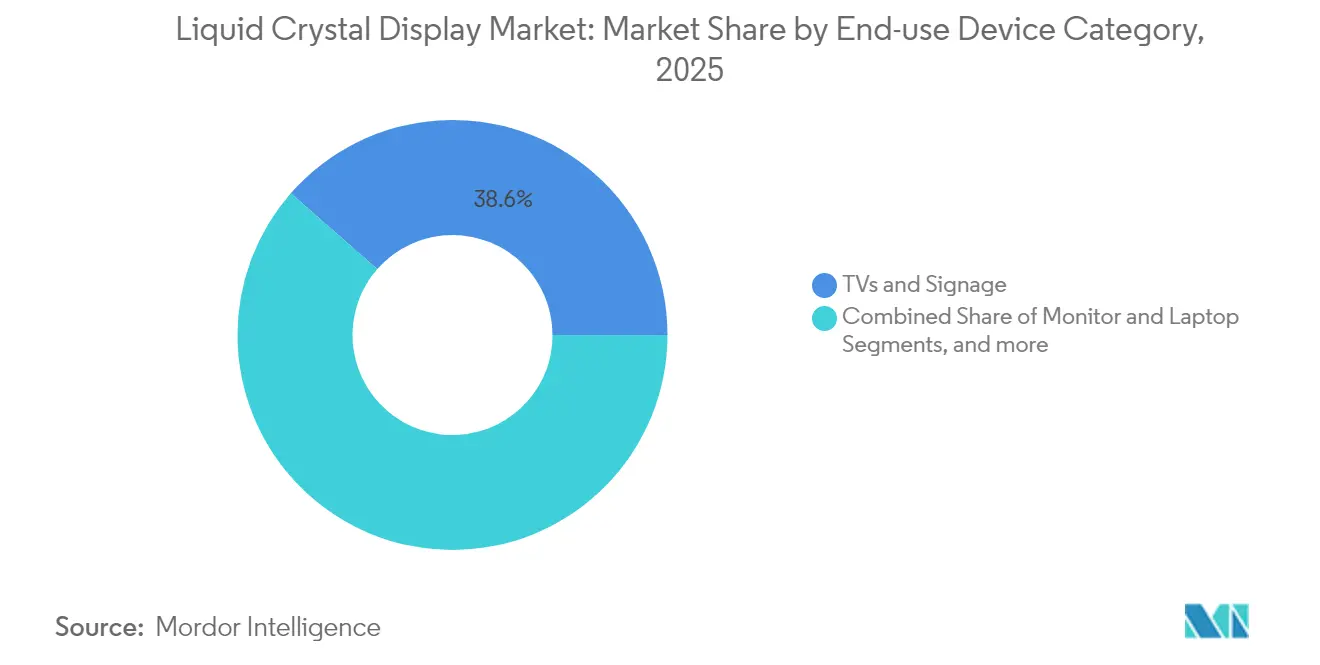
- By end-use device category, TVs & signage captured 38.55% share in 2025; automotive and industrial displays are projected to grow at 11.55% CAGR between 2026-2031.
- By application, consumer goods accounted for 33.86% of the liquid crystal display market size in 2025, while automotive applications are rising at 12.35% CAGR to 2031.
- By geography, Asia-Pacific held 46.62% revenue share in 2025; the Middle East & Africa region is forecast to record a 9.63% CAGR through 2031.
Note: Market size and forecast figures in this report are generated using Mordor Intelligence’s proprietary estimation framework, updated with the latest available data and insights as of 2026.
Global Liquid Crystal Display (LCD) Market Trends and Insights
Drivers Impact Analysis*
| Driver | (≈) % Impact on CAGR Forecast | Geographic Relevance | Impact Timeline |
|---|---|---|---|
| Surging demand for high-refresh-rate mobile gaming displays | +1.8% | Global-APAC and North America focus | Short term (≤ 2 years) |
| Shift toward e-mobility dashboards and HUDs | +2.1% | North America and Europe lead | Medium term (2-4 years) |
| Growth in large-format public information displays | +1.4% | Early adoption in developed markets | Medium term (2-4 years) |
| Rapid capacity expansion by Chinese panel fabs | +1.9% | APAC core, global supply impact | Long term (≥ 4 years) |
| Declining ASPs widening addressable price bands | +1.2% | Global | Short term (≤ 2 years) |
| Mini-LED backlighting boosting premium LCD longevity | +0.5% | North America, Europe, premium APAC | Long term (≥ 4 years) |
| Source: Mordor Intelligence | |||
Surging Demand for High-Refresh-Rate Mobile Gaming Displays
Manufacturers reached new refresh-rate milestones in 2024 when AU Optronics unveiled the first 360 Hz gaming notebook panel and multiple 240 Hz desktop monitors.[2]AU Optronics Corporation, “2023 Annual Report,” auo.com Esports professionals and enthusiasts prioritize motion clarity over absolute contrast, giving LCD an economic advantage against OLED for ultra-high-refresh segments. Samsung Display expects muted growth in mobile OLED shipments but a rebound in gaming monitors, reinforcing a demand tailwind for the liquid crystal display market. Rising casual-gaming engagement in Southeast Asia and North America is widening the installed base of high-spec monitors. Component suppliers have responded with faster driver ICs and improved thin-film transistor backplanes to sustain frame rates with minimal ghosting. Collectively, these factors add a 1.8% uplift to forecast CAGR over the next two years.
Shift Toward E-Mobility Dashboards and HUDs
Electrification reshapes cockpit electronics by elevating the need for larger, power-efficient displays. Direct-backlight LCDs with local dimming consume less power than comparable OLED units, satisfying the efficiency targets of leading European and North American automakers.[3]Stacy Wu, “The Future of Automotive Displays,” SID-Wiley Online Library, sid.onlinelibrary.wiley.com The automotive center-stack display market is expected to grow with display emerging as prominent premium feature sought out by the buyers, with LCD retaining a sizeable position in new programs. As head-up displays displace conventional clusters, specialized LCD suppliers are partnering with Tier-1s to deliver temperature-robust, high-brightness modules. AU Optronics’ mobility division surpassed NTD 43 billion revenue in 2025, underscoring commercial momentum. This vector contributes roughly 2.1% to overall CAGR during the medium term.
Growth in Large-Format Public Information Displays
Retailers, transit hubs, and enterprises are scaling digital-signage networks, driving demand for 65-inch-plus LCDs. Chinese panel makers optimized 8.5/10.5G fabs for large panels, and subsidies for energy-efficient appliances in China increased domestic pull-through. Supply constraints for super-large glass substrates are allowing panel makers such as BOE and Huaxing Optoelectronics to exercise selective pricing, raising profitability even amid volume plateauing. For end users, LCD retains a cost advantage over OLED at these diagonals, supporting a 1.4% boost to market CAGR over the next four years. Integrators in Europe and North America are layering real-time analytics and remote-management software, expanding total solution value.
Rapid Capacity Expansion by Chinese Panel Fabs
Government incentives exceeding USD 3.9 billion propelled Chinese manufacturers to 72% global output share in 2024.[4]Stephen Ezell, “How Innovative Is China in the Display Industry?” Information Technology and Innovation Foundation, itif.org TCL Huaxing’s T9 fab reached 180 000 sheets per month in Guangzhou and targets 95% yields by end-2025. Massive scale enables low break-even pricing that foreign rivals struggle to match, stimulating worldwide demand yet suppressing margins. Supply assurance from these mega-fabs also encourages TV and monitor brands to launch larger models, catalyzing unit growth. Over the long term, this factor raises projected CAGR by 1.9%.
Restraints Impact Analysis*
| Restraint | (≈) % Impact on CAGR Forecast | Geographic Relevance | Impact Timeline |
|---|---|---|---|
| OLED price erosion closing cost gap | -1.6% | Global, premium segments | Medium term (2-4 years) |
| Rising ESG pressure on fluorinated liquid-crystal chemistries | -0.8% | Europe and North America lead | Long term (≥ 4 years) |
| Geopolitical supply-chain risks for polarizer films | -0.7% | Global, concentrated APAC production | Short term (≤ 2 years) |
| Micro-LED pilot lines attracting cap-ex formerly bound for LCD | -0.4% | North America, Europe, APAC | Long term (≥ 4 years) |
| Source: Mordor Intelligence | |||
OLED Price Erosion Closing Cost Gap
High-volume OLED investments are compressing the historic price delta versus LCD. AMOLED TV revenues are set to reach USD 7.5 billion by 2025 with panel market share approaching 21%. BOE captured 53.9% of small-to-medium OLED shipments in early 2024, signalling Chinese capability gains. As yields improve, premium laptop and smartphone brands are migrating to OLED, reducing LCD’s penetration in high-margin tiers. Mini-LED upgrades partly buffer this threat, yet long-term pressure cuts 1.6 points from forecast CAGR.
Rising ESG Pressure on Fluorinated Liquid-Crystal Chemistries
European and North American regulators are scrutinizing fluorinated compounds used in liquid-crystal formulations, prompting material substitution R&D and additional compliance costs. Epson’s 2024 Sustainability Report targets net-zero emissions by 2050, emblematic of broader supplier commitments. EU foresight studies also flagged raw-material supply vulnerabilities, increasing risk premiums for specialty chemicals. Transition timelines extend beyond 2027, but rising compliance expenses shave 0.8 points from long-run growth.
*Our forecasts treat driver/restraint impacts as directional, not additive. The impact forecasts reflect baseline growth, mix effects, and variable interactions.
Segment Analysis
By Technology: IPS Resilience Meets Mini-LED Momentum
The segment generated USD 0.9 billion in 2025, equivalent to 42.12% of the liquid crystal display market share. Mini-LED-backlit IPS variants are on track for a 10.24% CAGR, the fastest within the technology mix. IPS offers wide viewing angles and accurate color reproduction sought by creative professionals and high-end consumer monitors. VA technology fills mid-tier TVs and gaming monitors where deep blacks matter more than off-axis performance. Niche AFFS panels cater to industrial and ruggedized systems that need extended temperature ranges. Second-generation Mini-LED arrays from Samsung and Hisense introduce finer dimming zones and lower thickness, allowing IPS panels to approximate OLED contrast at a lower cost.
Over 2026-2031, manufacturers will integrate low-power drive schemes and more efficient color filters to lift brightness without sacrificing lifespan. Apple’s planned second-generation Studio Display underscores sustained demand for premium LCDs with Mini-LED backlights. TN panels will continue to decline due to limited viewing comfort, although they retain a foothold in sub-USD 150 office monitors. The liquid crystal display market size for Mini-LED IPS is expected to surpass USD 1.61 billion by 2031, accounting for a growing slice of the overall pool.


By Panel Size: Large Formats Command Momentum
Displays ≥ 50 inches produced 31.12% revenue share in 2025, equating to USD 0.67 billion of the liquid crystal display market size, and are forecast to expand at a 9.57% CAGR through 2031. Rising living-room screen sizes and commercial signage deployments underpin this trajectory. Chinese fabs optimized G10.5 lines to maximize cut efficiency for 65-inch and 75-inch panels, improving cost competitiveness relative to smaller cuts. The 30-49.9 inch bracket remains stable in desktop and mid-size TV applications, while the 10-29.9 inch range serves laptops and specialty industrial equipment.
Supply constraints for super-large glass have allowed panel makers to prioritize margins over volume. Some Chinese firms are reallocating capacity from <30-inch tablets to larger TV glass, capitalizing on higher ASPs. Conversely, sub-10-inch demand is increasingly ceded to OLED within premium smartphones, but low-end phones and IoT devices still employ a-Si LCD to contain costs. Aggregate output mix shifts toward super-large panels will keep area shipments rising even if unit volumes flatten.
By End-Use Device Category: Automotive and Industrial Upswing
The largest slice in 2025 belonged to TVs and signage at 38.55% of revenue; however, automotive and industrial displays are set to grow 11.55% annually to 2031. Automotive cockpit real estate increases as EV makers integrate digital dashboards, head-up displays, and rear-seat entertainment. Industrial users are upgrading HMIs for factory automation, favoring LCD for durability and cost versus OLED. Gaming monitors within the PC sub-segment also sustain high refresh-rate demand.
Manufacturers are tailoring optical bonding and surface-treatment processes to meet automotive temperature and vibration standards. In industrial contexts, sunlight-readable and extended-lifetime panels are rising in share. The liquid crystal display market benefits from diversified demand vectors that cushion cyclic swings in TV replacements.
By Application: Consumer Goods Dominance Faces Automotive Surge
Consumer goods applications held 33.86% of the liquid crystal display market size in 2025, driven by sustained TV, smartphone, and tablet demand despite price competition from OLED-equipped flagships. TVs and signage together accounted for 38.55% of overall LCD revenue, reinforcing the retail and home-entertainment pull that underlies baseline panel volumes. Industrial equipment followed as a stable mid-tier contributor thanks to LCD’s durability in factory automation and outdoor kiosks. Medical imaging, although smaller, maintained premium pricing because of stringent regulatory and color-accuracy requirements that favor IPS and AFFS technologies. Small appliances-from smart ovens to washing-machine panels-added incremental unit growth, yet screen sizes remained modest and margins tight.
Automotive applications are the clear momentum leader, advancing at a 12.35% CAGR between 2026-2031 as electric vehicles incorporate larger dashboards, passenger entertainment screens, and head-up displays. Direct-backlight LCDs with local dimming appeal to automakers looking for power-efficient, cost-controlled alternatives to OLED, while strengthened glass and specialized coatings address vibration and temperature extremes. Suppliers such as AU Optronics reported double-digit revenue gains from mobility displays, and Tier-1s are locking in multiyear supply contracts to secure panel allocation amid Chinese capacity dominance. Industrial users are migrating to sunlight-readable LCDs with low-power gate drivers, supporting prolonged product lifecycles in harsh settings. Medical-grade manufacturers continue to leverage mini-LED backlights to meet luminance and uniformity targets for surgical imaging, keeping ASPs resilient even as mass-market prices fall.
Geography Analysis
Asia-Pacific’s 46.62% share reflects the clustering of entire LCD value chains in mainland China, Taiwan, and South Korea. Chinese state incentives worth billions of dollars financed fabs such as TCL Huaxing’s T9, elevating national output to 72% of global capacity by 2024. The region also hosts major component suppliers-polarizer films, glass, and driver ICs-enabling just-in-time logistics and shorter design cycles. Taiwan’s AU Optronics and Innolux have begun divesting older fabs to semiconductor partners, signaling strategic pivots toward higher-margin microdisplay and driver IC.
North America and Europe concentrate on premium automotive, avionics, and medical displays where reliability and regulatory compliance command price premiums. The automotive center-stack display market in these regions will jump from USD 8.98 billion in 2025 to USD 14.68 billion by 2034, supporting a steady intake of mid-sized, high-brightness LCDs. European OEMs are also imposing strict ESG criteria on fluorinated chemistries, accelerating investment in greener liquid-crystal formulations.
The Middle East and Africa region is projected to log 9.63% CAGR as airports, malls, and government projects adopt large digital-signage networks through 2031. Gulf countries are deploying smart-city initiatives that rely heavily on public information displays, often sourced from Chinese integrators for cost reasons. Sub-Saharan Africa’s education sector is another pocket of upside, led by donor-funded classroom digitization. South America remains a nascent opportunity where currency volatility tempers cap-ex cycles, yet retail modernization is gradually lifting unit demand for commercial LCDs.

Competitive Landscape
Market concentration is moving toward a semi-oligopoly anchored by Chinese firms. Combined, BOE and TCL Huaxing controlled just over 50% of global capacity in 2025, while China’s broader cohort reached 72.7% supply share. Aggressive price competition pressured Samsung Electronics and LG Electronics, both of which reported 5-6% ASP drops in early 2025. Korean and Japanese exits have reduced the field of non-Chinese large-area panel producers to a handful of specialists focusing on Mini-LED, microdisplay, or ruggedized niches.
Strategic moves highlight divergent playbooks. TCL Huaxing deepened scale with the Guangzhou acquisition, targeting TV brands needing secure panel allocations. Samsung leveraged quantum-dot OLED for flagship monitors while outsourcing some entry-level LCD volumes. Mitsubishi Chemical, holding 35% share of PVOH for polarizers, is investing in solvent-free coating to secure OEM mandates that value ESG compliance. Meanwhile, AU Optronics is monetizing expertise in automotive-grade in-cell touch to lift blended margins.
White-space opportunities persist in cabin electronics, industrial IoT panels, and large-format signage where OLED remains price constrained. Micro-LED pilot lines in the United States and Korea are siphoning capital expenditure, yet most analysts expect commercial volumes only after 2028, preserving a runway for premium Mini-LED LCDs.
Liquid Crystal Display (LCD) Industry Leaders
-
Panasonic Corporation
-
Innolux Corporation
-
Vedanta
-
Toshiba Corporation
-
Advantech Co., Ltd
- *Disclaimer: Major Players sorted in no particular order

Recent Industry Developments
- April 2025: LG Display completed the sale of its Guangzhou 8.5-generation plant to CSOT for up to KRW 2 trillion (USD 1.5 billion), finalizing its withdrawal from mass-market LCDs.
- April 2025: Apple confirmed a second-generation Studio Display featuring Mini-LED backlighting, reinforcing LCD relevance in creative workstations.
- March 2025: Samsung Display posted KRW 5.9 trillion revenue and KRW 0.5 trillion operating profit for Q1 2025, buoyed by new QD-OLED monitors.
- January 2025: SCREEN Holdings recorded all-time-high quarterly revenue on surging semiconductor equipment orders that include LCD deposition tools.


Research Methodology Framework and Report Scope
Market Definitions and Key Coverage
Our study defines the liquid crystal display (LCD) market as the yearly revenue earned from new flat-panel units whose light is modulated by liquid-crystal layers across consumer, automotive, industrial, medical, and professional equipment. According to Mordor Intelligence, figures track factory-gate panel and module sales expressed in USD.
Scope exclusion: After-market replacement parts, cathode-ray tubes, OLED, micro-LED, and LCoS products are outside this analysis.
Segmentation Overview
-
By Technology
- Twisted Nematic (TN)
- In-Plane Switching (IPS)
- Vertical Alignment (VA)
- Advanced Fringe Field Switching (AFFS)
-
By Panel Size
- Smaller than 10 inch
- 10 inch to 29.9 inch
- 30 inch to 49.9 inch
- Bigger than 50 inch
-
By End-use Device Category
- TVs and Signage
- Monitors and Laptops
- Smartphones and Tablets
- Automotive and Industrial Displays
-
By Application
- Industrial
- Automotive
- Medical
- Small Appliances
- Consumer Goods
- Others
-
By Geography
-
North America
- United States
- Canada
- Mexico
-
Europe
- Germany
- United Kingdom
- France
- Italy
- Spain
- Russia
- Rest of Europe
-
Asia-Pacific
- China
- Japan
- South Korea
- India
- Australia and New Zealand
- Rest of Asia-Pacific
-
South America
- Brazil
- Argentina
- Rest of South America
-
Middle East and Africa
-
Middle East
- Saudi Arabia
- United Arab Emirates
- Turkey
- Rest of Middle East
-
Africa
- South Africa
- Nigeria
- Rest of Africa
-
Middle East
-
North America
Detailed Research Methodology and Data Validation
Primary Research
Mordor analysts speak with panel manufacturers, backlight suppliers, set assemblers, and large buyers in Asia-Pacific, North America, and Europe. These interviews verify yield assumptions, regional capacity utilization, and forward ASP guidance, closing gaps left by public data.
Desk Research
We collect baseline data from public bodies such as UN Comtrade, the International Trade Centre, the U.S. Census Bureau, SID conference proceedings, and SEMI's fab capacity trackers. Company 10-Ks, investor presentations, and press releases accessed through Dow Jones Factiva clarify pricing moves, while Questel patent families highlight technology shifts. D&B Hoovers supplies financial splits for key panel makers. The sources listed illustrate our approach; many additional references support data collection, cross-checks, and clarifications.
Market-Sizing & Forecasting
A top-down model begins with national production plus net trade volumes before multiplying by quarterly average selling prices, thereby building a value baseline. Bottom-up spot checks, supplier roll-ups, and distributor channel inquiries calibrate volumes and prices. Key variables include fab additions, smartphone and TV unit shipments, automotive display penetration, mini-LED backlight uptake, currency shifts, and panel price cycles. A multivariate regression links market value to these drivers, while scenario testing adjusts for supply shocks.
Data Validation & Update Cycle
Outputs undergo multi-step analyst reviews, variance checks against independent indicators, and anomaly investigations. Reports refresh every twelve months, with interim updates after material events. A final pass guarantees clients receive the latest view.
Why Our LCD Baseline Commands Strong Reliance
Published estimates often diverge because firms bundle different products, apply distinct ASP trends, and refresh models on varying cadences.
Key gap drivers include whether integrated modules or refurbished panels are counted, how rapidly falling ASPs are embedded, and the breadth of display technologies covered.
Benchmark comparison
| Market Size | Anonymized source | Primary gap driver |
|---|---|---|
| USD 2.14 B (2025) | Mordor Intelligence | |
| USD 92.56 B (2024) | Global Consultancy A | Includes all display technologies plus finished TVs and monitors |
| USD 176.73 B (2023) | Trade Journal B | Adds service revenue and uses constant ASP without regional mix correction |
The comparison shows that by focusing strictly on new LCD panels, refreshing prices quarterly, and validating assumptions through primary outreach, Mordor Intelligence delivers a balanced, transparent baseline that decision-makers can trust and readily replicate.


Key Questions Answered in the Report
What is the current size of the liquid crystal display market?
The market generated USD 2.33 billion in 2026 and is projected to reach USD 3.56 billion by 2031.
Which region leads the liquid crystal display market?
Asia-Pacific holds 46.62% revenue share owing to China’s expansive manufacturing base.
How fast is the automotive LCD segment growing?
Automotive and industrial displays are forecast to expand at an 11.55% CAGR between 2026-2031.
Why are Mini-LED backlit LCDs gaining traction?
Mini-LED improves local dimming and contrast, allowing LCDs to challenge OLED performance in premium devices at a lower cost.
Who are the dominant players in LCD panel manufacturing?
BOE and TCL Huaxing together control large chunk of global capacity, followed by Samsung Display and other specialists.
What is the main threat to future LCD demand?
Continued OLED price erosion is narrowing the cost gap, potentially diverting premium demand away from LCDs in the medium term.
Page last updated on:


