
Display Driver Market Size and Share
Market Overview
| Study Period | 2020 - 2031 |
|---|---|
| Market Size (2026) | USD 9.69 Billion |
| Market Size (2031) | USD 14.72 Billion |
| Growth Rate (2026 - 2031) | 8.73 % |
| Fastest Growing Market | Asia-Pacific |
| Largest Market | Asia Pacific |
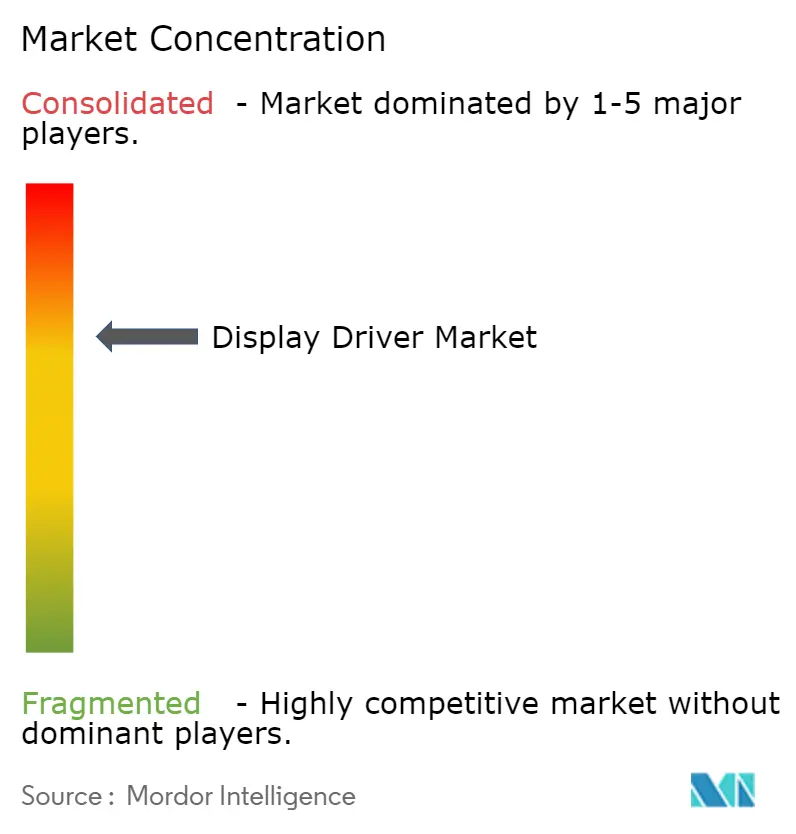
| Market Concentration | Medium |
Major Players
*Disclaimer: Major Players sorted in no particular order Image © Mordor Intelligence. Reuse requires attribution under CC BY 4.0. |
|
Display Driver Market Analysis by Mordor Intelligence
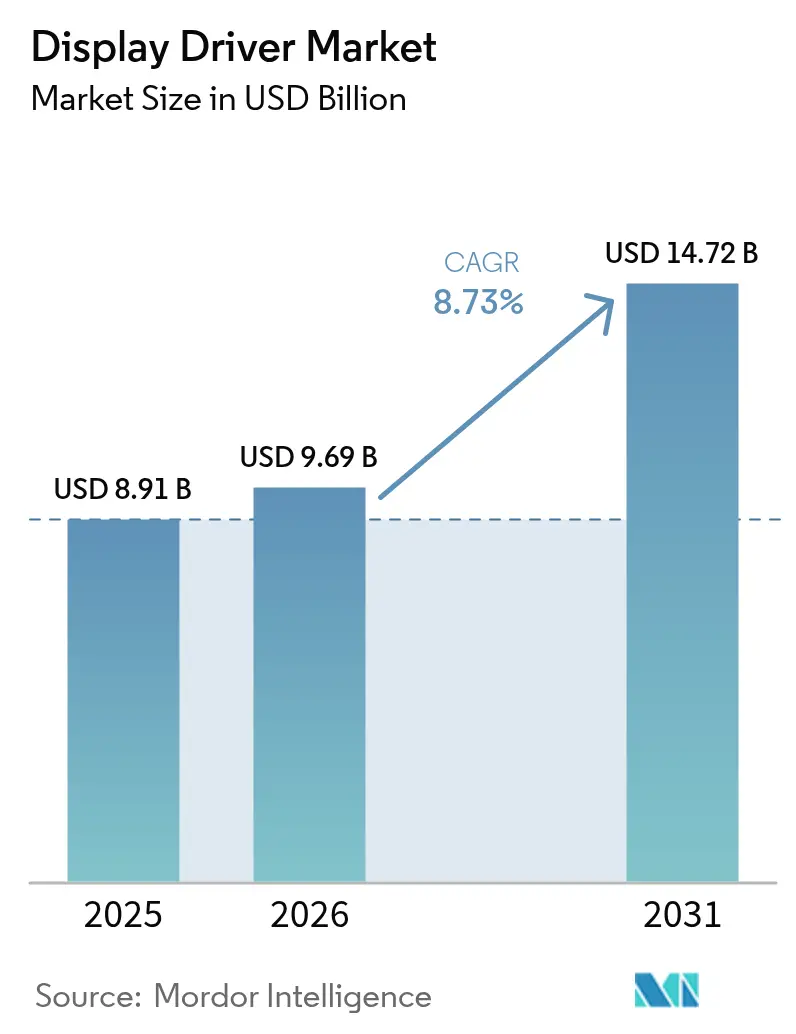
The display driver market size in 2026 is estimated at USD 9.69 billion, growing from 2025 value of USD 8.91 billion with 2031 projections showing USD 14.72 billion, growing at 8.73% CAGR over 2026-2031. Volume demand follows the rapid shift from legacy LCD to OLED and the first commercial rollouts of MicroLED across premium consumer and automotive screens. Technical requirements are rising just as quickly: new panels call for sub-28 nm driver ICs, wide-bandwidth timing controllers, and integrated touch functions that keep power budgets tight even at variable refresh rates. China remains the production powerhouse and the single largest buyer of drive circuits, but South Korea’s capacity expansions in Gen 8.6 OLED fabs create the fastest unit growth. Meanwhile panel makers are moving upstream into IC design, squeezing third-party suppliers yet opening a lane for niche vendors that focus on LTPO backplanes, flexible interconnects, and automotive-grade safety features.
Key Report Takeaways
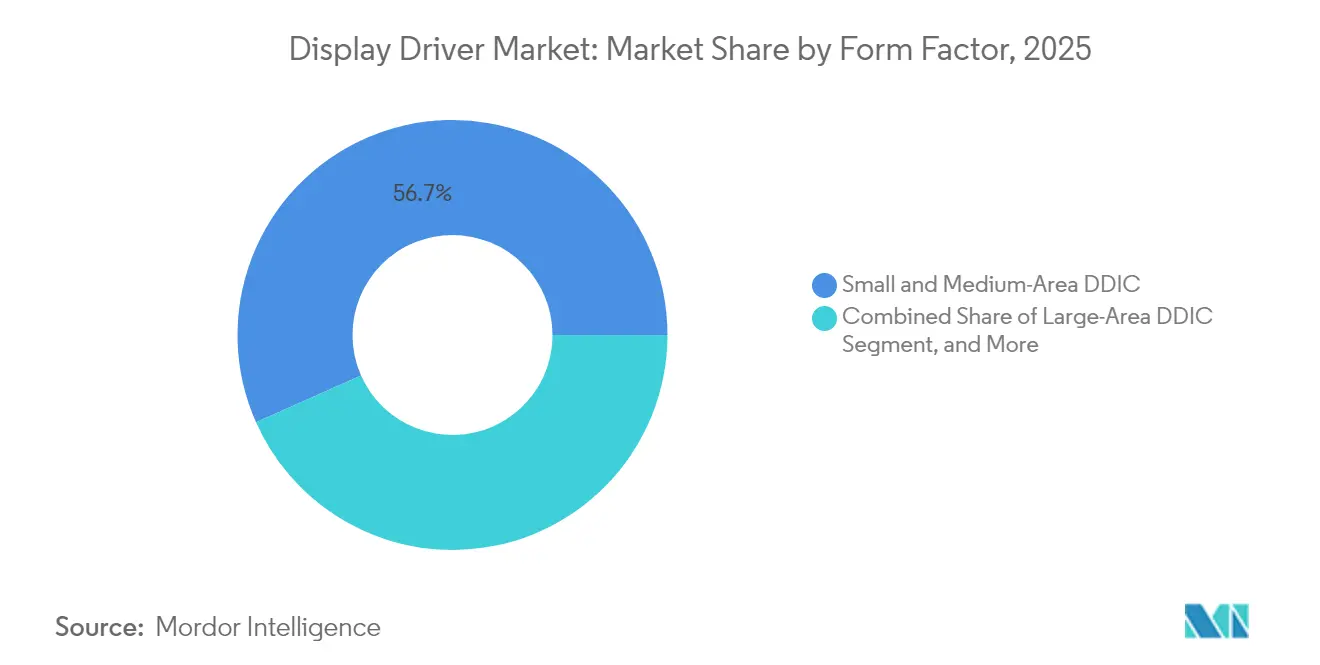
- By form factor, small- and medium-area driver ICs led with 56.65% display driver market share in 2025, while flexible / foldable solutions are forecast to post an 11.45% CAGR through 2031.
- By display technology, LCD captured 62.70% of the display driver market size in 2025; MicroLED is projected to advance at a 12.25% CAGR to 2031.
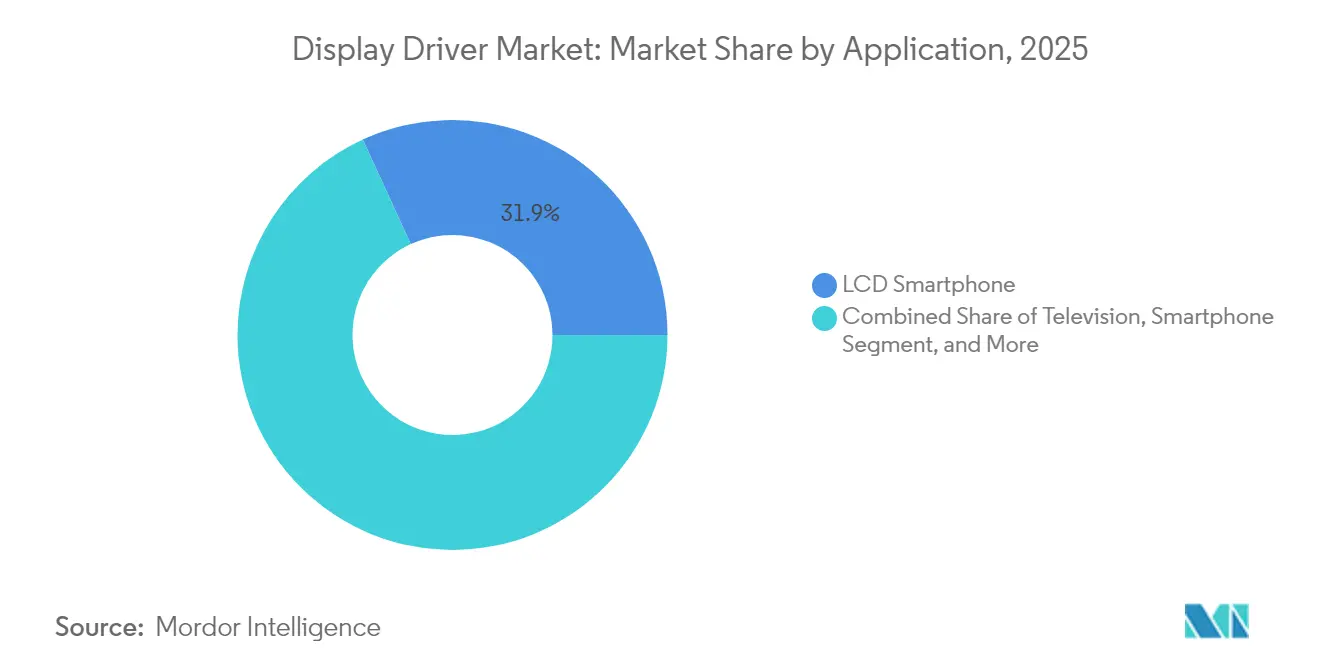
- By application, smartphones accounted for 31.85% share of the display driver market in 2025, whereas automotive displays are set to grow at a 15.25% CAGR through 2031.
- By end-use industry, consumer electronics held 71.05% of display driver market share in 2025; the broader electronics segment is expected to rise at a 14.10% CAGR to 2031.
- By geography, China dominated with 44.25% revenue share of the display driver market in 2025, while South Korea is positioned for a 9.85% CAGR up to 2031.
Note: Market size and forecast figures in this report are generated using Mordor Intelligence’s proprietary estimation framework, updated with the latest available data and insights as of 2026.
Market Trends and Insights
Drivers Impact Analysis of Display Driver Market*
| Driver | (~) % Impact on CAGR Forecast | Geographic Relevance | Impact Timeline |
|---|---|---|---|
| Exponential OLED adoption in flagship smartphones | +2.10% | North America & Asia-Pacific | Medium term (2-4 years) |
| Automotive digital cockpit proliferation | +1.80% | Europe with global spillover | Long term (≥ 4 years) |
| Large-area 8K LCD TV migration | +1.40% | China with export reach | Short term (≤ 2 years) |
| LTPO backplane and integrated touch in wearables | +1.20% | Global, concentrated in Asia-Pacific | Medium term (2-4 years) |
| Government-backed semiconductor self-sufficiency programs | +0.90% | Taiwan & South Korea | Long term (≥ 4 years) |
| Shift to <28 nm nodes for EV infotainment displays | +0.80% | Global, led by Europe & China | Medium term (2-4 years) |
| Source: Mordor Intelligence | |||
Exponential OLED adoption in flagship smartphones across North America and Asia-Pacific
OLED overtook LCD in smartphone unit share during 2024 and is still gaining ground as brands standardize on 120 Hz adaptive refresh and under-panel cameras. Samsung Display’s 0.6 mm-thin panels scheduled for 2026 will cut power draw by 30% and require drivers able to throttle from 1 Hz to 120 Hz without flicker.[1]Rasmus Larsen, “Samsung Display to start production of Ultra-Thin OLEDs in 2026,” FlatpanelsHD, flatpanelshd.com Apple’s first foldable iPhone, slated for 2026, further validates the premium flexible format and boosts demand for bend-tolerant driver ICs with reinforced trace routing.[2]Ron Mertens, “Apple to exclusively use SDC’s OLED displays in its 2026 foldable iPhone,” OLED Info, oled-info.com LTPO backplanes, which ship in volume starting with Apple Watch models, are becoming a smartphone default thanks to their 5-15% power savings and will surpass LTPS in cumulative units before 2029. Together these shifts add steady tailwinds to the display driver market as OEMs need more complex gate compensation and touch integration.
Surge in automotive display adoption for digital cockpits fueling multi-channel driver IC demand in Europe
European vehicle makers are accelerating the transition from analog gauges to software-defined cockpit domains that blend instrument, infotainment, and passenger screens on a single SoC pipeline. Average panel count per vehicle climbed to 4.3 in premium models during 2024, and multi-channel driver IC attach rates followed the same arc. Himax recorded its first quarter in which automotive TDDI revenue surpassed classic DDIC income after shipping 70 million units cumulatively. Microchip’s 2025 acquisition of connectivity specialist VSI expands in-vehicle networking bandwidth to DisplayPort 2.1’s 80 Gbps, a prerequisite for uncompressed 8K dashboards. These moves keep the display driver market firmly tethered to ADAS and cockpit growth.
Rapid proliferation of large-area 8K LCD TV panels in China elevating driver IC ASPs
China’s 76% share of global panel capacity provides leverage to steer the industry into 8K and Mini LED backlights quicker than any other region. Every additional horizontal pixel column demands more current-drive transistors, lifting silicon content per panel and pushing up average selling prices. TCL’s 85-inch sets with 150 Hz native refresh showcase the higher pin-count timing controllers now considered mainstream. LG’s 100-inch QNED models expand that requirement to massive canvases that need thousands of local-dimming zones. Driver vendors able to coordinate Mini LED FALD and sub-10 µm gate pitches command a healthy premium in this environment.
Migration toward LTPO backplane and integrated touch drivers in wearables boosting high-margin SDDI sales
Wearable displays operate under stringent space and battery limits, making LTPO a natural fit. Apple’s LTPO-3 architecture moves every driving TFT to oxide, trimming overall consumption by up to 15% while retaining 1 Hz clock capability for always-on modes. TCL CSOT combines LTPO with Micro Lens Panels to achieve a 30% reduction in power use, again leaning on sophisticated drive waveforms. Integrating touch sensing inside the same die displaces separate controllers, turning single-chip display and touch integration (SDDI) into a margin-rich opportunity for fabless houses versed in 22 nm and below.
Restraints Impact Analysis of Display Driver Market*
| Restraint | (~) % Impact on CAGR Forecast | Geographic Relevance | Impact Timeline |
|---|---|---|---|
| Chronic foundry capacity tightness <40 nm | –1.6% | Global, focused in Taiwan & South Korea | Short term (≤ 2 years) |
| Intensifying panel-maker vertical integration | –1.2% | Global, led by China & South Korea | Long term (≥ 4 years) |
| High royalty cost of ESD and T-Con IP | –0.9% | Global | Medium term (2-4 years) |
| Yield challenges in COF packaging for ultra-thin bezels | –0.7% | Global, concentrated in Asia-Pacific | Short term (≤ 2 years) |
| Source: Mordor Intelligence | |||
Chronic foundry capacity tightness below 40 nm limiting DDIC supply
The same fabs that print driver ICs also run AI accelerators. TSMC projects USD 31.42 billion in Q2 2025 revenue, fueled mainly by high-performance compute customers that lock in the bulk of 5 nm and 7 nm wafers.[3]Richard Chen, “Taiwan Wafer Foundry Industry, 2Q 2025,” DIGITIMES, digitimes.com Mature nodes at 28 nm and 40 nm face competing demand from consumer SOCs, leaving display driver orders on allocation. The engineer shortage in the United States, pegged at 67,000 by 2030, may further delay greenfield capacity ramps.
Intensifying panel-maker vertical integration curtailing third-party driver IC TAM
Panel makers are absorbing driver functionality to shave bill-of-materials cost and secure supply. Samsung Display’s Gen 8.6 IT OLED fab, due online in 2026, includes in-house driver design teams that once relied on Novatek or Raydium. BOE is following the same path: while struggles with iPhone yield highlighted execution risk, its strategy remains intact. As internal sourcing grows, the open display driver market faces a smaller served addressable base, pressuring fabless vendors to pivot toward differentiated niches such as automotive safety or AR microdisplays.
*Our forecasts treat driver/restraint impacts as directional, not additive. The impact forecasts reflect baseline growth, mix effects, and variable interactions.
Display Driver Market Segment Analysis
By Form Factor:
Flexible Displays Drive InnovationSmall- and medium-area ICs dominated sales, holding 56.65% of display driver market share in 2025. These parts serve smartphones, tablets, and a broad range of IoT screens that prize low leakage and compact die sizes. Average unit price remains under USD 0.90, yet volume offsets the thin margins, making the segment a foundation of the display driver market. Demand stays resilient as handset OEMs migrate to 120 Hz variable refresh, prompting a subtle uplift in ASP.
Flexible / foldable driver ICs generate far lower unit volume today but post the fastest expansion at an 11.45% CAGR. Samsung’s Z series hit 9.25 million panels shipped in Q2 2024, validating mainstream foldables and pushing competing brands to follow. Huawei nearly doubled its foldable shipments within the same window, signaling a widened field of buyers. Drivers in this category must tolerate repetitive bending at radii below 2 mm, pack in compensation algorithms for crease mitigation, and integrate touch to save board area. LG Innotek’s two-metal COF substrate offers dual-side routing, shrinking bezels even further. Apple’s anticipated 2026 entrance is a demand kicker that nearly every fabless roadmap is already targeting.



By Display Technology:
MicroLED Disrupts Traditional HierarchiesLCD retained 62.70% revenue share of the display driver market in 2025 thanks to entrenched manufacturing scale, but the value story is shifting. Mini LED backlights force far higher channel counts into timing controllers, doubling the attachment value per panel in premium TVs. Meanwhile OLED adoption grows in tablets and laptops, scaling from 5.7% to 18% penetration in tablets by 2028, a windfall for power-efficient drivers.
MicroLED, however, stands out with a 12.25% CAGR to 2031. Direct-emission panels achieve peak brightness of 20,000 nits in prototype microdisplays, surpassing OLED while cutting lifetime concerns. Applied Materials’ quantum-dot color-conversion technique lowers cost hurdles and raises yield uniformity. Driver ICs must now handle sub-5 µm pixel pitches and deliver diode-level current matching, a spec set that favors firms with analog circuit heritage. E-paper remains niche, but it preserves a steady stream of low-frequency gate drivers for shelf labels and readers.
By Application:
Automotive Segment AcceleratesSmartphones still delivered 31.85% of unit shipments in 2025, anchoring scale for both LCD and OLED driver IC output. Yet automotive displays rise the fastest, with a 15.25% CAGR forecast as vehicles average more than 30 inches of combined screen real estate. The display driver market size for cockpit modules is on track to outpace television by late decade once Level-3 autonomy spins up new contextual display zones.
Himax leads automotive TDDI with 40% share and has shipped 70 million units since launch, underscoring how safety-rated silicon builds defensible ASP. Television and monitor categories grow at mid-single digits, buoyed by gaming refresh rates and 8K resolutions that hike driver pin count. AR / VR headsets, energized by Apple Vision Pro and Samsung’s LEDoS roadmap, introduce novel needs around ultra-high FPGA frame rates. Industrial human-machine interfaces transition from membrane keys to resistive touch panels, spreading driver demand across factory automation.
By End-Use Industry:
Electronics Segment Leads GrowthConsumer electronics controlled 71.05% of revenue in 2025 and continues to provide the tonnage that lets fabs run at high utilization. The display driver industry, however, sees its highest proportional growth inside the broader electronics bucket at 14.10% CAGR, a category that captures smart speakers, home security panels, and thermostats. Automotive rolls in as an adjacent engine, adding ISO 26262 and AEC-Q100 credentials that justify premium pricing and prop up gross margin.
Healthcare devices migrate to high-contrast OLED readouts for patient vitals, sparking demand for drivers with true black levels and FDA-grade reliability. Aerospace and defense require extreme-temperature variants with extended vibration tolerance, an area where European IDM suppliers still hold an edge. Finally, India’s entry through Tata Electronics, Himax, and PSMC flags a geographic broadening of demand and manufacturing that could rebalance supply over the coming decade.
Geography Analysis
China Display Driver Market
China sat atop the leaderboard with 44.25% of display driver market revenue in 2025. Massive government incentives and on-going panel investments make the nation both the largest buyer and the most formidable future supplier of driver ICs. Domestic fabs advance from 55 nm riverbeds to viable 28 nm nodes, giving local customers an alternative to Taiwan foundries and thus reshaping the procurement map. TCL’s inkjet-printed OLED pilot lines strengthen this self-reliance push. Panel self-sufficiency translates into a tight correlation between local policy and driver demand.
South Korea Display Driver Market
South Korea records the fastest growth, posting a projected 9.85% CAGR through 2031. Samsung and LG Display extend their lead in OLED evaporation know-how and layer uniformity. The government-backed USD 471 billion semiconductor corridor plans to bring sixteen new fabs online and more than double system-level capacity. A high share of that wafer inventory will roll into display driver wafers printed at 22 nm and finer.
Taiwan, the Americas and Europe Display Driver Market
Taiwan remains the indispensable foundry partner for global fabless players. TSMC alone aims for USD 31.42 billion in quarterly revenue, keeping display driver tape-outs alive even as AI chips claim the lion’s share of leading-edge capacity. In the Americas, CHIPS Act incentives pull limited driver volumes onshore, illustrated by TSMC’s USD 165 billion Arizona build-out that pairs logic with advanced packaging lines. Europe carves its niche through automotive display demand: continental OEMs prefer local supply for mission-critical ADAS clusters, spurring small but strategic driver IC design houses.
Regulatory Landscape
The display driver market is shaped by trade policy, semiconductor industrial policy, and product compliance regimes tied to end-use. In January 2026, the United States issued a Section 232 proclamation covering imports of semiconductors, semiconductor manufacturing equipment, and derivative products, and related communications to importers increased attention on tariff exposure and customs classification for chip supply chains. In Europe, the European Commission proposed Chips Act 2.0 (COM/2026/504) in 2026, reinforcing the direction toward regional semiconductor resilience and crisis preparedness, which affects decisions on where display-driver design, wafer sourcing, and packaging capacity are located.
On the product side, automotive and safety-critical displays bring higher barriers through qualification and functional-safety expectations such as AEC-Q100 and ISO 26262. In February 2026, Arasan Chip Systems announced ISO 26262 functional-safety certification for its second-generation ultra-low-power MIPI D-PHY IP, highlighting how certified interface IP and compliance evidence increasingly influence the time-to-design-win for automotive-grade display drivers. Environmental compliance norms, including RoHS/REACH, continue to affect materials and packaging choices for display-driver IC supply into consumer electronics and industrial devices.
Value Chain Analysis
The display driver value chain starts with IP blocks and mixed-signal IC design (DDIC, TDDI, and timing-related functions), then moves to wafer fabrication at foundries with high-voltage and display-optimized process options. From there, it proceeds to assembly and test (notably COF/COG for thin-bezel and flexible panels), followed by module integration at panel makers and ODM/OEM device assembly. The market remains predominantly fabless, with reliance on specialty foundry capacity from players such as TSMC, UMC, and PSMC, while panel makers and system OEMs shape specifications through interface choices, power budgets, and qualification cycles.
Bottlenecks cluster around constrained capacity for OLED-compatible and high-voltage processes, long mask lead times, and lengthy panel-maker qualification. These factors tighten supply during node transitions and new form-factor ramps. In May 2026, UMC introduced a 14 nm embedded high-voltage (eHV) FinFET technology platform validated at Fab 12A, indicating upstream process evolution that supports higher bandwidth and lower power for next-generation panels. Regional ecosystem-building also shows up in the chain, for example through Himax, Tata Electronics, and PSMC aligning on an India-based display and ultralow-power AI sensing product ecosystem that widens options for design, validation, and manufacturing localization.
Competitive Landscape
The display driver market sits in a mid-tier concentration band. The top five suppliers control roughly 65% of revenue, enough to maintain pricing discipline yet open to share swings when new process nodes emerge. Novatek holds leadership in TV and monitor drivers, benefiting from early Mini LED controller deployments. Samsung Semiconductor leverages vertical process ownership to bring 22 nm low-power mobile drivers to mass production. Synaptics focuses on integrated touch and haptics, cornering the premium notebook space.
Chinese challengers such as Smart-Chip and Fitipower gain volume in entry-level smartphones due to competitive die area and proximity to panel makers. BOE’s internal driver design unit, though still below the cost curve of incumbents, signals a credible threat as yield improves. Alliances outnumber outright acquisitions: Tata Electronics linked with Himax and PSMC to funnel fab capacity into India for future driver and AI sensing chips. Microchip’s purchase of VSI folds high-speed link IP into its automotive portfolio, rounding out cockpit offerings.
R&D agendas cluster around sub-28 nm conversion, adaptive dimming algorithms for MicroLED, and functional safety augmentation. Patent filings show heightened activity in panel-side hotplug detection and error correction coding, features critical for automotive and VR use cases. Suppliers that succeed in combining these advanced blocks on one die look set to command premium slots even as panel makers trim their external spend.
Display Driver Industry Leaders
-
Novatek Microelectronics Corp.
-
Synaptics Incorporated
-
Samsung Electronics Co., Ltd. (System LSI)
-
MediaTek Inc.
-
LX Semicon Co., Ltd.
- *Disclaimer: Major Players sorted in no particular order
Display Driver Market Companies Covered in this Report
- Novatek Microelectronics Corp.
- Synaptics Incorporated
- Samsung Electronics Co., Ltd. (System LSI)
- Silicon Works Co., Ltd.
- MediaTek Inc.
- LX Semicon Co., Ltd.
- Magnachip Semiconductor Corp.
- Fitipower Integrated Technology Inc.
- Raydium Semiconductor Corp.
- Sitronix Technology Corp.
- Himax Technologies, Inc.
- FocalTech Systems Co., Ltd.
- Parade Technologies, Ltd.
- Solomon Systech Ltd.
- Pixelworks, Inc.
- Alpha and Omega Semiconductor Ltd.
- Chipone Technology (Beijing) Co., Ltd.
- Rockchip Electronics Co., Ltd.
- Ilitek (I-LITEK) Corp.
- Silan Microelectronics Co., Ltd.
- Apple Inc. (Internal Display Driver Group)
- BOE Varitronix Ltd.
- Shenzhen Goodix Technology Co., Ltd.
- Arm Technology (Display HW IP)
- Texas Instruments Incorporated

Market Opportunities and Future Outlook
Opportunities concentrate where panel innovation raises driver complexity faster than commoditized LCD and legacy smartphone cycles. High-refresh-rate gaming monitors and advanced OLED stacks increase the need for higher bandwidth, tighter power control, and more robust compensation algorithms in driver ICs and timing functions. In July 2026, ASUS announced ROG Swift OLED monitors using Tandem RGB OLED technology with 4K resolution and up to 480 Hz operation (in FHD mode), reinforcing the shift toward performance panels that call for more capable driving, power management, and interface coordination.
Flexible and foldable roadmaps keep opening whitespace for bend-tolerant interconnect, integrated touch, and power-optimized variable refresh across thin, mechanically stressed form factors. In July 2026, Samsung introduced Flex Titanium foldable-display technology using titanium-alloy film and plate to improve durability and reduce crease visibility, which supports continued investment in premium foldables that require specialized driver designs and packaging choices. In automotive, the move to multi-display cockpits and functional-safety expectations sustains demand for automotive-grade driver ICs with qualification depth, and supply-chain programs, including EU Chips Act 2.0 and foundry platform introductions such as UMC 14 nm eHV, create openings for vendors that can secure capacity, certify IP, and co-develop with panel makers.
Recent Industry Developments in Display Driver Market
- June 2026: Synaptics introduced the DisplayLink DL-7xxx family, expanding its DisplayLink connectivity portfolio for enterprise and embedded computing use cases. The release positions Synaptics to pair display connectivity with higher-value features used in intelligent docks and embedded platforms, widening its attach points beyond traditional display interface functions.
- June 2025: Tata Electronics formed a strategic alliance with Himax Technologies and Powerchip Semiconductor Manufacturing Corporation (PSMC) to develop an India-based display and ultralow power AI sensing ecosystem. The collaboration supports supply-chain diversification and creates a pathway for localized validation and future production aligned with next-generation driver IC requirements.
- April 2025: Applied Materials unveiled a quantum-dot color-conversion method for MicroLED aimed at improving luminance and energy efficiency. The process development supports broader MicroLED commercialization by addressing conversion efficiency and uniformity, which raises demand for more precise current-control capabilities in MicroLED driver ICs.


Display Driver Market Report Scope and Research Methodology
Market Definition and Coverage
The display driver market is defined as revenue generated from integrated circuits that drive pixels by converting image data into the electrical signals used by flat panel displays across end devices.
Scope exclusions: This sizing excludes LED lighting driver ICs, standalone timing controllers, and general power-management ICs that are not primarily used for pixel driving.
Segments Covered in This Report
-
By Form Factor
- Large-Area DDIC
- Small and Medium-Area DDIC
- Flexible/Foldable DDIC
-
By Display Technology
- LCD
- OLED
- MicroLED
- E-Paper
-
By Application
- Television
- Smartphone
- Tablet
- Notebook PC
- Desktop Monitor
- Automotive Displays
- Wearables
- Industrial and HMI
- AR/VR Headsets
-
By End-use Industry
- Consumer Electronics
- Automotive
- Industrial
- Healthcare
- Aerospace and Defense
-
By Geography
- China
- Taiwan
- South Korea
- Americas
- Rest of the World
Data Sources, Market Sizing, and Validation
Desk Research
Desk research is used to set the market context and build the first set of assumptions for demand and pricing. Public sources that help here include semiconductor trade and shipment releases from groups such as WSTS, electronics and ICT statistics from sources such as OECD and the World Bank, and trade flows from sources such as UN Comtrade. For the display side, shipment signals and technology transitions were checked using sources such as SID publications, government trade bulletins, and peer-reviewed papers on OLED and advanced LCD backplanes.
We also reviewed company annual reports, investor presentations, and reputable press coverage to understand product positioning and supply constraints for pixel-driving ICs. Where public information is limited, paid subscription data covering company financials and a patent database were used to cross-check product roadmaps and identify active suppliers. The desk research sources referenced above are illustrative only, and additional public and paid sources were used for data collection, validation, and clarification during the study.
Primary Interviews and Surveys
Primary work focuses on validating what actually ships, and how pricing moves by node and display type, because that is where desk sources can lag. We spoke with a mix of component suppliers, module ecosystem participants, and OEM-facing experts, and then used their input to confirm adoption timelines for OLED, flexible displays, and higher refresh rate panels across major regions.
Distribution of primary research fieldwork respondents
| Company type | Respondent position | Region |
|---|---|---|
| Top tier: 29% | CXOs: 14% | APAC: 44% |
| Mid tier: 56% | Functional/Unit leaders: 33% | EMEA: 33% |
| Smaller Players: 15% | Managers: 53% | Americas: 23% |
Market-Sizing & Forecasting
Sizing starts with a top-down reconstruction that links device and panel demand to the attach rate of display driver ICs by display technology, and then converts that demand into value using average selling price ranges. Inputs that are tracked include shipments of smartphones, TVs, monitors, and in-vehicle displays, the LCD versus OLED mix, the share of flexible and high refresh rate panels, and the typical driver count per panel for key form factors. Pricing assumptions are guided by node migrations, integration levels like TDDI, and expected pricing pressure during oversupply cycles, and then checked using interview feedback.
Selective bottom-up checks are added so the totals do not drift away from reality. These checks use sampled supplier revenue splits by product line, channel feedback on unit volumes, and a sanity check of implied ASP multiplied by estimated unit shipments for major device groups. Where direct disclosure is not available, gaps are handled through conservative ranges. Forecasting is done using scenario analysis supported by device shipment outlooks and display technology transition timing, and then refined using expert consensus on near-term capacity additions and design win cycles.
Data Validation & Update Cycle
Model outputs are validated by comparing implied units and ASP trends against independent signals such as device shipment series, panel mix changes, and visible technology inflection points such as OLED penetration in premium phones. When large variances appear by region or technology, we recheck the assumptions and, where needed, re-contact sources to confirm whether it is a timing issue, a pricing step-down, or a scope mismatch. Before sign-off, the work goes through a multi-step internal review so that calculations, currency conversions, and year alignment are consistent.
Reports are refreshed annually, and interim updates are made when material events occur, such as sharp demand changes, supply disruptions, or major capacity expansions. Right before delivery, an analyst performs a final pass to ensure the latest public indicators and interview feedback are reflected in the final numbers.
Mordor Intelligence's Display Driver Market Size Versus Other Published Estimates
Published market values for display drivers can look different even when the topic sounds similar, because the included IC types and the way value is recognized are not always aligned. Differences in whether the number is tied to panel demand, device shipments, or factory-gate revenues also create visible spreads.
The main gap comes from whether adjacent ICs are mixed into the definition, such as timing controllers, VCOM amplifiers, or broader display-interface components, where Mordor Intelligence counts revenue only for dedicated pixel-driving ICs tied to LCD, OLED, MicroLED, and related flat-panel displays. Forecast gaps can also come from how OLED adoption speed is assumed, whether flexible panels get a faster ramp, and how ASP erosion is applied during node transitions and high inventory periods.
Benchmark comparison
| Source | Market Size | Gaps in Research Methodology |
|---|---|---|
| Mordor Intelligence | USD 8.91 B (2025) | |
| Trade Publisher A | USD 9.31 B (2025) | Uses a broader factory-gate style value capture and appears to include adjacent display-oriented IC revenue categories, which can lift totals above a strict driver-only definition. |
| Global Consultancy B | USD 9.85 B (2025) | Likely applies a wider product scope and a more optimistic mix shift toward higher priced OLED and integrated drivers, without clearly showing the unit-to-ASP steps behind the total. |
Across the three figures, the spread is mainly explained by scope and value-recognition choices rather than a disagreement that the market is growing. By keeping the sizing tied to observable device and panel signals, and then pressure-testing ASP and attach-rate assumptions with interviews, the resulting number stays traceable and repeatable for planning.


Key Questions Answered in the Report
What is the current size of the display driver market?
The display driver market reached USD 9.69 billion in 2026 and is projected to grow steadily to USD 14.72 billion by 2031.
Which region is growing fastest in the display driver market?
South Korea records the highest CAGR at 9.85% through 2031, driven by large OLED capacity expansions and strong government incentives.
Why are automotive displays important for driver IC vendors?
Vehicles now rely on multiple high-resolution screens for instrument clusters and infotainment, pushing automotive driver IC demand at a 15.25% CAGR and supporting higher ASPs.
How does MicroLED technology influence the display driver market?
MicroLED panels require precise current control and higher channel density, creating new revenue streams for vendors that can supply advanced drivers for 20,000 nit brightness targets.
What challenges do display driver suppliers face at advanced nodes?
Sub-40 nm foundry slots are scarce because AI chips dominate wafer allocation, leading to supply constraints and reinforcing the need for strategic fab partnerships.
Will panel maker vertical integration reduce third-party driver IC demand?
Yes, as companies like Samsung Display and BOE design in-house drivers, the addressable pool for external vendors shrinks, pushing independents toward specialized niches like automotive safety and AR optics.
Page last updated on:


 Your data is secure and never sold or shared.



