Market Overview
| Study Period | 2020 - 2031 |
|---|---|
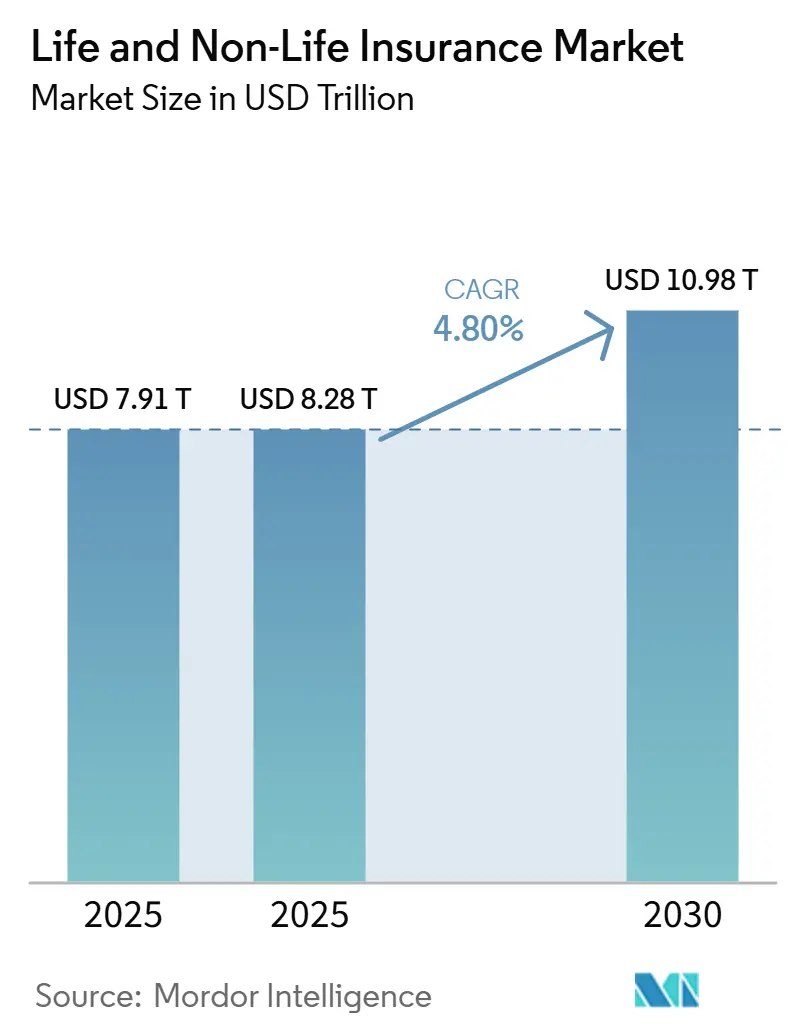
| Market Size (2026) | USD 8.28 Trillion |
| Market Size (2031) | USD 10.98 Trillion |
| Growth Rate (2025 - 2030) | 4.80% CAGR |
| Fastest Growing Market | Asia Pacific |
| Largest Market | North America |
| Market Concentration | Medium |
Major Players *Disclaimer: Major Players sorted in no particular order Image © Mordor Intelligence. Reuse requires attribution under CC BY 4.0. | |
Life and Non-Life Insurance Market Analysis by Mordor Intelligence
The Life And Non-Life Insurance Market size is projected to be USD 7.91 trillion in 2025, USD 8.28 trillion in 2026, and reach USD 10.98 trillion by 2031, growing at a CAGR of 4.80% from 2026 to 2031.
The market size projection reflects growing demand across both personal and commercial risk classes. Regulatory pressure, AI-driven underwriting, and climate-focused product innovation are the main forces rewriting competitive rules, while digital distribution compresses value chains and elevates cost-efficiency benchmarks. Insurers in mature regions accelerate behavioral pricing initiatives to defend profitability, whereas emerging economies harness embedded micro-insurance and mobile money ecosystems to close long-standing protection gaps. Telematics-based auto plans, unit-linked pension products, and parametric catastrophe solutions collectively underpin this transformation, reinforcing the life and non-life insurance market’s medium-term growth outlook. Investor appetite remains buoyant as capital-light, software-enabled carriers demonstrate faster break-even timelines than legacy peers.
Key Report Takeaways
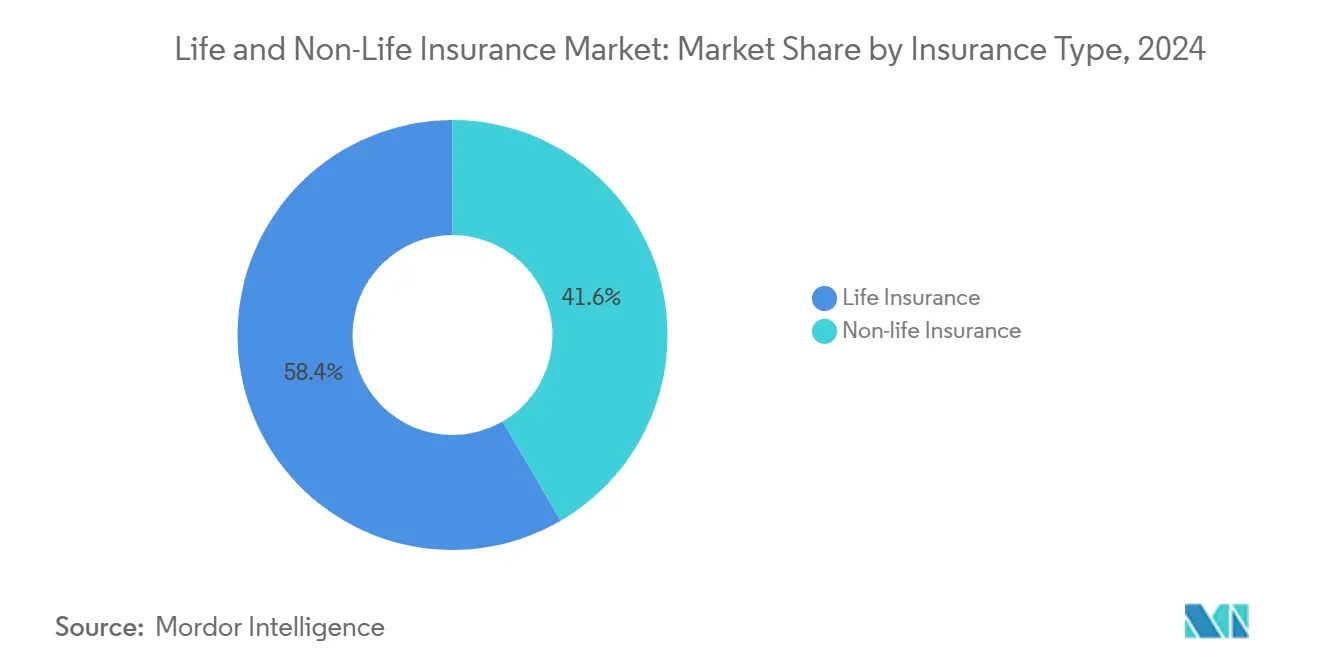
- By insurance type, non-life products held 58.43% of the life and non-life insurance market share in 2024. In comparison, life insurance is forecast to expand at a 5.45% CAGR through 2030, the fastest of any major segment.
- By customer segment, retail accounted for 65.46% of the life and non-life insurance market size in 2024, while corporate business leads with a 6.54% CAGR to 2030.
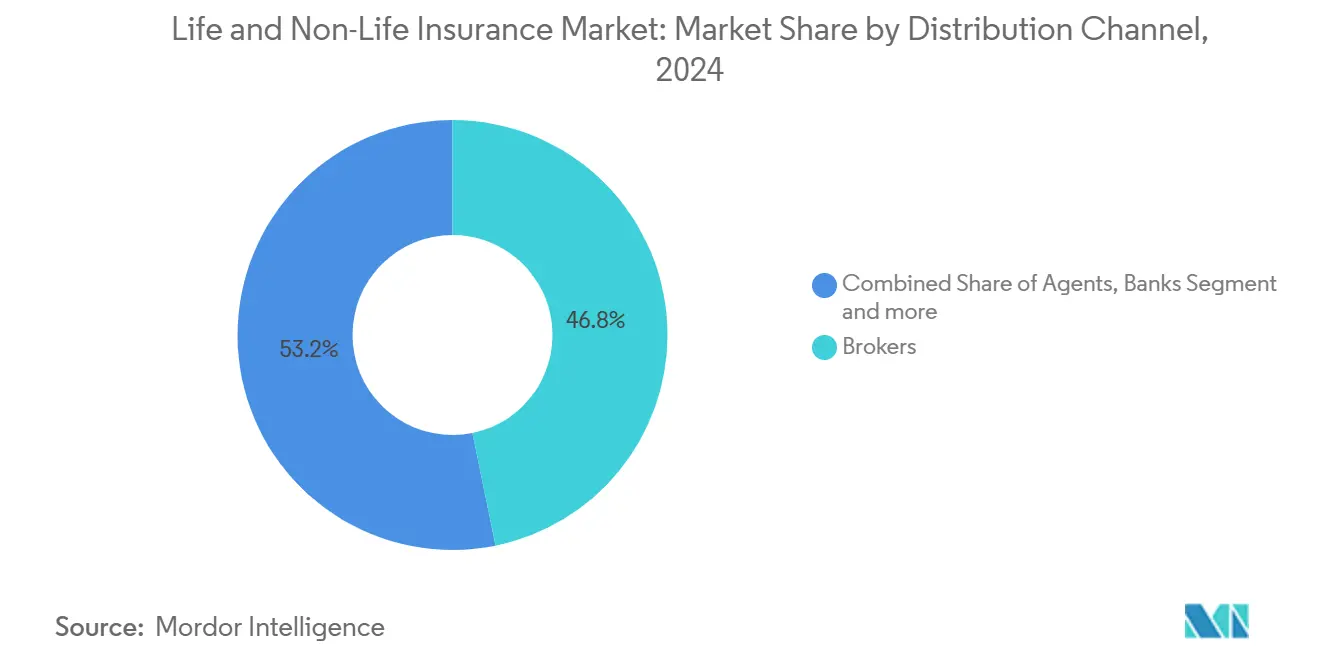
- By distribution channel, brokers captured 46.76% revenue share in 2024; direct sales outpace all other channels at a 6.75% CAGR through 2030.
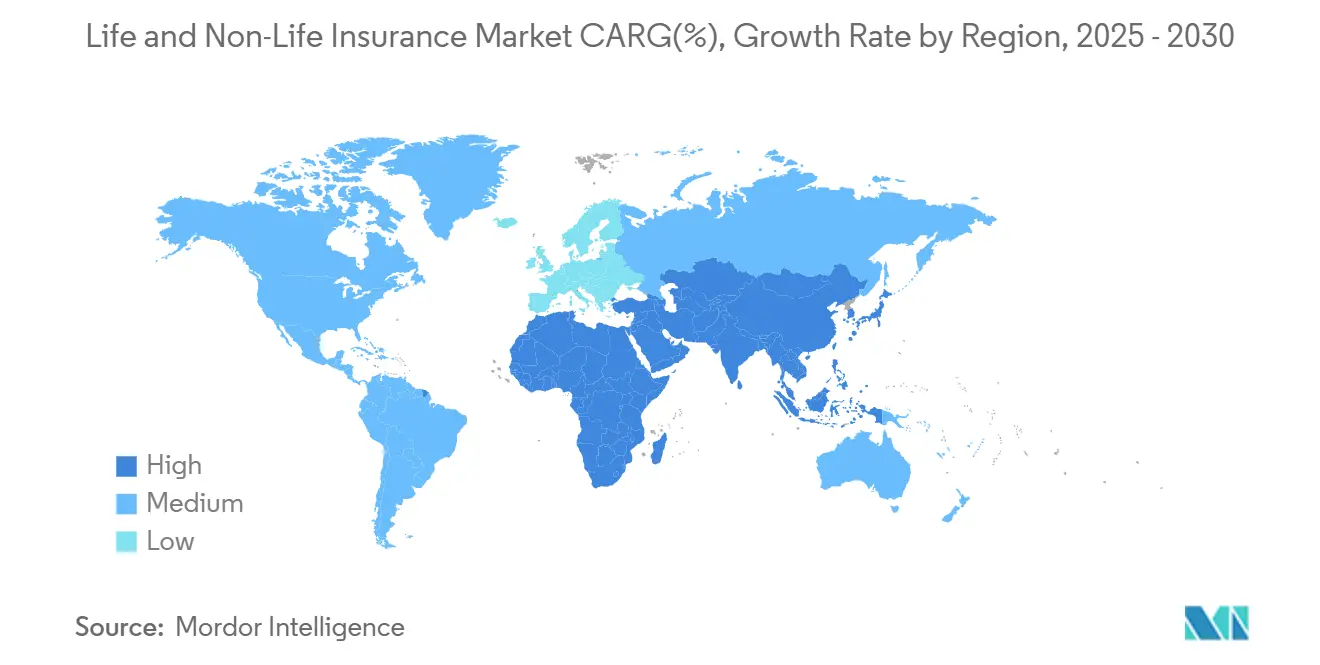
- By region, North America commanded 38.43% of 2024 premiums, whereas Asia-Pacific is projected to grow 7.34% annually to 2030.
Note: Market size and forecast figures in this report are generated using Mordor Intelligence’s proprietary estimation framework, updated with the latest available data and insights as of January 2026.
Global Life and Non-Life Insurance Market Trends and Insights
Drivers Impact Analysis*
| Driver | ( ~ ) % Impact on CAGR Forecast | Geographic Relevance | Impact Timeline |
|---|---|---|---|
| Usage-based motor insurance adoption | +1.2% | North America & Europe | Medium term (2-4 years) |
| Middle-class pension demand for unit-linked life plans | +0.8% | Asia-Pacific ex-Japan | Long term (≥ 4 years) |
| Climate-resilient property covers | +0.6% | Australia & Japan; spillover to wider APAC | Short term (≤ 2 years) |
| Embedded micro-insurance on e-commerce sites | +0.5% | Africa; expansion into Latin America | Medium term (2-4 years) |
| Foreign-ownership liberalization & solvency reforms | +0.4% | GCC states; potential MEA extension | Short term (≤ 2 years) |
| AI-driven underwriting efficiencies | +0.3% | Europe; global uptake thereafter | Medium term (2-4 years) |
| Source: Mordor Intelligence | |||
Expanding Middle-Class Pension Demand for Unit-Linked Life Products
Asia’s 1.8 billion middle-income consumers increasingly prioritize retirement savings. India’s ULIP premiums reached USD 45 billion in 2024, up 28% from the prior year, while China posted 22% growth despite tighter investment-linked rules[1]Insurance Regulatory and Development Authority of India, “Annual Report 2024,” irdai.gov.in. Younger cohorts prefer hybrid protection-plus-investment structures over pure term policies, driving insurers to launch ESG-themed portfolios in markets such as South Korea and Singapore. The shift reduces reliance on state pensions and pushes life offices toward fee-based revenue, supporting higher capital-efficiency ratios and strengthening the life and non-life insurance market’s profitability trajectory.
Climate-Resilient Property Covers Following Regulatory Action
Australia’s 2024 climate-risk disclosure mandate obliged carriers to stress-test book solvency against 1-in-200-year scenarios, prompting rapid deployment of parametric flood, bushfire, and cyclone covers. Japan’s Financial Services Agency enforced a 150% solvency buffer for catastrophe-exposed portfolios, catalyzing adoption of satellite imagery and blockchain-enabled claims automation that lowered settlement times from weeks to days[2]Australian Prudential Regulation Authority, “Climate Risk Disclosure Requirements 2024,” apra.gov.au. Parametric premiums grew 45% across APAC in 2024, favoring insurers with advanced hazard modeling and nudging legacy players to re-price or exit high-risk geographies.
Embedded Micro-Insurance Integration on E-commerce Platforms
Micro-insurance penetration in sub-Saharan Africa reached 12% in 2024, fueled by mobile wallets and checkout-embedded offers that strip distribution friction to near zero. BIMA already protects 45 million lives across 15 countries, while Milvik covers 2.8 million ride-hailing drivers[3]BIMA, “Annual Report 2024,” bima.com. With monthly premiums starting at USD 0.50, mobile operators expand revenue via insurance commissions and reduce churn through value-added services. Nigeria leads adoption with 8.5 million active policies, proving the embedded route can leapfrog agency networks and open a funnel toward comprehensive policies as disposable incomes rise.
Usage-based Motor Insurance Adoption in North America & Europe
Telematics penetration stood at 23% in North America and 18% in Europe by 2024, shifting the pricing paradigm from demographic proxies to real-time behavioral scoring. Progressive processed 15 million active telematics policies that delivered 40% higher margins relative to traditional auto contracts, while European peers achieved 12% lower claims frequency thanks to in-vehicle coaching feedback loops[4]Progressive Corporation, “Annual Report 2024,” progressive.com. Regulators championed the model to curb discriminatory tariff structures, and recent GDPR consent templates unlocked seamless data flows across the EU. With continuous mileage and braking data now normalized in underwriting workflows, fixed-premium products are likely to become niche offerings reserved for residual risk pools by 2028.
Restraints Impact Analysis*
| Restraint | ( ~ ) % Impact on CAGR Forecast | Geographic Relevance | Impact Timeline |
|---|---|---|---|
| Low interest-rate margin compression | −0.7% | Japan; spillover to other developed markets | Long term (≥ 4 years) |
| Rising catastrophe reinsurance costs | −0.5% | U.S. coastal states | Short term (≤ 2 years) |
| Bancassurance litigation | −0.4% | Latin America | Medium term (2-4 years) |
| Data-privacy limits on behavioral pricing | −0.3% | Europe & Brazil | Medium term (2-4 years) |
| Source: Mordor Intelligence | |||
Low Interest-Rate Margin Compression in Japan
Persistently negative yields dragged average investment returns for Japanese life portfolios down to 1.2% in 2024, forcing carriers to raise premium rates by up to 15% and drop guaranteed returns on legacy whole-life contracts written in earlier, higher-rate eras, accelerating the pivot to overseas bonds, variable annuities, and foreign-currency products. Given similar demographic and yield profiles, life offices in Western Europe witness parallel profitability stress, heightening the urgency to diversify asset allocations and reduce capital-intensive guarantees. This shift underscores the increasing role of international diversification in maintaining solvency ratios under prolonged low-yield conditions. At the same time, regulators are closely monitoring the systemic risks posed by large-scale reallocations into higher-volatility foreign assets.
Rising Cat-Re Costs on U.S. Coastal Property Lines
Catastrophe reinsurance for U.S. coastal exposures jumped 35% in 2024, lifting Florida homeowner rates 42% year on year and prompting large multi-state carriers to stop writing new coastal policies. Hurricane Ian’s USD 50 billion insured loss in 2022 and Hurricane Debby’s USD 28 billion bill in 2024 re-priced Florida and Gulf Coast risks sharply, stretching state residual markets. Limited capital inflows into retrocession layers push cedents to retain bigger net shares, shrinking underwriting capacity exactly where property development is booming, thereby dampening top-line expansion potentials in the life and non-life insurance market’s single largest non-life sub-class.
*Our forecasts treat driver/restraint impacts as directional, not additive. The impact forecasts reflect baseline growth, mix effects, and variable interactions.
Segment Analysis
By Insurance Type: Life Products Gain Momentum on Pension Demand
Life coverage registered a 5.45% CAGR outlook, outpacing the broader life and non-life insurance market despite non-life holding a 58.43% share in 2024. The growth differential stems from Asia’s middle-class retirement planning gap, which lifted ULIP volume 32% in India and 28% across Southeast Asia in 2024. At the segment level, ULIPs now contribute 52% of new life premium in fast-growing Asian economies, while traditional whole-life sales stagnate amid yield compression in developed countries. Carriers refine product mixes toward variable annuities, equity-linked endowments, and ESG-screened funds that resonate with younger policyholders. Meanwhile, the life and non-life insurance market size for non-lifelines continues to rise with motor and health accounting for 61% of non-life premiums, but profit margins in climate-sensitive property books narrow as cat-loss frequency escalates.
Non-life growth remains driven by mandatory motor rules, telematics discounts, and government-backed health expansion in emerging economies. Telematics mileage scoring created a 2-point loss-ratio advantage versus flat-rated policies in 2024. Health insurance premiums rose 14% in markets where public health infrastructure lags, notably Indonesia and Nigeria. Liability lines benefit from heightened corporate governance standards and cross-border litigation exposures. Specialty lines such as cyber and trade credit show double-digit annual growth, but the aggregate share of the life and non-life insurance market remains below 5%, leaving ample white-space for product innovation.


By Customer Segment: Corporate Risk Sophistication Accelerates Uptake
Corporate programs accounted for 34.54% of global premiums in 2024 and are forecast to expand 6.54% annually to 2030, the fastest among customer classes. Multinationals increasingly seek parametric business-interruption layers and cyber towers after pandemic and ransomware events underscored supply-chain fragility. Directors & officers liability and environmental impairment policies gain traction as ESG disclosure norms tighten. Risk advisory bundling enables brokers to command higher fees and reinforces stickiness at renewal. Consequently, the life and non-life insurance market share tied to corporate buyers rises through 2030 even though retail still dominates in absolute terms.
Retail demand remains resilient but price sensitive. Embedded insurance attached to e-commerce carts and ride-hailing apps funnels millions of first-time buyers in Africa and Southeast Asia. Low-ticket accident and handset covers cultivate trust and data that later convert into higher-margin motors and health plans. Digital onboarding slashes acquisition costs by up to 60% relative to agency sales, freeing marketing budgets for personalized offers that enhance lifetime value.
By Distribution Channel: Direct Digital Paths Challenge Broker Primacy
Brokers retained 46.76% of 2024 revenue, anchored by complex commercial placements where expert negotiation and global licensing are critical. Mega-broker consolidation tightened supply but widened capability sets around cyber analytics and climate scenario modeling. However, the life and non-life insurance market size flowing through direct channels is climbing at a 6.75% CAGR, fueled by mobile quote-bind processes and AI chatbots that compress turnaround times from days to minutes. In life products, straight-through underwriting for term policies under USD 500 thousand sum assured now achieves 95% auto-decision rates in leading platforms, shrinking agent commissions materially.
Banks and agents retain niche relevance in affluent customer strata and complex wealth-transfer cases. Bancassurance enjoys protected footprints in markets like France and Indonesia but faces class-action scrutiny in Latin America over mis-selling cases, a restraint that cuts 0.4% points from the life and non-life insurance market CAGR forecast.
Geography Analysis
North America controls 38.43% of 2024 global premiums, reflecting deep penetration across life, health, and property lines. U.S. carriers invested USD 2.8 billion in InsurTech capabilities in 2024, mainly in AI underwriting, cyber scoring, and climate analytics. Nevertheless, regulatory patchwork across 50 states inflates compliance overheads, and record cat losses challenge underwriting profitability in coastal zones. Canada shows steady growth through pension auto-enrollment and public-private healthcare co-pay schemes.
Asia-Pacific is the fastest-growing region at 7.34% CAGR, fueled by demographic tailwinds, urbanization, and inclusive finance policies. China’s market grew 8.2% in 2024, aided by solvency reforms and foreign ownership liberalization. India’s 12.5% premium growth derived from digital aggregator expansion and 100% FDI allowances in life insurance. Southeast Asian insurers differentiate through mobile policy lockers and pay-per-use micro-covers, enhancing penetration among gig-economy workers. Climate-driven cat risk intensifies property pricing in Australia and typhoon-exposed Japan, but parametric innovation cushions capacity shortages.
Europe posted modest gains amid strict GDPR data-governance rules and Solvency II capital duties. ESG-linked insurance products comprised 23% of 2024 new premiums, illustrating demand for sustainability-aligned risk transfer. Brexit forced UK-domiciled carriers to establish EU subsidiaries to preserve passporting rights, raising cost bases yet increasing optionality to write pan-European specialty lines. Central & Eastern Europe exhibits higher growth as rising wages spur first-time life-policy acquisition.
Middle East & Africa remain underpenetrated but promising. GCC states liberalized foreign ownership and implemented risk-based capital frameworks, spurring global reinsurers to co-locate modeling hubs in Dubai and Riyadh. Sub-Saharan Africa’s micro-insurance successes in Nigeria, Kenya, and Ghana validate embedded distribution as the region’s catalyst for broader protection.

Competitive Landscape
Top 10 carriers captured more than one-third of 2024 global premiums, signaling moderate concentration where scale confers data advantages yet room exists for insurgent differentiation. All-lines conglomerates such as Allianz, AXA, and Ping An leverage multi-distribution footprints and bank ties to amortize digital investments across continents. Ping An’s Good Doctor ecosystem integrates health tech, tele-consults, and dynamic underwriting, lifting renewal retention to 92% in pilot markets. Allianz applies AI triage to 58% of property-damage claims, trimming average settlement timelines by 25%.
Tech adoption is the decisive battlefield. Progressive’s telematics engine analyzes 14 billion miles yearly, cutting loss ratios by 15% and fueling a 1.2% positive impact on the life and non-life insurance market’s overall CAGR. Lemonade’s AI Jim settled 30% of small-property claims instantaneously in 2024, resetting customer satisfaction benchmarks. Traditional carriers accelerate digital transformation or co-invest in InsurTechs to acquire missing capabilities; Zurich’s USD 500 million venture fund targets climate, cyber, and embedded startups.
Catastrophe risk capital is also reshaping competition. Swiss Re placed USD 1.8 billion of nat-cat bonds in late 2024, diversifying reinsurance capacity and lowering peak risk charges. With climate volatility rising, carriers wielding superior peril analytics and ILS relationships can defend property market share even as peers retrench from high-risk geographies.
Life and Non-Life Insurance Industry Leaders
Allianz SE
Ping An Insurance
AXA Group
China Life Insurance
UnitedHealth Group
- *Disclaimer: Major Players sorted in no particular order


Recent Industry Developments
- March 2025: Marsh McLennan closed a USD 7.75 billion purchase of McGriff Insurance Services, adding 3,200 staff and boosting middle-market broking clout.
- January 2025: Ping An debuted an AI-based health platform in Southeast Asia that calibrates premiums to biometric wearables data.
- December 2024: Nationwide bought Allstate’s voluntary benefits arm for USD 1.25 billion, adding 4 million covered employees.
- November 2024: Zurich launched a USD 500 million InsurTech VC fund to back parametric, cyber, and embedded innovators.


Global Life and Non-Life Insurance Market Report Scope
By Insurance Type
| Life Insurance | |
| Non-Life Insurance | Motor Insurance |
| Health Insurance | |
| Property Insurance | |
| Liability Insurance | |
| Other Insurance |
By Customer Segment
| Retail |
| Corporate |
By Distribution Channel
| Brokers |
| Agents |
| Banks |
| Direct Sales |
| Other Channels |
By Geography
| North America | United States |
| Canada | |
| Mexico | |
| South America | Brazil |
| Argentina | |
| Colombia | |
| Chile | |
| Rest of South America | |
| Europe | Germany |
| United Kingdom | |
| France | |
| Italy | |
| Spain | |
| BENELUX (Belgium, Netherlands, Luxembourg) | |
| NORDICS (Denmark, Finland, Iceland, Norway, Sweden) | |
| Rest of Europe | |
| Middle East & Africa | United Arab Emirates |
| Saudi Arabia | |
| South Africa | |
| Nigeria | |
| Rest of Middle East & Africa | |
| Asia-Pacific | China |
| India | |
| Japan | |
| South Korea | |
| Australia | |
| Southeast Asia (Singapore, Indonesia, Malaysia, Thailand, Vietnam, Philippines) | |
| Rest of Asia-Pacific |
| By Insurance Type | Life Insurance | |
| Non-Life Insurance | Motor Insurance | |
| Health Insurance | ||
| Property Insurance | ||
| Liability Insurance | ||
| Other Insurance | ||
| By Customer Segment | Retail | |
| Corporate | ||
| By Distribution Channel | Brokers | |
| Agents | ||
| Banks | ||
| Direct Sales | ||
| Other Channels | ||
| By Geography | North America | United States |
| Canada | ||
| Mexico | ||
| South America | Brazil | |
| Argentina | ||
| Colombia | ||
| Chile | ||
| Rest of South America | ||
| Europe | Germany | |
| United Kingdom | ||
| France | ||
| Italy | ||
| Spain | ||
| BENELUX (Belgium, Netherlands, Luxembourg) | ||
| NORDICS (Denmark, Finland, Iceland, Norway, Sweden) | ||
| Rest of Europe | ||
| Middle East & Africa | United Arab Emirates | |
| Saudi Arabia | ||
| South Africa | ||
| Nigeria | ||
| Rest of Middle East & Africa | ||
| Asia-Pacific | China | |
| India | ||
| Japan | ||
| South Korea | ||
| Australia | ||
| Southeast Asia (Singapore, Indonesia, Malaysia, Thailand, Vietnam, Philippines) | ||
| Rest of Asia-Pacific | ||


Key Questions Answered in the Report
How large is the life and non-life insurance market in 2025?
It reached USD 7.91 trillion and is projected to grow at 4.8% annually to 2031.
Which segment is expanding fastest?
Life products, propelled by Asia’s unit-linked pension demand, show a 5.45% CAGR through 2030.
Why is direct distribution gaining share?
Digital quoting and AI underwriting cut acquisition costs and offer instant policies, driving a 6.75% CAGR for direct channels.
What is the biggest restraint on profitability?
Persistently low interest rates, especially in Japan, compress investment returns and erode spreads on long-duration life liabilities.
How are insurers addressing climate risk?
They deploy parametric covers, satellite analytics, and catastrophe bonds to diversify exposure and accelerate claim settlement.
Page last updated on:


