Market Overview
| Study Period | 2020 - 2031 |
|---|---|
| Forecast Data Period | 2026 - 2031 |
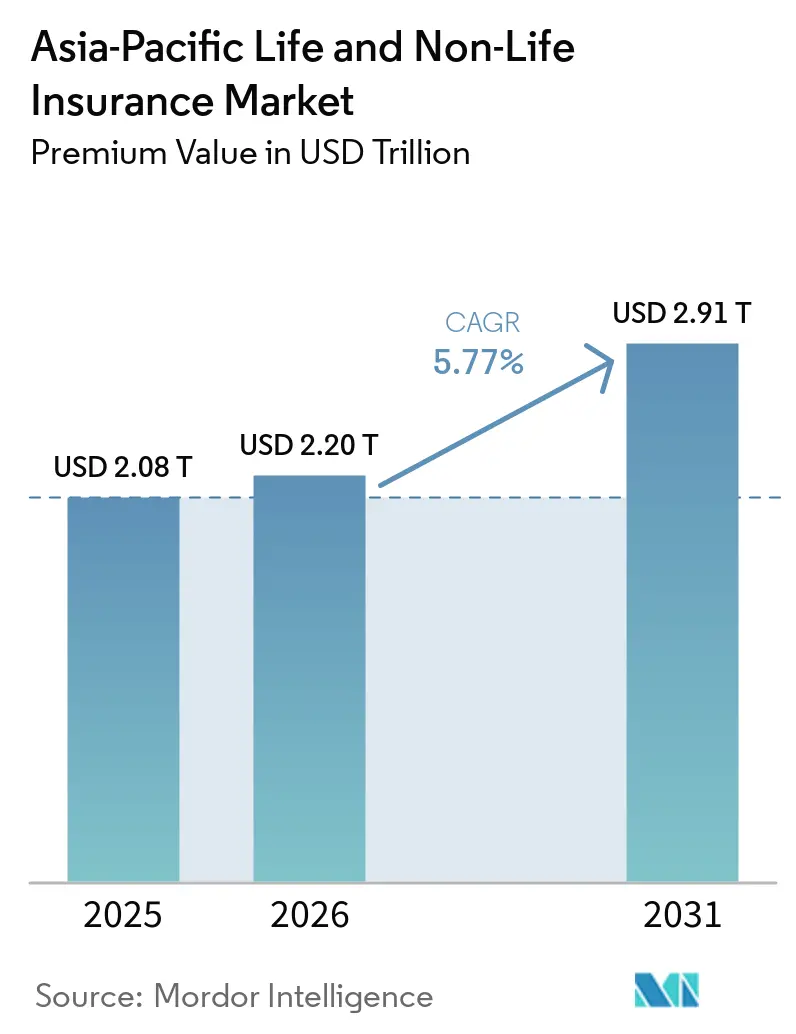
| Base Year Market Size (2025) | USD 2.08 Trillion |
| Market Size (2026) | USD 2.20 Trillion |
| Market Size (2031) | USD 2.91 Trillion |
| Growth Rate (2026 - 2031) | 5.77% CAGR |
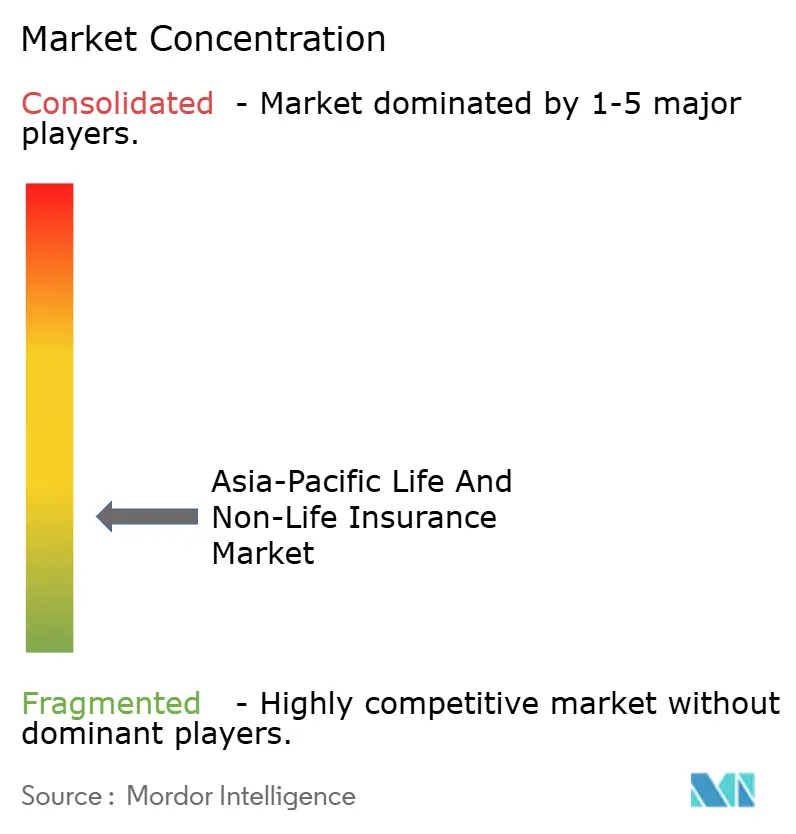
| Market Concentration | Low |
Major Players *Disclaimer: Major Players sorted in no particular order Image © Mordor Intelligence. Reuse requires attribution under CC BY 4.0. | |
Asia-Pacific Life and Non-Life Insurance Market Analysis by Mordor Intelligence
The Asia-Pacific Life And Non-Life Insurance Market size in terms of premium value is projected to be USD 2.08 trillion in 2025, USD 2.20 trillion in 2026, and reach USD 2.91 trillion by 2031, growing at a CAGR of 5.77% from 2026 to 2031.
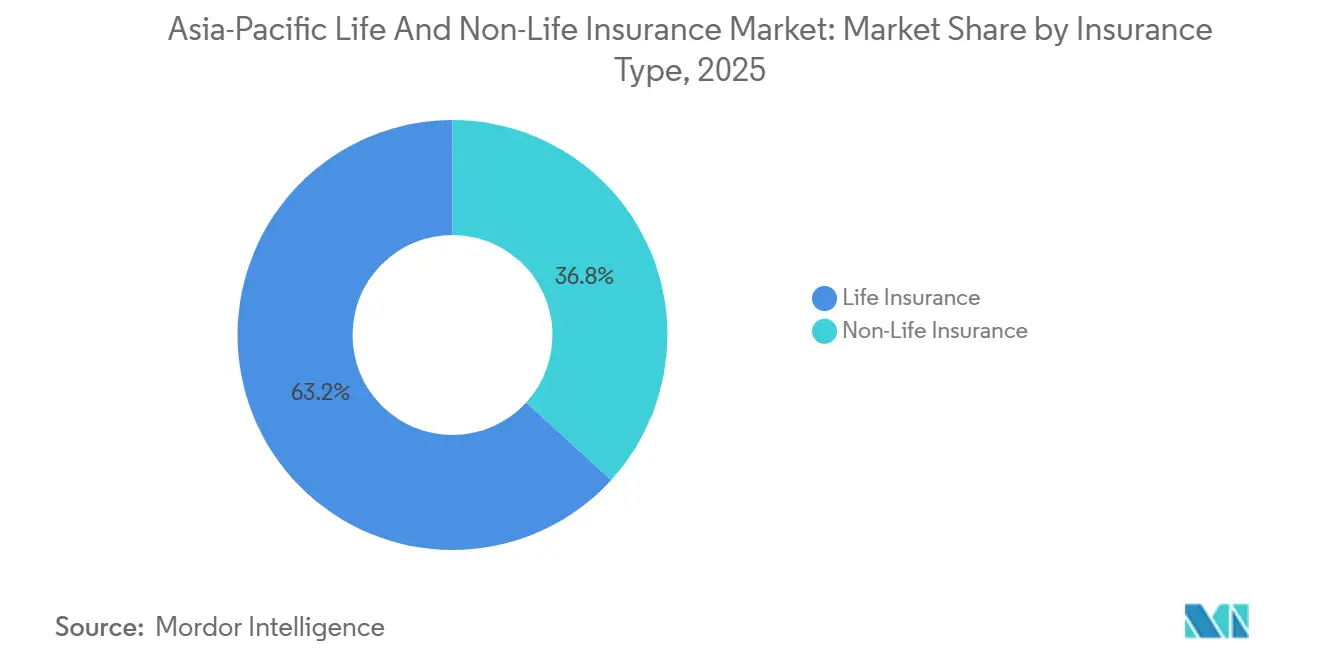
Solid demand for protection products, pension-linked savings, and medical coverage continues to support growth despite headwinds from elevated health claims inflation and tighter reinsurance terms in loss-affected markets. Life insurance accounted for a 63% revenue share in 2025, helped by China’s scale and the rebound of retirement and savings policies in Japan and South Korea. Within non-lifelines, health insurance is the standout with a 9.10% growth trajectory to 2031, propelled by medical trend rates that exceed premium adjustments across several markets. Digital and embedded distribution is scaling quickly, growing at 14.50% annually as super-apps, digital banks, and mobile-first insurers redesign onboarding and policy servicing for ease and speed. Motor exposure is rising with electric-vehicle adoption, while the Asia-Pacific life and non-life insurance market is also adjusting to climate risk pricing cycles, where rate changes now vary more by local loss activity than by region-wide capacity trends.
Key Report Takeaways
- By insurance type, life insurance led with 63.21% of the Asia-Pacific life and non-life insurance market share in 2025, whereas health insurance coverage is expanding at 9.10% CAGR to 2031.
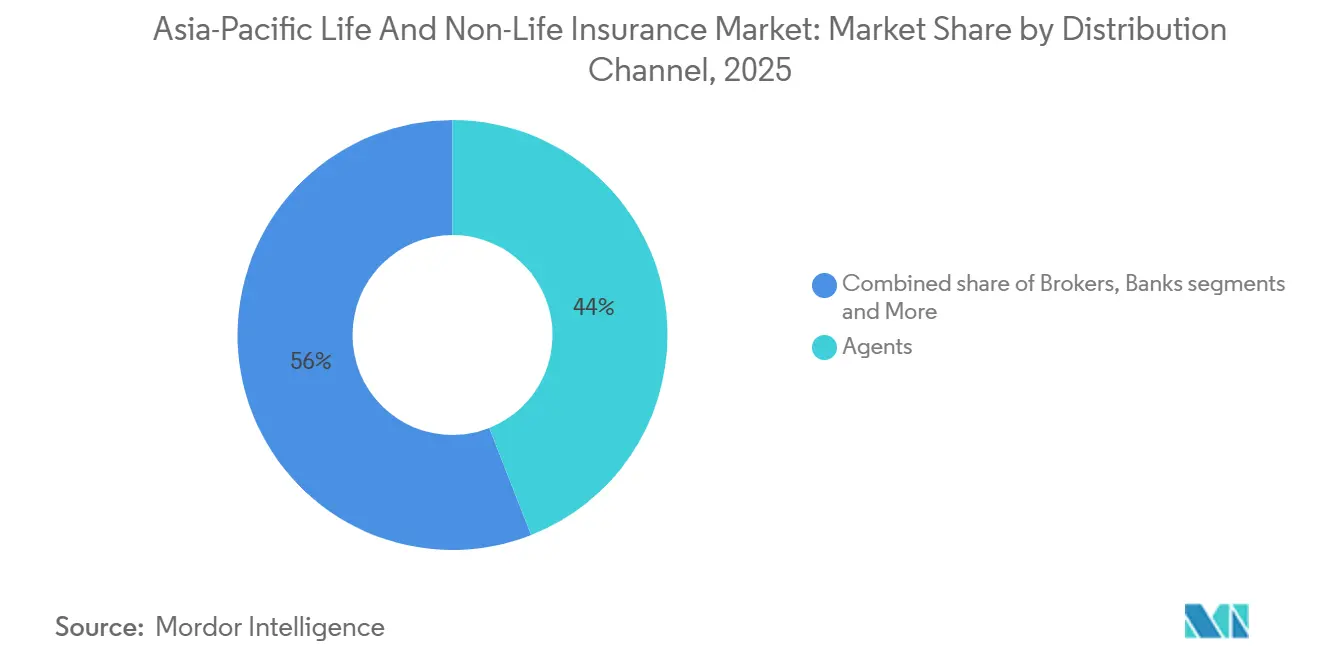
- By distribution channel, agency networks retained a 44.03% share of the Asia-Pacific life and non-life insurance market size in 2025, but digital-direct channels are growing fastest at 14.50% CAGR to 2031.
- By geography, China accounted for 47.55% of the Asia-Pacific life and non-life insurance market size in 2025, while India recorded the highest projected CAGR at 8.80% through 2031.
- By customer segment, retail customers held a 69.32% share of the Asia-Pacific life and non-life insurance market in 2025, whereas policies targeting the corporate segment are expected to expand at 7.80% CAGR to 2031.
Note: Market size and forecast figures in this report are generated using Mordor Intelligence’s proprietary estimation framework, updated with the latest available data and insights as of 2026.
Asia-Pacific Life and Non-Life Insurance Market Trends and Insights
Drivers Impact Analysis*
| Driver | (~) % Impact on CAGR Forecast | Geographic Relevance | Impact Timeline |
|---|---|---|---|
| Private health insurance expansion amid medical inflation and public scheme gaps | +1.8% | China's tier-two and tier-three cities, India's urban and rural areas, Indonesia, Malaysia, Thailand, the Philippines, and Vietnam | Medium term (2-4 years) |
| Life protection and retirement savings rebound under favorable rates and pension reforms | +1.4% | Japan, China, South Korea, India, Australia | Medium term (2-4 years) |
| Motor exposure growth and EV-led telematics and usage-based pricing adoption | +0.9% | China, India, Singapore, Thailand, Indonesia, Malaysia | Short term (≤ 2 years) |
| Climate and catastrophe risk repricing lifting property and engineering premiums | +0.7% | Japan, Australia, Philippines, Taiwan, Thailand, Vietnam, Indonesia | Short term (≤ 2 years) |
| Embedded insurance via super-apps and real-time payments rails scaling microcoverage | +0.6% | Indonesia, Singapore, China, Vietnam, Philippines, Malaysia, India | Medium term (2-4 years) |
| IFRS 17 and RBC modernization enabling product redesign and data-driven distribution | +0.4% | Hong Kong, Singapore, South Korea, Malaysia, Taiwan, China, and India from 2026 onward | Long term (≥ 4 years) |
| Source: Mordor Intelligence | |||
Private Health Insurance Expansion Amid Medical Inflation And Public Scheme Gaps
India’s health insurance premiums rose 27.17% year over year in January 2026, supported by a reduction of GST on retail policies from 18% to 5% and stronger Ayushman Bharat uptake that lifted gross written premiums by 37.78%[1]Insurance Business, “India health insurance premiums climb at start of 2026,” insurancebusinessmag.com. Aon reported India’s 2026 medical trend at 11.5%, higher than the global average, and noted that most consumers are moving to higher coverage limits to manage the costs of chronic conditions and specialty treatments. In China, medical trend rates are projected at 11.1% for 2026, and insurers are pivoting to participating health products with lower guarantees as benchmark rates fell through 2025, aligning product economics with a lower-yield environment while addressing claims inflation. Singapore, Malaysia, and the Philippines face some of the steepest 2026 medical trend rates in the region, with regulators adding cost-sharing through co-payments and deductibles to temper utilization and fraud. Swiss Re estimated Asia’s health protection gap at USD 258 billion in premium-equivalent terms as of 2024, signaling significant headroom for private cover, micro-policies, and group schemes to expand access[2]Swiss Re, “Asia Life & Health consumer survey 2025,” swissre.com. Policy frameworks like Malaysia’s affordable health roadmap and selective delays to co-insurance mandates in Indonesia indicate an ongoing balance between affordability, sustainability, and wider coverage.
Life Protection And Retirement Savings Rebound Under Favorable Rates And Pension Reforms
Japan’s life sector is on a 5.4% growth path through 2030, reaching USD 337.7 billion in direct written premiums as yields improved after the 2024 policy shift, lifting credited rates on yen-denominated savings products. China’s nationwide voluntary personal pensions, implemented in December 2024 with tax incentives and a favorable withdrawal structure, drew 72.8 million account openings by November 2024, and early corporate adoption signals rising interest in supplemental retirement plans. South Korea proposed raising National Pension Scheme contributions from 9% to 13% starting in 2026 with phased increases, targeting longer fund solvency and an improved income replacement rate. India’s pension reforms introduced longer waiting periods for certain withdrawals and a minimum balance rule, while the GST exemption on life and health premiums set in September 2025 supports better affordability and long-term compounding. Demographic aging across Japan and South Korea, together with India’s expanding senior cohort, is reinforcing persistent demand for annuities, health riders, and protection-backed savings policies in the Asia-Pacific life and non-life insurance market.
Motor Exposure Growth And EV-Led Telematics And Usage-Based Pricing Adoption
China’s new-energy vehicle premiums jumped 34% in 2025, yet rising repair and battery replacement costs drove motor loss ratios, which is pushing carriers toward usage-based pricing and advanced claims automation[3]Insurance Journal, “China’s EV boom saddles auto insurers with losses,” insurancejournal.com. India’s regulator enabled pay-as-you-drive and pay-how-you-drive models that now reward safer and lower-mileage motorists with premium discounts at renewal, strengthening segmentation and aligning price with behavior. Grab secured a general insurance license in Singapore in May 2025 and aims to leverage real-time trip and driving data across a large driver base to deliver usage-based motor coverage in a market where motor premiums rose due to inflation and EV uptake. Chinese regulators issued repairability and access guidelines to reduce costs and prevent coverage denial for compulsory schemes as automakers like BYD and Tesla expanded their participation in underwriting and data-enabled services. Southeast Asia continues to see momentum in telematics and embedded propositions that blend mobility with cover issuance at the point of need, reinforcing near-term exposure growth in the Asia-Pacific life and non-life insurance market. Insurers are also refining product design around EV risks, such as battery fires and specialized parts, to steady loss ratios, with new entrants building portfolios centered on the EV opportunity.
Climate And Catastrophe Risk Repricing Lifting Property And Engineering Premiums
Asia-Pacific recorded USD 73 billion in disaster losses in 2025, with only 12.3% insured, which keeps risk pricing sensitive to local loss patterns and primary carriers’ capital posture. Property-catastrophe rates eased on a risk-adjusted basis in several accounts where recent loss experience remained muted, while reinsurers continued to moderate pricing from a previous hard-market base. The Australian cyclone pool received 111,860 claims, yet average premiums in higher-risk areas declined from the pool’s inception, illustrating how targeted capacity can stabilize outcomes. Japan’s April 2025 renewals saw 10-15% risk-adjusted rate reductions in catastrophe and improved earthquake commission terms, pointing to normalization after past severe typhoon seasons. Regionally, alternative capital and strong reinsurer balance sheets supported optionality for cedants in loss-free programs, while loss-affected markets faced stricter terms and higher attachment points. This divergence reinforces underwriting discipline and encourages risk mitigation investment across property and engineering lines in the Asia-Pacific life and non-life insurance market.
Restraints Impact Analysis*
| Restraint | (~) % Impact on CAGR Forecast | Geographic Relevance | Impact Timeline |
|---|---|---|---|
| Reinsurance capacity and tight terms are raising NatCat rates and deductibles | -0.5% | Thailand, Taiwan, Philippines, Vietnam, Indonesia, catastrophe-exposed markets | Short term (≤ 2 years) |
| Bancassurance conduct rules curbing investment-linked sales | -0.7% | Vietnam, Hong Kong, Philippines, China, India | Medium term (2-4 years) |
| Health claims inflation outpacing premium rate adjustments | -0.6% | India, Singapore, Malaysia, Philippines, China | Short term (≤ 2 years) |
| IFRS 17 and RBC execution frictions at mid-tier carriers | -0.3% | Hong Kong, Singapore, Malaysia, South Korea; China, and India from 2026 onward | Medium term (2-4 years) |
| Source: Mordor Intelligence | |||
Reinsurance Capacity And Tight Terms Raising NatCat Rates And Deductibles, Pressuring Affordability
Asia-Pacific’s USD 73 billion in 2025 disaster losses carried only USD 9 billion in insured payouts, leaving a large uninsured gap that constrains appetite to deploy capacity at price levels that would close the gap quickly[4]The Business Times, “Only 12.3% of Asia-Pacific natural disaster losses for 2025 were insured,” businesstimes.com.sg. Taiwan’s 7.2 magnitude earthquake in April 2024 caused USD 1.3 billion in overall losses with significant business interruption, which drove higher pricing and stricter terms at subsequent renewals relative to markets with benign loss experience. Thailand also saw rate increases after seismic and typhoon activity, even as global reinsurer capital reached record levels by late 2025. The Philippines’ property segment is experiencing stronger growth but faces rising claims tied to recurring severe weather, with insurers balancing coverage breadth against affordability pressures. Australia’s cyclone pool saw large claim volumes in 2025, yet government-backed capacity helped lower premiums in higher-risk areas compared with the period before the pool’s establishment. At January 2026 renewals, softening was evident for many loss-free accounts, but deductibles and co-participations rose, and certain catastrophe-exposed cedants faced flat to double-digit increases, underscoring heterogeneous outcomes within the Asia-Pacific life and non-life insurance market.
Bancassurance Conduct And Product Rules Curbing Investment-Linked Sales In Select Markets
Vietnam’s legal changes barred banks from linking insurance sales with core banking services, which coincided with a fall in bancassurance revenue and a decline in life premiums. Hong Kong’s Insurance Authority capped referral fees for participating policies at a 50% benchmark and introduced commission spreading to reduce mis-selling risks from January 2026. The Philippines restricts certain bancassurance activities to licensed entities and confines variable unit-linked sales to qualified financial conglomerates, limiting product options at bank counters. India’s December 2025 insurance law amendments expanded lifestyle governance provisions to other insurance classes and raised FDI in insurers to 100%, which is reshaping distribution governance and oversight. Singapore has tightened the use of insurer brands by third parties and restricted volume-based remuneration to align incentives with fair-dealing expectations. The cumulative effect is a more conduct-focused environment that tempers near-term investment-linked momentum while promoting persistency and better post-sale servicing in the Asia-Pacific life and non-life insurance market.
*Our forecasts treat driver/restraint impacts as directional, not additive. The impact forecasts reflect baseline growth, mix effects, and variable interactions.
Segment Analysis
By Insurance Type: Health Premiums Outpace Life’s Traditional Dominance
Life insurance held 63.21% of the Asia-Pacific life and non-life insurance market share in 2025, supported by demand for long-term protection, annuities, and savings products in large markets such as China and Japan. The Asia-Pacific life and non-life insurance market size for health insurance is set to grow at a 9.10% CAGR through 2031, as medical inflation, chronic disease prevalence, and regulatory nudges for employer coverage increase both frequency and severity of claims and drive premium expansion. Motor lines are benefitting from higher vehicle sales and EV penetration in China and select ASEAN markets, although claim costs linked to batteries and specialized parts remain a profitability challenge. Property premiums are adjusting in catastrophe-exposed markets, where underwriting discipline and reinsurance structures are steering rate and deductible decisions at renewal. Liability and specialty lines are growing from smaller bases as corporate risk transfer preferences broaden, with adoption aided by broker placement and structured solutions.
Health’s outperformance is visible where regulators and employers introduce co-payments, deductibles, and plan redesign to share costs and encourage responsible utilization. India’s retail health segment accelerated into 2026 on the back of a tax-cut tailwind and better digital onboarding, while group health renewal pricing has become more granular, incorporating utilization data and benefit caps. Motor insurers across China and India are deploying behavior-based pricing and telematics to differentiate risk and mitigate loss trends as electrification and usage patterns evolve. The Asia-Pacific life and non-life insurance market continues to see product innovation in savings and protection policies as yield environments change, with participating and unit-linked structures gaining share where guaranteed returns were lowered. These shifts point to a more data-driven and modular approach to benefit design through 2031 in both life and non-life portfolios in the Asia-Pacific life and non-life insurance market.


By Customer Segment: Corporate Group Health Gains As Employers Absorb Inflation
Retail customers held 69.32% of value in 2025 across individual life, retail health, motor, and property covers, reflecting entrenched consumer demand and multi-decade savings needs. Corporate segments, led by group health, are projected to grow at 7.80% annually to 2031 as employers adopt flexible benefits, co-payment designs, and tighter plan governance to handle double-digit medical trend rates in markets like Singapore and Malaysia. India’s medical trend moderated into 2026, yet retail health premiums still climbed strongly at the start of the year, while group health expanded at a steadier pace due to benefit optimization and claims controls. Non-resident Indians are buying more domestic health policies, enabled by digital onboarding, pricing advantages, and the availability of family-floater plans. Aging in North Asian markets sustains demand for annuities and critical-illness riders in both retail and workplace settings, while corporate wellness and prevention programs are becoming standard to dampen frequency and severity.
Corporate demand is also spurred by competition for talent, with supplementary benefits used to differentiate in markets that run statutory health systems with limited scope for enhanced services. Employers are increasingly turning to claims analytics, fraud controls, and network management to keep unit costs in check as specialty pharmaceuticals and new procedures expand covered benefits. Insurers are aligning plan designs with preventive care to reduce downstream acute episodes while using digital tools to simplify onboarding and servicing for HR teams. The Asia-Pacific life and non-life insurance market is therefore seeing a gradual mix shift toward corporate-led platforms that emphasize cost-sharing and long-term health outcomes alongside traditional retail propositions. This shift reinforces recurring premium stability in group lines while leaving space for retail products to serve high-intent segments in the Asia-Pacific life and non-life insurance market.
By Distribution Channel: Digital And Embedded Disrupt Agent-Led Sales
Agents held 44.03% in 2025, anchored by advisory-led sales in life protection and complex needs, while digital and embedded channels are the fastest-growing with a 14.50% CAGR through 2031 as super-apps, digital banks, and online direct platforms capture transactional flows. Singapore’s balanced distribution mix shows robust roles for bank representatives, financial advisers, and tied agents, while new models like Grab’s usage-based motor plan target drivers inside a large mobility ecosystem. Bancassurance remains important in markets with mature banking footprints, but tighter conduct rules in Vietnam and Hong Kong are reshaping incentives and disclosure, which could slow high-commission dependent products. Direct digital sales are rising as instant underwriting, automated service, and embedded point-of-need coverage improve conversions without branch infrastructure. Regulatory frameworks now recognize new intermediaries such as managing general agents in India’s 2025 reforms, opening operational flexibility for risk-bearing partnerships.
Agents remain essential for bespoke advice, particularly in life protection, critical illness, and annuity planning, as many markets keep strict licensing for face-to-face recommendations. Hybrid advice models are emerging as banks co-sell with insurer specialists, and tied agents employ digital tools for prospecting and policy service. Embedded insurance is broadening its reach by placing simple covers in checkout flows, ride-hail dashboards, and mobile wallets, which reduces acquisition costs and lifts attachment rates in the Asia-Pacific life and non-life insurance market. As conduct standards for referral fees, commission timing, and brand use tighten, the channel mix is shifting toward balanced multi-channel orchestration rather than one dominant model. Over 2026-2031, the Asia-Pacific life and non-life insurance market will likely maintain a significant agent share while digital and embedded channels continue to scale from a smaller base.
Geography Analysis
China retained a 47.5% regional position in 2025 within the Asia-Pacific life and non-life insurance market share, reflecting the size and depth of its life segment as insurers adjust product guarantees and distribution following regulatory shifts. Life premium growth was modest at 1% in the early part of 2025, while non-life expanded 5% as policy incentives and EV adoption supported motor and related covers. New-energy vehicle premiums rose 34% in 2025, yet higher loss ratios implied continued pressure to refine pricing and claims operations. Repricing in property and engineering has been guided by local loss experience and broader reinsurance conditions, with cedants in loss-free portfolios seeing improved terms relative to high-severity markets. China’s rollout of voluntary personal pensions is expected to lift annuity demand and stabilize savings flows over the medium term in the Asia-Pacific life and non-life insurance market.
India is the fastest-growing major market through 2031 and is seeing policy support through higher FDI caps, governance modernization, and targeted tax changes that improve affordability for life and health products. Health insurance premiums rose at the start of 2026 due to GST cuts on retail policies and broader adoption in lower-income segments under national schemes, while group health renewals continue to refine co-pays and deductibles. Japan’s life market is projected to grow at 5.4% to USD 337.7 billion by 2030 as insurers shift allocations to higher-yield fixed income and refresh credited rates on yen policies. Regulatory work on offshore reinsurance structures and an economic-value-based solvency regime is guiding capital management for Japan’s life carriers and reinsurers. The Asia-Pacific life and non-life insurance market in these economies is aligning product strategies with interest-rate moves, demographic pressures, and capital frameworks to stabilize growth through 2031.
Southeast Asia presents a diverse picture with Singapore’s life market up 11.3% in 2025 and strong take-up of integrated health plans, Malaysia’s takaful advancing, Thailand’s life growth stabilizing, Indonesia’s life returning to expansion, and the Philippines rising in 2025. Hong Kong’s RBC regime went live and is already influencing product and asset allocation as firms refine capital strategies under the new three-pillar framework. Australia’s cyclone pool is proving effective in lowering premiums for higher-risk regions even as claims volumes rose in 2025, supporting access and affordability in catastrophe-exposed communities. Across these geographies, health cost trends, catastrophe exposure, and digital distribution gains are the most visible influences on the Asia-Pacific life and non-life insurance market into the 2026-2031 horizon.
Competitive Landscape
The Asia-Pacific life and non-life insurance market features moderate-to-high fragmentation at a regional level with concentration pockets by country, where China’s leading life carriers and Japan’s top non-life groups hold significant local shares while Southeast Asian markets remain more distributed. Strategic plays cluster around three patterns that are now common in the region, including digitization of tied and bank channels, embedded models at super-apps and digital banks, and niche specialists building capacity in parametric, cyber, and green risk solutions. The Asia-Pacific life and non-life insurance market is also influenced by local regulatory timelines such as RBC implementation and IFRS 17 adoption, which shape pricing, product design, and reinsurance use. Companies with stronger balance sheets and agile digital platforms are positioned to consolidate share as compliance and data-governance needs rise.
Several high-profile moves in 2025 and 2026 illustrate the pace of change. Grab received a general insurance license in Singapore as it prepared a usage-based motor offering for its driver base, showing how embedded models can challenge incumbents in personal lines. BNP Paribas Tianxing entered China’s P&C market in January 2026 with a product set tailored to the EV ecosystem, aligning underwriting with growth in new-energy vehicles. Japan’s carriers continued to optimize cat reinsurance programs and sponsor risk-transfer instruments as pricing normalized from a high base at April renewals.
Conduct and capital frameworks are shaping competitive behavior in key hubs. Hong Kong’s RBC program is prompting refinements to investment mixes, especially for long-duration liabilities, and encouraging product shifts from high guarantees toward participating and unit-linked structures in life. Bancassurance rules are tightening in markets that seek better customer outcomes, which may temporarily reduce new business in high-commission product categories and shift emphasis toward servicing and persistency. Across the Asia-Pacific, the players that combine rigorous underwriting, compliant distribution economics, and automated service capabilities are better placed to capture incremental share in the Asia-Pacific life and non-life insurance market through 2031.
Asia-Pacific Life and Non-Life Insurance Industry Leaders
Ping An Insurance Group
China Life Insurance Co.
AIA Group
Life Insurance Corp. of India
Tokio Marine Holdings, Inc.
- *Disclaimer: Major Players sorted in no particular order

Recent Industry Developments
- January 2026: BNP Paribas Tianxing Property and Casualty Insurance began operations in China with an auto insurance product suite designed for the new-energy vehicle ecosystem
- December 2025: India’s Sabka Bima Sabki Raksha Act 2025 took effect, lifting FDI in insurers to 100% and streamlining several governance and capital requirements to attract foreign investment
- May 2025: GrabInsure secured a general insurance license from Singapore’s Monetary Authority and joined the General Insurance Association as it prepared to launch usage-based motor offerings to drivers across Southeast Asia.
- July 2025: Singlife partnered with GXS Bank to embed complimentary group personal accident coverage at the point of investment inside GXS Invest


Research Methodology Framework and Report Scope
Market Definitions and Key Coverage
Mordor Intelligence defines the Asia-Pacific life and non-life insurance market as the total gross written premium generated by licensed insurers across all life products (term, whole, endowment, unit-linked, group) and non-life classes (motor, property & catastrophe, medical, personal accident, marine, aviation, crop, and specialty). The figures are expressed in current-year U.S. dollars and capture activity in China, India, Japan, South Korea, ASEAN, Australia, and the remaining regional markets.
Scope Exclusion: Reinsurance cessions and inward retrocession flows are kept outside the sizing to avoid double counting across carrier layers.
Segmentation Overview
- By Insurance Type
- Life Insurance
- Non-Life Insurance
- Motor Insurance
- Health Insurance
- Property Insurance
- Liability Insurance
- Other Insurance
- By Customer Segment
- Retail
- Corporate
- By Distribution Channel
- Brokers
- Agents
- Banks
- Direct Sales
- Other Channels
- By Geography
- India
- China
- Japan
- Australia
- South Korea
- South East Asia (Singapore, Malaysia, Thailand, Indonesia, Vietnam, and Philippines)
- Rest of Asia-Pacific
Detailed Research Methodology and Data Validation
Primary Research
Mordor analysts interviewed underwriters, bancassurance heads, insurtech founders, and market supervisors across six key economies. These conversations validated channel mix shifts, average policy values, and digital uptake trends, while clarifying gray areas in regulator statistics and fine-tuning our assumptions on lapse ratios and health-line loss inflation.
Desk Research
Our analysts began with high-frequency regulator filings and statistical yearbooks issued by bodies such as the China Banking and Insurance Regulatory Commission, the Insurance Regulatory and Development Authority of India, the Financial Services Agency of Japan, and the Australian Prudential Regulation Authority, which deliver audited premium pools and solvency data. Macro drivers, GDP per capita, household saving rates, and demographic aging ratios were compiled from the World Bank, Asian Development Bank, and IMF databases.
To enrich competitive mapping, we pulled carrier level disclosures through D&B Hoovers, tracked daily news on Dow Jones Factiva, and reviewed actuarial journals plus trade association briefs from the Life Insurance Council of Australia and the General Insurance Association of Singapore. Many additional specialist and government sources were consulted; the list above is illustrative rather than exhaustive.
Market-Sizing & Forecasting
The baseline is established through a top-down reconstruction of regional premium pools, starting with country regulator totals, which are then segmented by line and converted using average annual exchange rates. Selective bottom-up roll-ups of the twenty largest insurers, supported by agency channel checks and sampled average selling price times volume tests, anchor and adjust the totals. Key variables fed into the model include insurance penetration (% of GDP), age 65 plus share, disposable income growth, motor vehicle parc, and online policy issuance share. Multivariate regression, cross-validated against a scenario analysis of regulatory reform pace, produces the 2025-2030 forecast path. Data gaps, such as missing mutual insurer disclosures, are bridged by peer benchmarks and expert estimates before final consolidation.
Data Validation & Update Cycle
Outputs pass through variance screening, historical back-casting, and a two-level analyst review. Where anomalies exceed preset thresholds, respondents are re-contacted. The model is refreshed annually, with ad-hoc updates triggered by major policy or currency events, ensuring clients receive a current, quality-checked view.
Why Mordor's Asia Pacific Life & Non-Life Insurance Baseline Stands Firm
Published insurance estimates often diverge because firms pick different premium definitions, geographic baskets, or refresh cadences. By anchoring every figure to regulator-verified pools and systematically layering validated adjustments, Mordor delivers a balanced, transparent baseline.
Key gap drivers with other publishers include limited country coverage, exclusion of life or mutual segments, inconsistent currency conversion, and shorter update cycles that miss recent premium rebounds in China and India.
Benchmark comparison
| Market Size | Anonymized source | Primary gap driver |
|---|---|---|
| USD 2.00 trillion (2025) | Mordor Intelligence | - |
| USD 523.15 billion (2024) | Regional Consultancy A | Covers only ten largest markets; omits mutuals and adjustment for inward reinsurance |
| USD 479.7 billion (2023) | Trade Journal B | Focuses solely on non-life premiums; excludes life lines and currency harmonization |
| USD 2.7 billion (2024) | Industry Tracker C | Relies on small listed-carrier sample; excludes state-owned and cooperative insurers |
These comparisons show that Mordor's disciplined scope selection, variable set, and annual refresh cycle produce a dependable benchmark that decision-makers can trace and replicate with confidence.


Key Questions Answered in the Report
What is the Asia-Pacific life and non-life insurance market size and growth outlook to 2031?
The Asia-Pacific life and non-life insurance market size was USD 2.08 trillion in 2025 and is projected to reach USD 2.91 trillion by 2031 at a 5.77% CAGR over 2026-2031.
Which insurance type is growing the fastest in Asia-Pacific through 2031?
Health insurance within non-life lines is the fastest, supported by high medical trend rates, cost-sharing reforms, and broader employer coverage.
How are distribution channels shifting across Asia-Pacific insurance?
Agents still lead by value, but digital and embedded models are expanding at a 14.50% CAGR through 2031, led by super-apps, digital banks, and direct online platforms.
Which markets are most influential in the regional premium pool?
China remains the largest by share, Japan is sizable in life, and India is the fastest-growing major market through 2031 under supportive reforms and digital adoption.
What reinsurance and catastrophe dynamics are shaping pricing in the near term?
Capacity is ample for loss-free programs with softening for many accounts, yet loss-affected markets face stricter terms, higher deductibles, and more attachment point discipline.
How are pension and interest-rate shifts affecting life products in the region?
Higher long-end yields and pension reforms in Japan, China, and South Korea are lifting credited rates, encouraging participating designs, and supporting annuity demand through 2031.
Page last updated on:


