
Lamps and Lighting Market Size and Share
Market Overview
| Study Period | 2020 - 2031 |
|---|---|
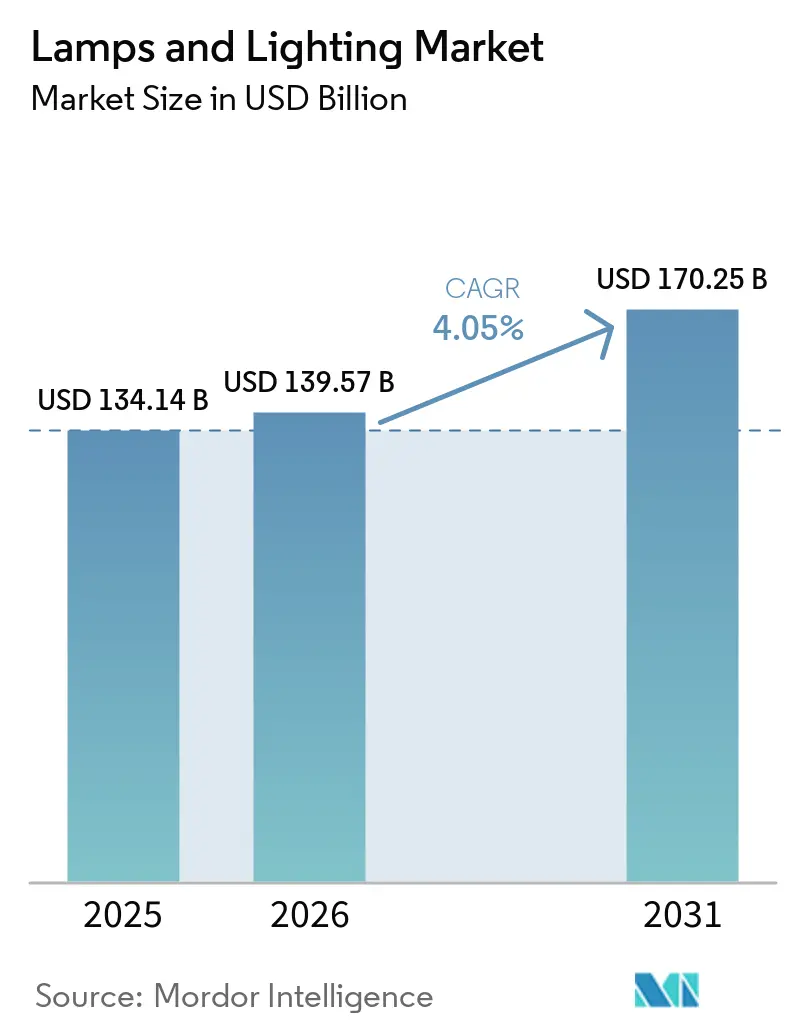
| Market Size (2026) | USD 139.57 Billion |
| Market Size (2031) | USD 170.25 Billion |
| Growth Rate (2026 - 2031) | 4.05 % |
| Fastest Growing Market | Asia Pacific |
| Largest Market | Asia Pacific |
| Market Concentration | Medium |
Major Players *Disclaimer: Major Players sorted in no particular order Image © Mordor Intelligence. Reuse requires attribution under CC BY 4.0. | |
Lamps and Lighting Market Analysis by Mordor Intelligence
Lamps and lighting market size in 2026 is estimated at USD 139.57 billion, growing from 2025 value of USD 134.14 billion with 2031 projections showing USD 170.25 billion, growing at 4.05% CAGR over 2026-2031. The market’s momentum stems from global regulations eliminating mercury-based technologies, rapid smart-building adoption, and continuous improvements in LED efficacy. Replacement demand is rising as first-generation LED products installed between 2015 and 2020 reach end-of-life, creating a second conversion wave that shifts buyer focus from basic efficiency to enhanced connectivity and color quality. Semiconductor innovation is compressing LED costs while unlocking premium niches such as micro-LED and human-centric lighting. Intensifying competition between traditional fixture makers and semiconductor suppliers is accelerating product convergence and service-oriented business models.
Key Report Takeaways
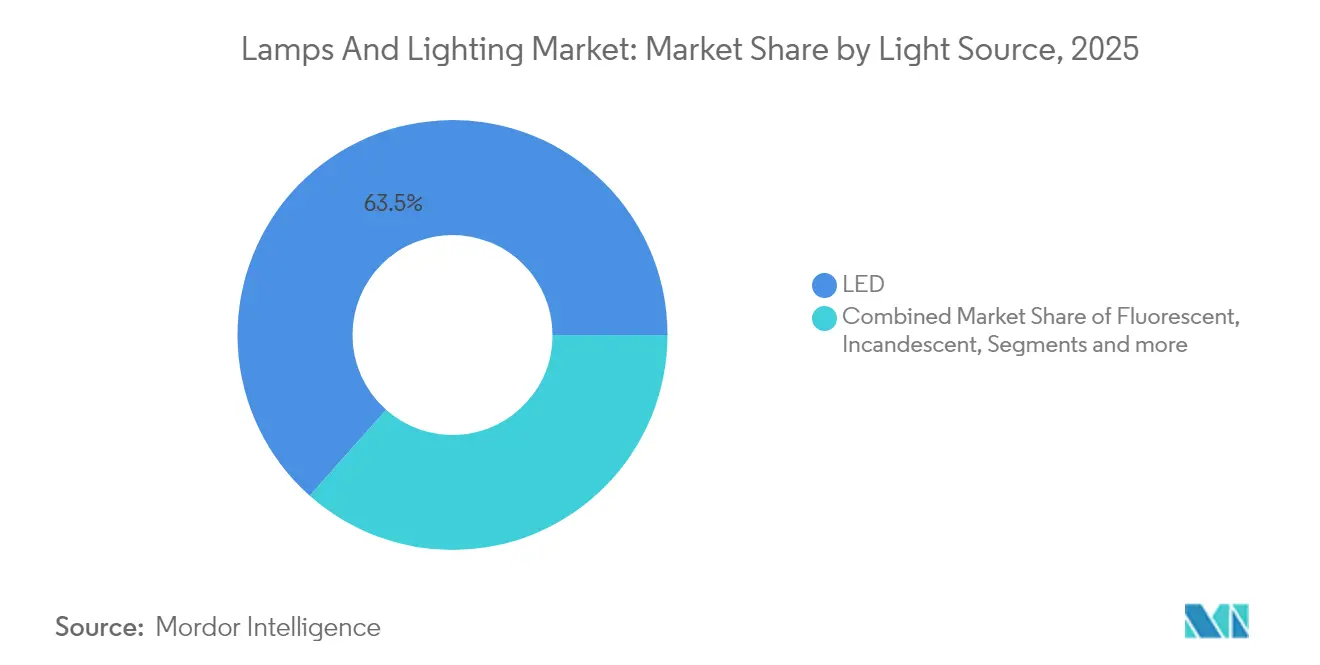
- By light source, LED products held 63.45% of the lamps and lighting market share in 2025, while Other Light Sources (HID, OLED, laser) are forecast to grow at the quickest 6.05% CAGR through 2031.
- By product placement, ceiling lights & chandeliers accounted for 31.30% of the lamps and lighting market 2025 revenue, whereas table & floor lamps will expand at the fastest 4.62% CAGR to 2031.
- By application, Residential uses captured 31.60% of the lamps and lighting market 2025 revenue; Horticulture & Agriculture is projected to lead growth at 5.55% CAGR over the same period.
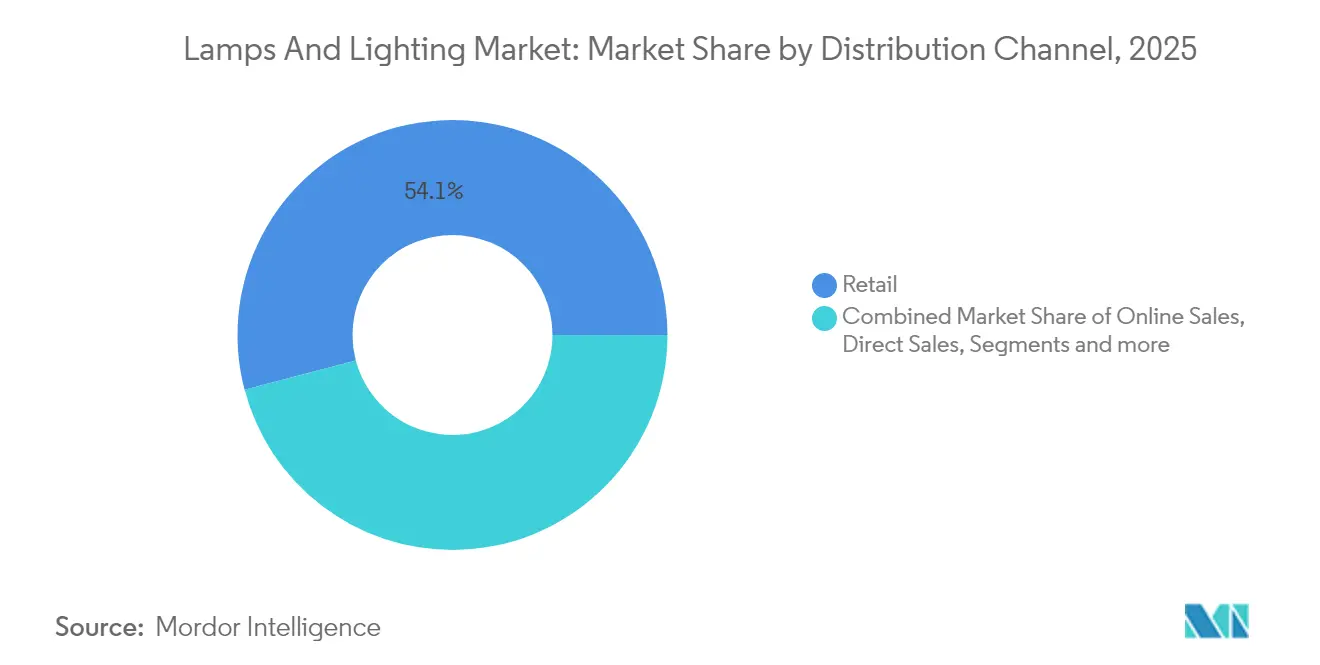
- By distribution channel, B2C/Retail outlets maintained 54.10% of the lamps and lighting market in 2025 sales, but B2B/Direct Sales & Projects are expected to accelerate at 5.25% CAGR.
- By geography, Asia-Pacific commanded 35.60% of the lamps and lighting market in 2025 revenue and is set to post the highest 5.45% CAGR through 2031.
Note: Market size and forecast figures in this report are generated using Mordor Intelligence’s proprietary estimation framework, updated with the latest available data and insights as of 2026.
Market Trends and Insights
Drivers Impact Analysis of Lamps and Lighting Market*
| Driver | % Impact on CAGR Forecast | Geographic Relevance | Impact Timeline |
|---|---|---|---|
| Surging secondary-replacement demand for LED lamps | +1.2% | Global, with concentration in North America & EU | Medium term (2-4 years) |
| Government-mandated fluorescent & halogen phase-outs in major economies | +0.9% | North America, EU, APAC developed markets | Short term (≤ 2 years) |
| Rapid retrofit programs in commercial real estate (post-COVID ESG mandates) | +0.7% | North America & EU urban centers | Medium term (2-4 years) |
| Power Over Ethernet (PoE) and smart-building integration accelerating fixture upgrades | +0.5% | Global commercial markets, early adoption in smart cities | Long term (≥ 4 years) |
| Growth of controlled-environment agriculture (CEA) driving horticultural lighting | +0.4% | North America, Northern EU, APAC urban centers | Long term (≥ 4 years) |
| Micro-LED & human-centric lighting unlocking premium pricing niches | +0.3% | Global premium segments, early adoption in healthcare & hospitality | Long term (≥ 4 years) |
| Source: Mordor Intelligence | |||
Surging secondary-replacement demand for LED lamps
The industry forecasts a secondary-replacement demand of 5.8 billion units in 2024, with peak replacement activity anticipated between 2025 and 2028 as fixtures approach their operational lifespans of 25,000-40,000 hours [1]. Consumer preferences have shifted beyond basic LED replacements, with increasing demand for advanced features such as higher color rendering index (CRI), wireless dimming capabilities, and voice-activated controls. This growing emphasis on premium functionalities has contributed to price stabilization, even as the average selling prices (ASPs) for standard lamps continue to decline. Additionally, the trend has driven the adoption of service contracts, as facility managers increasingly opt for subscription-based models that ensure consistent on-site operational uptime. These developments highlight a broader industry movement toward value-added solutions and long-term service reliability.
Government-mandated fluorescent & halogen phase-outs
California halted fluorescent sales on 1 January 2025, while the EU’s RoHS directive banned mercury-containing fluorescents on 24 February 2025 [2]. Canada's implementation of its Minamata Convention-aligned phase-out in 2026 represents a pivotal regulatory development for the lighting market. These synchronized bans will necessitate that channel partners accelerate the clearance of outdated inventory and fully transition to LED-based solutions. The regulatory certainty provided by this policy framework allows manufacturers to strategically scale their solid-state production capacities to meet anticipated demand. This harmonized approach across regions ensures a consistent and efficient phase-out of less efficient lighting technologies, fostering long-term market predictability. By 2030, these measures are projected to deliver significant energy savings, with the European Union expected to conserve 34 TWh of electricity annually, reinforcing the market's shift toward high-efficiency lighting products.
Rapid retrofit programs in commercial real estate
Local Law 88 in New York City mandates lighting upgrades in buildings over 25,000 sq ft by January 2025 [3]. Similar rules in Boston and Denver tie building emissions targets to fixture performance. Property owners see lighting as a fast-payback ESG lever that improves tenant wellness, so retrofit spending is prioritized even in uncertain macro cycles. Human-centric lighting is gaining favor as offices adopt hybrid layouts that must adapt to varying occupancy. Financing structures such as lease-pass-throughs help align landlord-tenant incentives, accelerating project approvals.
PoE and smart-building integration
Power-over-Ethernet solutions integrate data and power transmission through a single low-voltage cable, optimizing installation efficiency and enabling seamless system reconfigurations. According to MICROSENS, leveraging fixture-level sensors to automatically regulate output can achieve up to 30% energy savings, highlighting significant operational cost benefits. The adoption of 5G technology and edge analytics is driving the transformation of luminaires into multifunctional sensor hubs, capable of monitoring parameters such as occupancy, indoor air quality, and security. This evolution positions lighting systems as integral components of digital infrastructure, offering enhanced functionality beyond traditional illumination. As a result, lighting is increasingly being utilized as a strategic platform for data-driven building management and operational efficiency.
Restraints Impact Analysis of Lamps and Lighting Market*
| Restraint | % Impact on CAGR Forecast | Geographic Relevance | Impact Timeline |
|---|---|---|---|
| Commodity-price pressure eroding LED margins | -0.8% | Global, with acute impact in cost-sensitive segments | Short term (≤ 2 years) |
| Supply-chain risks for critical rare-earth phosphors | -0.6% | Global, concentrated in China-dependent supply chains | Medium term (2-4 years) |
| Fragmented retrofit standards causing interoperability issues | -0.4% | North America & EU commercial markets | Medium term (2-4 years) |
| Legislative pushback on incandescent bans in parts of the U.S. | -0.2% | United States regional markets | Short term (≤ 2 years) |
| Source: Mordor Intelligence | |||
Commodity-price pressure eroding LED margins
China's potential export restrictions on gallium and germanium are expected to significantly impact the cost structures within the semiconductor market, with the USGS estimating a potential GDP loss of USD 3.4 billion[4]. The planned 25% tariffs by the United States on rare-earth magnets further exacerbate concerns, creating additional pressure on supply chains and pricing dynamics. In response to these challenges, LED manufacturers are adopting strategic measures such as securing alternative supply sources, modifying phosphor formulations, and forming partnerships with recycling firms to mitigate risks. Smaller market participants, constrained by limited economies of scale, may face heightened financial pressures, leading to potential market exits or consolidation activities. Such developments could result in increased market concentration, particularly within mid-tier segments, altering competitive dynamics in the industry.
Supply-chain risks for rare-earth phosphors
The LED phosphors market requires an exceptionally high purity level of over 99.99%, with China currently processing approximately 70% of the global rare-earth supply. Export restrictions imposed by China have significantly increased lead times and financing costs for Western manufacturing facilities, creating operational challenges. Although recycling fluorescent lamps offers a method to recover critical rare-earth elements such as terbium and europium, the existing recycling infrastructure is insufficient to meet the rapidly growing demand. In response, major industry players are pursuing vertical integration strategies to secure supply chains, while the European Union is investing in domestic rare-earth processing capabilities to reduce dependency on imports. However, these initiatives are long-term in nature and are expected to mitigate supply chain risks only gradually over the coming years.
*Our forecasts treat driver/restraint impacts as directional, not additive. The impact forecasts reflect baseline growth, mix effects, and variable interactions.
Lamps and Lighting Market Segment Analysis
By Light Source:
LED Consolidates DominanceThe LED segment accounted for 63.45% of 2025 revenue, underscoring its status as the mainstream engine of the lamps and lighting market. Continuous efficiency gains, declining ASPs, and maturing smart-control ecosystems sustain its leadership. Other light sources-HID, OLED, and laser-collectively deliver the swiftest 6.05% CAGR by serving high-power, display, and specialty niches that LEDs do not yet fully cover. Regulatory deadlines hasten fluorescent decline, while incandescent and halogen lights persist only in decorative or high-heat applications. Technology convergence is evident as micro-LED prototypes transition from display labs to general illumination pilot lines.Quantum-dot color-conversion and high-CRI phosphor blends now enable LED products to match or surpass halogen color quality, eroding remaining barriers to full adoption. Nichia’s H6 series delivers Ra ≥ 90 at high efficacy, widening the premium range available to designers. The lamps and lighting market size for LEDs is projected to expand at a steady pace, given these technical advances. Suppliers also bundle embedded Bluetooth or Matter chips, lowering integration costs for smart-home ecosystems. As full-spectrum and tunable white options proliferate, LEDs are set to capture incremental share from specialized sources, reinforcing their position as the reference platform.

By Product:
Ceiling Solutions Anchor Smart IntegrationCeiling lights & chandeliers contributed 31.30% of worldwide revenue in 2025 and remain central to building energy strategies because they provide baseline illumination. Fixture OEMs integrate sensors and radios directly into troffers and downlights, making the ceiling grid the digital nervous system for occupancy and daylight harvesting. Table & floor lamps, though smaller, are on track for the fastest 4.62% CAGR as remote work normalizes and consumers seek personalized task lighting. Portable designs with battery backup and wireless charging slots differentiate premium offerings during blackout-prone weather seasons. Wall-mounted and track systems flourish in hospitality and retail, where accent lighting shapes brand ambience. Light-bulb sockets still support retrofit demand, but form factors shift toward lamps that natively host color-tunable LEDs. The lamps and lighting market continues to pivot from commodity bulb replacement to connected luminaires that integrate seamlessly with voice assistants. Product modularity, such as replaceable drivers and upgradable communication chips, extends life cycles and aligns with emerging right-to-repair statutes in the EU.
By Application:
Residential Stability Meets Agricultural AccelerationResidential spaces delivered 31.60% of 2025 turnover, anchored by ongoing renovation activity, smart-home adoption, and stimulus-backed energy rebates. Household buyers now prioritize flicker-free dimming and high color rendering, pushing manufacturers to add driver-IC protection and software updates over the air. Commercial offices and retail settings seek adaptable scenes that support hybrid schedules, while healthcare and industrial sites emphasize glare control and maintenance savings. Outdoor infrastructure investments shift toward adaptive streetlights that dim during low traffic to reduce municipal costs and light pollution.The horticulture and agriculture lighting market is experiencing robust growth, with a projected CAGR of 5.55%, driven by the expansion of controlled-environment agriculture across North America, Northern Europe, and East Asia. Emerging companies, such as Sollum Technologies, are leveraging advanced technologies by integrating lighting control systems with crop analytics to optimize resource utilization. Strengthening food-sovereignty policies are fostering increased adoption of agricultural lighting solutions, mitigating demand fluctuations in other end-markets. This trend is enabling fixture manufacturers to achieve greater revenue diversification by tapping into the growing demand for sustainable agricultural practices. The sector's growth trajectory underscores the critical role of innovative lighting solutions in addressing global food security challenges while enhancing operational efficiency.
By Distribution Channel:
Retail Dominance Faces Project-Driven GrowthB2C/Retail venues-hypermarkets, home centers, specialty showrooms-captured 54.10% of global sales in 2025, reflecting the importance of tactile product evaluation and immediate take-away. Retailers increasingly deploy interactive kiosks that let shoppers visualize room scenes in mixed reality, thereby upselling higher-margin smart bulbs. B2B/Direct Sales & Projects will climb at 5.25% CAGR as corporate buyers outsource turnkey retrofits to solution integrators. Contractors bundle lighting with HVAC, sensors, and cloud dashboards to satisfy ESG reporting requirements with a single procurement cycle.Online marketplaces bridge both channels; brand-verified shops on e-commerce platforms support do-it-yourselfers with video tutorials, while dedicated portals for facility managers offer configurators and digital twins. The lamps and lighting market size for subscription-based Lighting-as-a-Service contracts is growing quickly: Signify’s model guarantees 80% energy savings while delivering cash-flow-positive outcomes from day one. This service orientation also underpins circular-economy goals because vendors retain ownership and can remanufacture returned fixtures.
Geography Analysis
APAC Lamps and Lighting Market
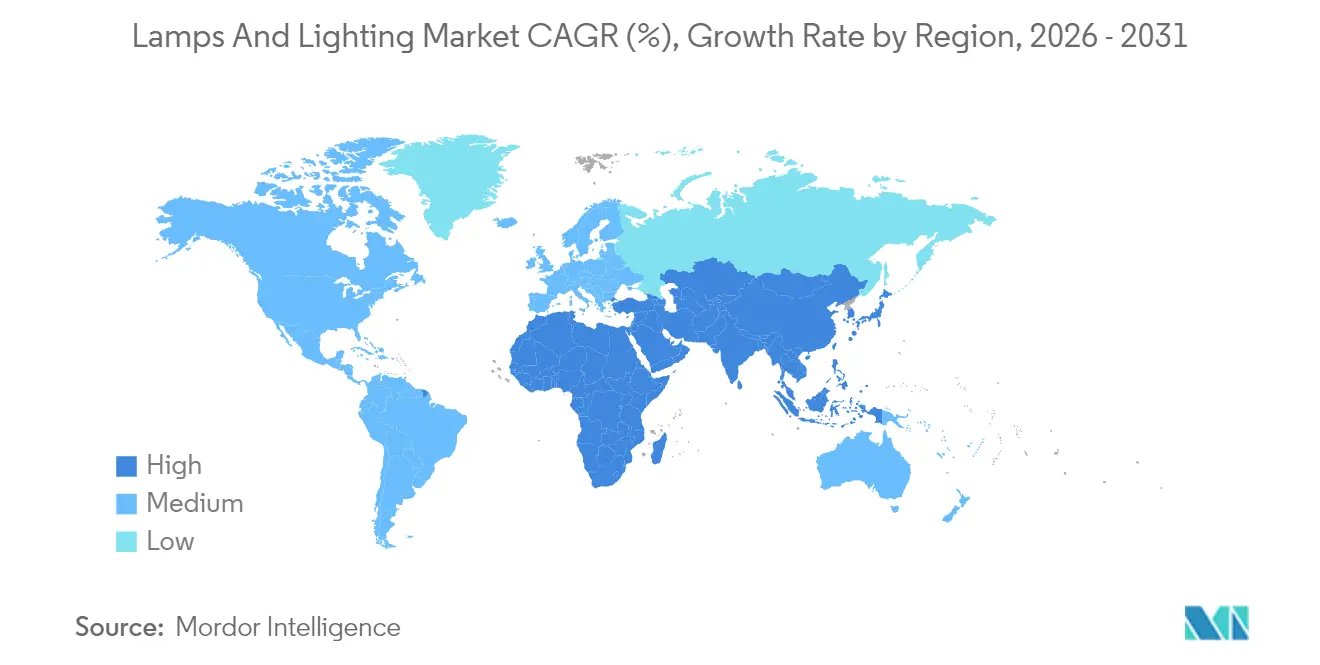
Asia-Pacific led with 35.60% of global revenue in 2025 and will pace the lamps and lighting market at a 5.45% CAGR through 2031. China anchors both supply and demand, with the Jiujiang factory featuring 192 lines dedicated to LED lamps. The region benefits from aggressive smart-city deployments and governmental LED procurement, although rare-earth dependence introduces geopolitical risk. Japan advances high-CRI lasers and micro-LED packages, sustaining its reputation as a photonics innovator. India’s UJALA-successor subsidy programs and Southeast Asian urbanization also expand baseline volumes.
North America Lamps and Lighting Market
North America maintains strong compliance-driven momentum. California’s fluorescent ban and the US Department of Energy’s increasing lumen-per-watt thresholds funnel demand into solid-state options. Local Law 88 in New York City obliges landlords to finalize upgrades this year, driving a project backlog for PoE and smart-sensor fixtures. Although political pushback exists-Senate proposals to restore incandescent freedom emerge periodically-state-level policies remain decisive.
Europe Lamps and Lighting Market
Europe champions sustainability through 2024/1781 Eco-design rules that enforce reparability and recyclability. The 2025 mercury-lamp ban is fully in force, compelling late-stage fluorescent holdouts to convert. CEN-CENELEC standards now emphasize digital interfaces, ensuring new luminaires can integrate with building management software from day one. Emerging Eastern markets benefit from EU funding that supports municipal LED streetlights, widening regional adoption.
Regulatory Landscape
Regulation continues to shift the global mix away from mercury-based and inefficient technologies and toward connected, higher-quality LED systems. In Europe, the 2025 mercury-containing fluorescent restrictions under RoHS accelerate channel conversion, while the 2024/1781 Eco-design rules raise requirements around reparability and recyclability for luminaires. In 2026, the European Commission added product-level sustainability disclosure to the smart-lighting agenda through Implementing Regulation (EU) 2026/1189, which requires EPD and carbon footprint labeling for smart lighting sold in the EU starting October 1, 2026.
Safety and performance standards for commercial LED are also tightening. CEN/CENELEC released EN IEC 62471-2:2026 on July 3, 2026 to address commercial flicker-free LED lighting, with mandatory enforcement effective January 1, 2027. In the United States, the Department of Energy continued to shape the efficiency rulebook through actions in 2026, including a February 13, 2026 determination on metal halide lamp fixtures and a March 31, 2026 rulemaking action covering fluorescent lamp ballasts, alongside a July 2026 proposal to revise the Process Rule that governs how energy-efficiency standards are set.
Value Chain Analysis
The lamps and lighting value chain covers upstream materials and components (LED chips and packages, drivers, optics, housings, connectors, sensors, and wireless modules), midstream luminaire and lamp assembly, and downstream distribution and project delivery. Upstream exposure remains concentrated in semiconductor and specialty materials, including high-purity rare-earth phosphors. The midstream is increasingly split between high-volume standard SKUs and configurable connected luminaires that require tighter QA for electronics, firmware, and interoperability.
Downstream, retail and e-commerce continue to drive standardized replacement sales, while B2B projects (retrofits, smart buildings, and municipal streetlighting) rely on specifiers, electrical contractors, and system integrators that bundle lighting with controls, networking, and software. Supply-chain design is increasingly influenced by trade and compliance considerations, supporting China+N sourcing structures where core components may originate in China but final assembly or configuration occurs in locations such as Mexico or Vietnam to manage tariffs and lead-time risk. As service models such as Lighting-as-a-Service expand, reverse logistics, refurbishment, and recycling partners become more central to the value chain, since vendors retain ownership and need end-of-life recovery pathways.
Competitive Landscape
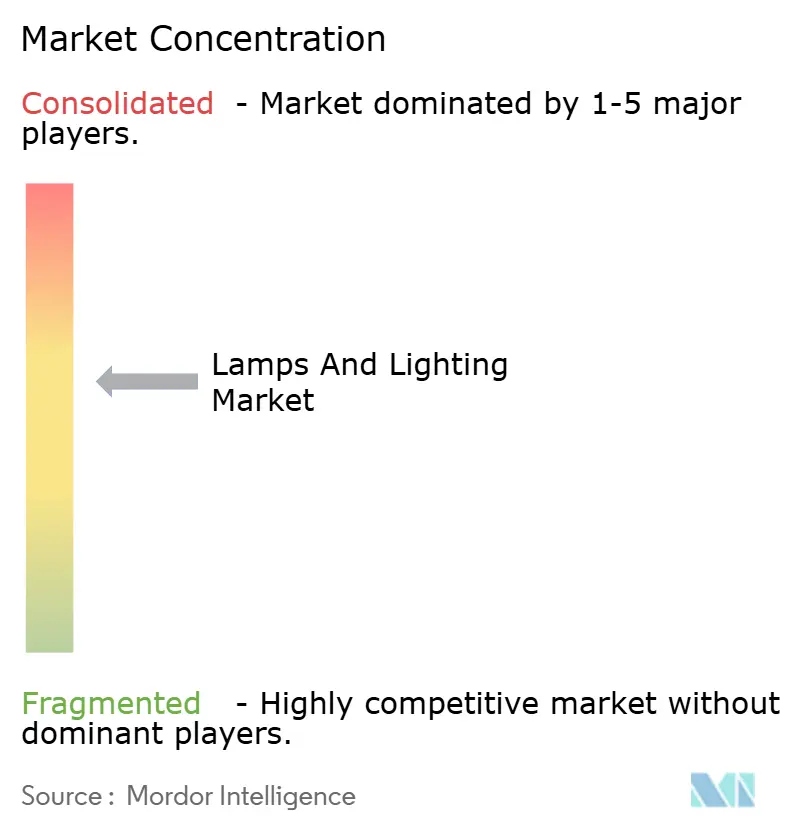
The lamps and lighting market demonstrates a moderate level of concentration, with the five leading vendors—Signify, Acuity Brands, Zumtobel Group, OSRAM, and Panasonic Lighting—collectively capturing a substantial portion of the 2025 revenue. Signify has maintained its leadership position by leveraging its Interact cloud platform and expanding its presence through strategic regional collaborations, such as its partnership with Signify Gila Lighting Technologies in Egypt. Acuity Brands has secured the second position, driven by its acquisition of QSC, which has strengthened its portfolio with advanced audio and control solutions, aligning with its Intelligent Spaces strategy. The competitive landscape is shaped by these key players' ability to innovate and adapt to evolving market demands, particularly in the areas of smart lighting and integrated solutions. This market dynamic underscores the importance of technological advancements and strategic partnerships in sustaining competitive advantages within the industry.
Vertical integration is intensifying as Wolfspeed invests USD 5 billion in a North Carolina silicon-carbide fab to safeguard chip supply for advanced drivers and automotive lighting. Patent filings reveal convergence with consumer electronics: Meta’s micro-LED packages and Apple’s AR visor light-blocking structures capitalize on cross-industry photonics research. Smaller regional brands retain agility by targeting horticulture, heritage retrofit, or ultra-high-CRI niches that demand close customer collaboration.
Service-centric models alter competitive dynamics. Zumtobel’s Light-as-a-Service contract with Vorarlberger Kraftwerke converts capex into opex while guaranteeing illumination outcomes. Signify states its LaaS projects deliver 80% energy reduction and net-positive cash flow, an attractive proposition for cash-constrained facility operators. As software value grows, lighting vendors partner with IT integrators, suggesting future consolidation waves may mirror SaaS rather than hardware playbooks.
Lamps and Lighting Industry Leaders
-
Signify (Philips Lighting)
-
Acuity Brands
-
Osram Licht AG
-
GE Current (Daintree)
-
Eaton (Copper Lighting)
- *Disclaimer: Major Players sorted in no particular order
Lamps and Lighting Market Companies Covered in this Report
- Signify (Philips Lighting)
- Acuity Brands
- Osram Licht AG
- GE Current (Daintree)
- Eaton (Copper Lighting)
- Cree Lighting
- Hubbell Lighting
- Zumtobel Group
- Nichia Corporation
- Samsung Electronics (LED)
- Panasonic Lighting
- Legrand SA
- Wipro Lighting
- Havells India
- Bajaj Electricals
- Thorn Lighting
- Fagerhult Group
- Delta Electronics
- Syska LED
- Luxxbox
- LumiGrow (Horticulture)
- Heliospectra
Market Opportunities and Future Outlook
Compliance-led product redesign and disclosure requirements create a near-term opportunity for manufacturers that can industrialize documentation, testing, and traceability across portfolios. The EU requirement for EPD and carbon footprint labels for smart lighting from October 1, 2026 (Implementing Regulation (EU) 2026/1189) rewards vendors with established life-cycle assessment data and supplier transparency. EN IEC 62471-2:2026 (released July 3, 2026, with enforcement from January 1, 2027) also supports higher demand for flicker-management at the driver, control, and system-integration levels in commercial installations. These changes create room for component suppliers and software providers that help OEMs validate compliance and maintain digital product files at scale.
Connected lighting and software-enabled differentiation continue to shift value toward platforms, analytics, and services rather than commodity lamps. Signify has publicly emphasized connected lighting, and market activity around city infrastructure as a digital platform, such as Signify working with Cornerstone and Dense Air to use street lighting to deploy a multi-operator wireless network in Oxford in 2025, shows how outdoor lighting assets can be monetized beyond illumination. On the commercial side, tighter retrofit deadlines in major cities (including New York City Local Law 88, which requires lighting upgrades by January 2025 for qualifying buildings) keep project channels active and favor vendors that can deliver turnkey retrofits with controls, PoE-ready architectures, and service contracts that reduce maintenance burden and support ESG reporting.
Recent Industry Developments in Lamps and Lighting Market
- June 2026: Signify launches Philips Skylight designed to bring the feeling of daylight indoors. The product expansion broadens the premium IoT enabled lighting portfolio and indoor wellness positioning, reinforcing lamps as digital platforms through enhanced connectivity and data offerings.
- May 2026: Signify introduces Sports Live software for Philips Hue and Philips Smart Lighting. The software enables lighting ecosystem integration with sports data, reflecting a shift toward data-driven, service-oriented lighting offerings and extended customer engagement.
- January 2026: ams OSRAM
- CES 2026: Launch of optical force sensing products AS7150, SFH7061 and VEGALED smart glasses components. The introduction broadens product capability beyond traditional lighting into smart devices and AR wearables, positioning the company at the intersection of sensing and wearable optics.
Lamps and Lighting Market Report Scope and Research Methodology
Market Definition and Coverage
For this study, the lamps and lighting market covers revenue earned from the sale of lighting products used to illuminate indoor and outdoor spaces across residential, commercial, and industrial end use settings, captured at the value of products sold in the market.
Scope exclusions: We exclude electricity consumption and utility bills, and we also exclude installation-only labor and general building services that are not sold as part of a lighting product sale.
Segments Covered in This Report
- By Product (Placement & Form-factor)
- Table & Floor Lamps
- Ceiling Lights & Chandeliers
- Wall-Mounted Fixtures
- Light Bulbs & Fittings
- Other Products (Spot, Track, Portable etc.)
- By Light Source
- LED
- Fluorescent
- Incandescent
- Halogen
- Other Light Sources (HID, OLED, laser, etc.)
- By Application
- Residential
- Commercial (Offices, Retail, Hospitality)
- Industrial & Warehouse
- Outdoor & Public Infrastructure
- Horticulture & Agriculture
- Healthcare & Surgical
- Other Applications
- By Distribution Channel
- B2C/Retail Channels
- Hypermarkets and Supermarkets
- Home Centers
- Specialty Lighting Stores
- Online
- Other Distribution Channels
- B2B/Direct Sales & Projects
- B2C/Retail Channels
- By Geography
- North America
- Canada
- United States
- Mexico
- South America
- Brazil
- Peru
- Chile
- Argentina
- Rest of South America
- Europe
- United Kingdom
- Germany
- France
- Spain
- Italy
- BENELUX
- NORDICS
- Rest of Europe
- Asia-Pacific
- India
- China
- Japan
- Australia
- South Korea
- South East Asia
- Rest of Asia-Pacific
- Middle East and Africa
- United Arab Emirates
- Saudi Arabia
- South Africa
- Nigeria
- Rest of Middle East and Africa
- North America
Data Sources, Market Sizing, and Validation
Desk Research
Desk research starts with building a clean fact base on demand drivers and supply movement for lighting products. We rely on public and official sources such as the International Energy Agency for energy efficiency context, UN Comtrade for traded lighting product flows, and national statistics offices for construction and housing indicators that influence replacement and new build demand.
To keep assumptions grounded, we also review materials from standards and policy bodies and programs, including US Department of Energy lighting resources and similar national efficiency regulations, along with association publications and reputable press coverage of technology shifts such as LED adoption and connected lighting. Company annual reports, investor presentations, and product catalogs are used to cross-check product mix and pricing direction, and paid subscriptions for company financials, patent coverage, and import-export shipment-level data are used selectively when free sources cannot close a gap. These examples are not exhaustive, and other sources were referred to for data collection, validation, and research clarification.
Primary Interviews and Surveys
Primary interviews and surveys are used to test the model structure and to pressure check key inputs that do not show up cleanly in public datasets, like mix shifts between lamps and luminaires, the pace of LED replacement, and typical price movement by channel. We spoke with a blend of manufacturers, distributors, contractors, and large buyers across major regions so that regional adoption patterns and application-level differences could be checked before finalizing the totals.
Distribution of primary research fieldwork respondents
| Company type | Respondent position | Region |
|---|---|---|
| Top tier: 33% | CXOs: 15% | APAC: 41% |
| Mid tier: 47% | Functional/Unit leaders: 34% | EMEA: 37% |
| Smaller Players: 20% | Managers: 51% | Americas: 22% |
Market-Sizing & Forecasting
Sizing begins with a top down build where construction and retrofit activity, trade and production signals, and lighting technology penetration are used to reconstruct the addressable demand pool for lighting products across key geographies. Once that demand pool is built, average selling price ranges are applied by product type and application, and then the totals are cross-checked using selective bottom up checks such as sampled supplier revenue roll ups, channel checks with distributors, and volume times ASP sanity tests for high volume categories.
Several market fingerprints are tracked as inputs because they explain most of the value movement in lighting. These include the pace of LED conversion versus legacy sources, replacement cycles in residential and commercial buildings, the share of connected or smart lighting in new installations, construction starts and completions, and import export movement that signals supply availability and pricing pressure. When direct volume data is patchy in a country, the gap is handled using proxies like construction floor area trends and replacement intensity benchmarks shared by industry participants, then normalized to the same currency and time period.
Forecasting uses scenario analysis supported by multivariate regression for the largest regions, since demand is influenced by repeatable drivers like construction activity, renovation intensity, and policy-led efficiency upgrades. The final outlook is adjusted using primary feedback on near term pricing and inventory conditions, so we do not project short spikes that are not expected to sustain.
Data Validation & Update Cycle
Validation is done in layers so the final numbers stay consistent with real world signals. We compare outputs against independent indicators like trade values, construction trends, and company reported revenue direction, and then run variance checks to spot outliers by region or application that do not match known adoption patterns.
Before sign off, assumptions are reviewed in more than one analyst pass, and follow up calls are triggered when a key input moves outside an expected range, such as an abrupt change in price or an unusually fast shift in product mix. Reports are refreshed annually, with interim updates when material events occur, and a final pre delivery review is completed so clients receive the latest updated view.
Mordor Intelligence's Lamps and Lighting Market Estimate Compared With Other Published Estimates
Published market sizes for lamps and lighting often do not match, even when the topic name sounds the same. The differences usually come from what gets counted as lighting, how pricing is treated during LED driven mix change, and how frequently the model is refreshed when construction and retrofit cycles shift.
Import export values for lighting product categories, construction activity signals, and primary channel feedback are used to keep Mordor Intelligence's estimate tied to sell through of lamps and lighting products, rather than being inflated by adjacent electrical items or service heavy bundles. When these evidence points are applied consistently, the biggest gap drivers tend to be scope boundaries (products versus controls and systems), the assumed speed of LED replacement, the way ASP decline or premiumization is modeled, and the currency timing used for conversion.
Benchmark comparison
| Source | Market Size | Gaps in Research Methodology |
|---|---|---|
| Mordor Intelligence | USD 139.57 B (2026) | |
| Global Consultancy A | USD 151.90 B (2026) | Uses a wider boundary that rolls smart controls, connected building platforms, and some electrical accessories into lighting, which raises the value base beyond product-only revenue. |
| Industry Association B | USD 128.40 B (2026) | Leans on conservative replacement assumptions and older price curves for LED products, and it often undercounts faster-growing retrofit demand in commercial and public infrastructure. |
The spread in the table is mainly explained by what gets included around the core lighting products, and by how fast the model allows LED mix and pricing to reset the market value. By keeping the inputs traceable to demand signals and rechecking assumptions with real buyers and channels, the final number stays practical to replicate and easier to compare across regions and use cases.
Key Questions Answered in the Report
What is the current size of the lamps and lighting market?
The lamps and lighting market stands at USD 139.57 billion in 2026 and is projected to reach USD 170.25 billion by 2031 at a 4.05% CAGR.
Which light source holds the largest revenue share?
LED products dominate with 63.45% of global revenue in 2025, thanks to efficiency gains and smart-control integration.
Which application segment is expanding the fastest?
Horticulture & Agriculture lighting is growing at a 5.55% CAGR because indoor farms require spectrally tuned fixtures to improve crop yields.
How significant is Asia-Pacific in the global market?
Asia-Pacific contributes 35.60% of 2025 revenue and is expected to grow at 5.45% CAGR, driven by urbanization and smart-city projects.
What business model trends are shaping competition?
Lighting-as-a-Service contracts convert upfront capex into operating fees, offering customers guaranteed energy savings and product uptime.
Why are rare-earth materials a concern for the industry?
High-purity rare-earth phosphors remain concentrated in Chinese supply chains, and potential export restrictions could erode LED profit margins.