Particle Size Analysis Market Size and Share
Market Overview
| Study Period | 2020 - 2031 |
|---|---|
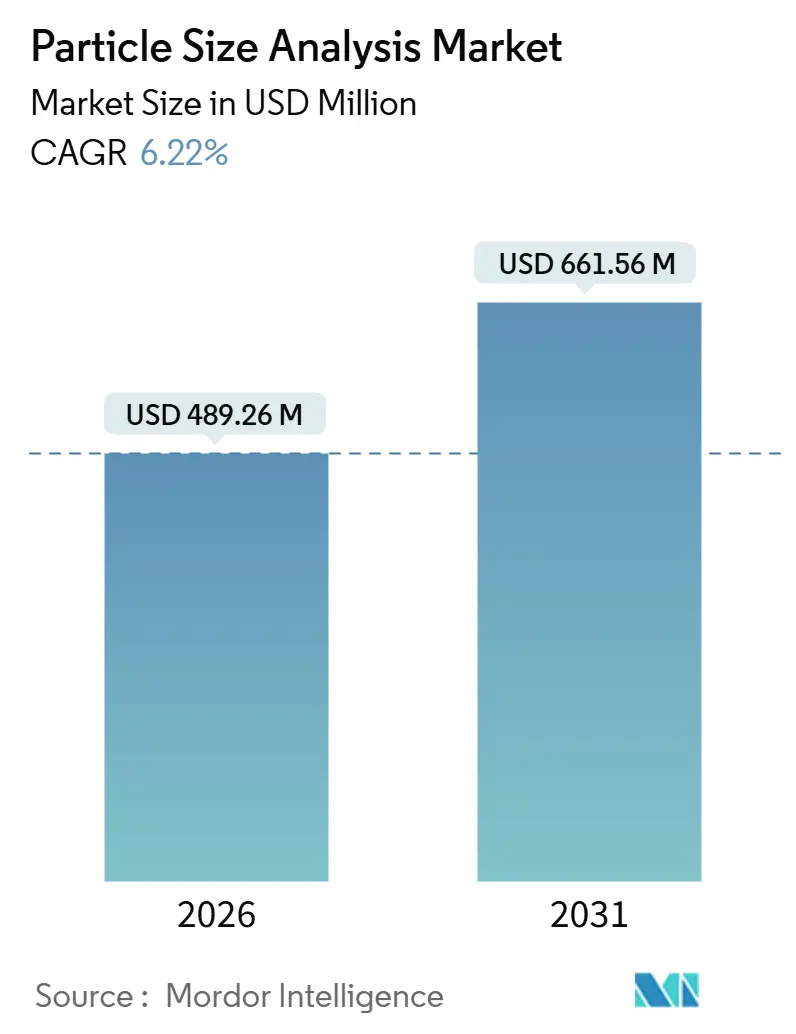
| Market Size (2026) | USD 489.26 Million |
| Market Size (2031) | USD 661.56 Million |
| Growth Rate (2026 - 2031) | 6.22% CAGR |
| Fastest Growing Market | Asia Pacific |
| Largest Market | North America |
| Market Concentration | Medium |
Major Players*Disclaimer: Major Players sorted in no particular order Image © Mordor Intelligence. Reuse requires attribution under CC BY 4.0. | |
Particle Size Analysis Market Analysis by Mordor Intelligence
The particle size analysis market size reached USD 489.26 million in 2026 and is projected to increase to USD 661.56 million by 2031, representing a 6.22% CAGR across the forecast period. The consistent upswing stems from tighter global regulations, rapid product development cycles, and a strategic push to engineer materials at nanometer precision, especially within the pharmaceutical, battery, and advanced ceramic industries. The growing recognition that particle-size distributions directly affect drug bioavailability, battery cycle life, and catalyst reactivity has shifted the technique from discretionary laboratory testing to a mission-critical quality-control lever. Laser diffraction remains the entry-level workhorse because it balances speed, dynamic range, and validation traceability. Additionally, momentum is building around single-particle methods, such as nanoparticle tracking analysis, which satisfy emerging biologic and solid-state battery use cases. Pharmaceutical buyers seek redundancy to derisk inspections, battery producers embed inline probes to reduce scrap, and AI-enabled multi-technique platforms shorten root-cause diagnostics, all while reinforcing capital investment, even as the total cost of ownership remains high.
Key Report Takeaways
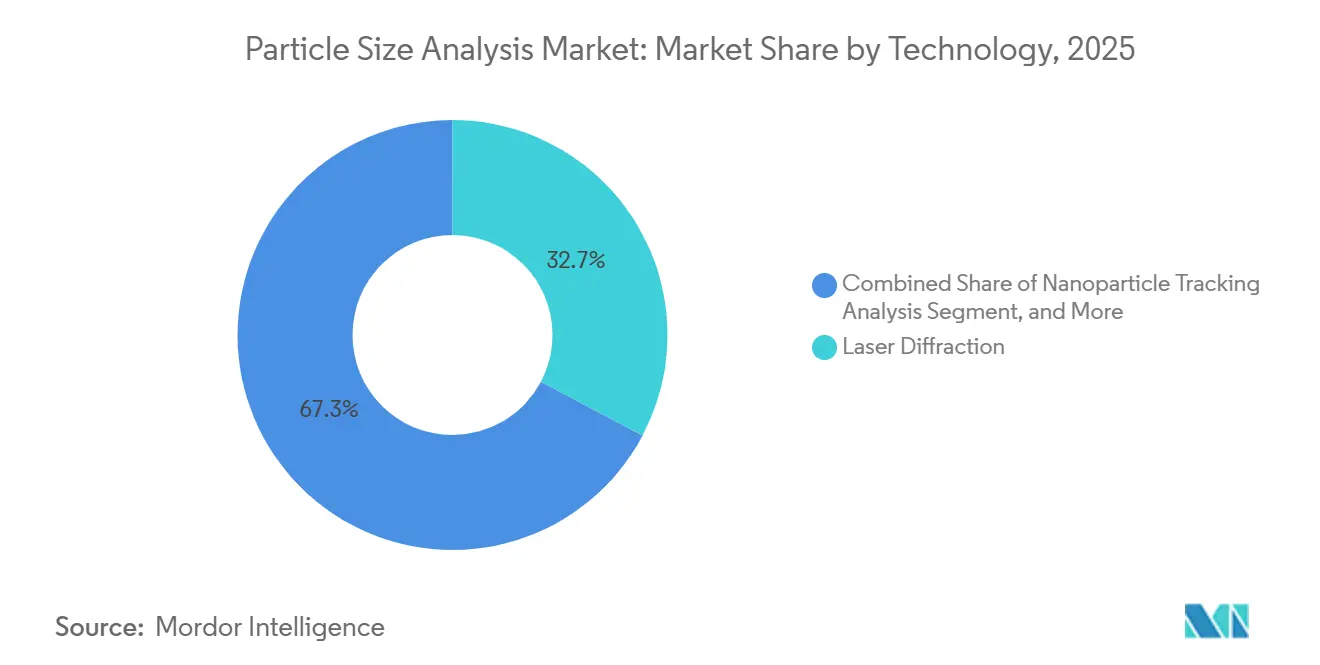
- By technology, laser diffraction led with 32.74% of the particle size analysis market share in 2025, while nanoparticle tracking analysis is forecast to advance at a 7.69% CAGR through 2031.
- By dispersion type, wet analyzers captured 53.89% of the particle size analysis market share in 2025, whereas spray analyzers are poised to expand at a 6.81% CAGR to 2031.
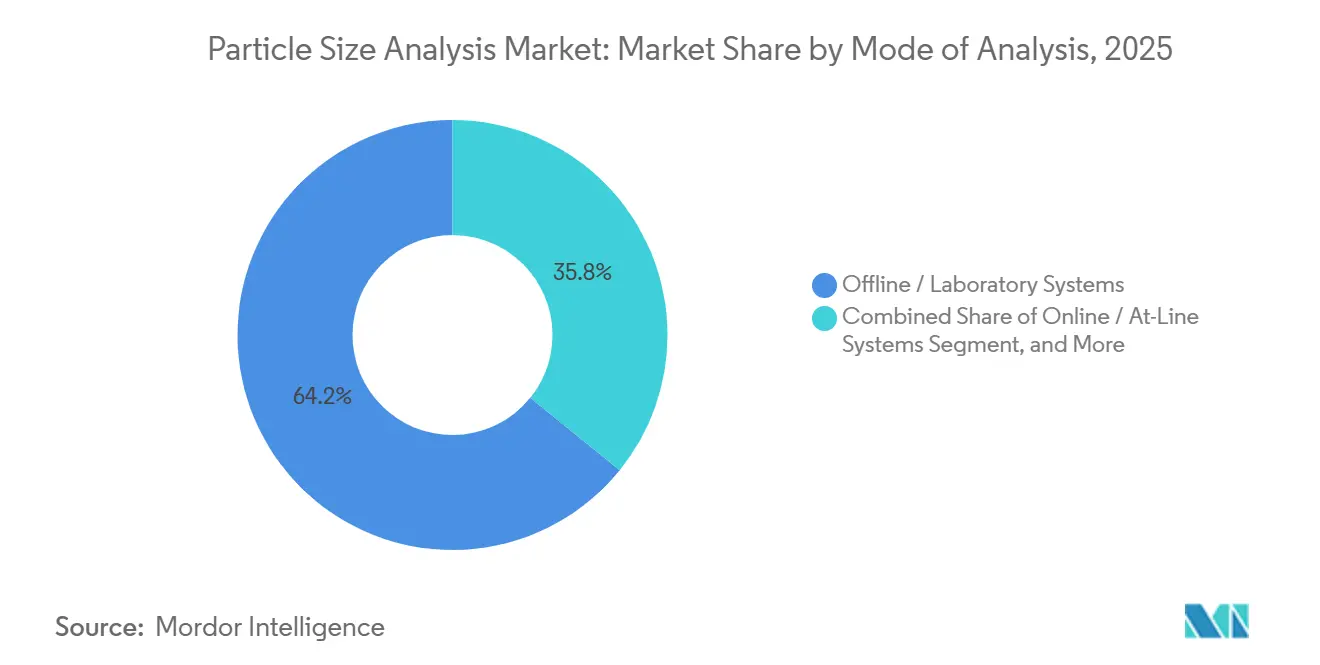
- By mode of analysis, offline laboratory systems accounted for 64.18% of revenue in 2025; however, inline real-time systems are projected to achieve a 6.89% CAGR.
- By end-user industry, pharmaceuticals accounted for 37.91% of 2025 demand; energy and battery materials represented the fastest growth trajectory at a 7.66% CAGR.
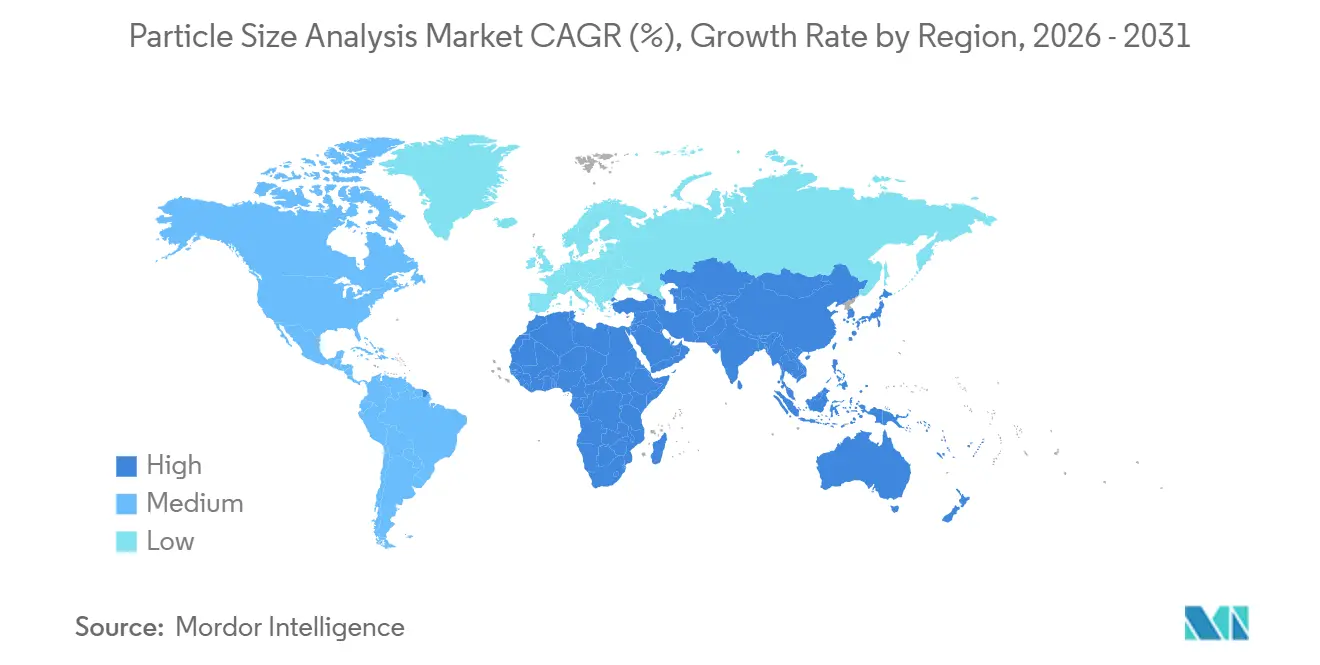
- By geography, North America accounted for a 37.79% share in 2025, while Asia-Pacific leads future growth at a 7.27% CAGR.
Note: Market size and forecast figures in this report are generated using Mordor Intelligence’s proprietary estimation framework, updated with the latest available data and insights as of January 2026.
Global Particle Size Analysis Market Trends and Insights
Drivers Impact Analysis*
| Driver | (~) % Impact on CAGR Forecast | Geographic Relevance | Impact Timeline |
|---|---|---|---|
| Rising Research Activity in Nanotechnology | +1.2% | Global, concentrated in North America, Europe, East Asia | Medium term (2-4 years) |
| Growing Pharmaceutical Quality-Control Needs | +1.4% | Global, strongest in North America and Europe | Short term (≤ 2 years) |
| Shift Toward Online and Inline Real-Time Analysis | +0.9% | North America and Europe, expanding in Asia-Pacific | Medium term (2-4 years) |
| AI-Enabled Multi-Technique Integration | +0.7% | North America and Europe pioneers, Asia-Pacific following | Long term (≥ 4 years) |
| Soaring Demand for Battery and Energy-Storage Materials Testing | +1.3% | Asia-Pacific core, spillover to North America and Europe | Short term (≤ 2 years) |
| Expansion of Microfluidic Lab-on-Chip PSA Devices | +0.5% | North America and Europe research nodes | Long term (≥ 4 years) |
| Source: Mordor Intelligence | |||
Rising Research Activity in Nanotechnology
Harmonized testing guidelines for manufactured nanomaterials now specify particle-size distribution as a core element of the dossier, creating an immediate demand for sub-50 nm instrumentation.[1]Organisation for Economic Co-operation and Development, “Harmonized Testing Guidelines for Manufactured Nanomaterials,” OECD, oecd.org Universities and national labs deploy nanoparticle tracking analysis and dynamic light scattering to validate quantum dots, lipid nanoparticles, and oxide catalysts. Laser-diffraction vendors retrofit modules for finer ranges, but face competition from microfluidic devices that consolidate size, zeta potential, and concentration in single cartridges. This convergence is widening the supplier base while accelerating innovation cycles, ultimately enlarging the particle size analysis market footprint.
Growing Pharmaceutical Quality-Control Needs
The FDA’s 2024 revision of analytical validation guidance explicitly requires robustness studies for particle-size methods in solid and parenteral dosage forms, turning optional characterization into a legal mandate.[2]United States Food and Drug Administration, “Q2(R2) Analytical Validation Guidance,” FDA, fda.gov Complementary ICH Q14 rules embed particle-size analysis within process-validation frameworks, prompting generics, biosimilars, and contract manufacturers to install redundant laser-diffraction and dynamic light-scattering systems to pass sponsor audits. Orthogonal techniques, such as nanoparticle tracking analysis or field-flow fractionation, gain traction in profiling sub-micron protein aggregates. The spending wave effectively doubles mid-tier equipment demand, reinforcing the particle size analysis market.
Shift Toward Online and Inline Real-Time Analysis
Industry 4.0 agendas encourage continuous manufacturing, and inline probes now close feedback loops that once relied on delayed laboratory tests. Real-time particle-size trends trigger automated adjustments during spray drying or slurry milling, reducing scrap and raising yield. Early adopters in North America and Europe validate inline laser-diffraction and focused-beam reflectance measurement against ISO 13320 benchmarks to secure regulatory acceptance. Although validation costs slow diffusion among small producers, the long-run payoff in throughput and compliance is cementing inline systems as a growth catalyst for the particle size analysis market.
AI-Enabled Multi-Technique Integration
Convolutional neural networks embedded in imaging analyzers classify morphology alongside size, cutting diagnostic times when batches deviate. Laser-diffraction platforms equipped with anomaly-detection models flag agglomeration or contamination before the product is released.[3]Horiba, “LA-960 Laser Diffraction Particle Size Analyzer,” Horiba, horiba.com Real-time AI insights can shorten downtime, but validation frameworks often lag, prompting cautious firms to run parallel manual workflows. Over time, standardized AI documentation will phase in, lifting barriers and adding another expansion lane for the particle size analysis market.
Restraints Impact Analysis*
| Restraint | (~) % Impact on CAGR Forecast | Geographic Relevance | Impact Timeline |
|---|---|---|---|
| High Capital and Maintenance Costs | -0.8% | Global, acute in emerging markets | Short term (≤ 2 years) |
| Shortage of Skilled Operators and Data Scientists | -0.6% | Global, pronounced in Asia-Pacific and Middle East and Africa | Medium term (2-4 years) |
| Sample Preparation Complexity for Agglomerated Particles | -0.4% | Global, sector-specific | Long term (≥ 4 years) |
| Competition from Alternative Characterization Methods | -0.3% | North America and Europe | Medium term (2-4 years) |
| Source: Mordor Intelligence | |||
High Capital and Maintenance Costs
Flagship laser-diffraction systems list above USD 100,000 and require annual service contracts priced at 15-20% of hardware value, pressuring budgets at contract manufacturers and academic labs. Import tariffs and currency fluctuations in emerging regions can increase entry costs by 20-30%, steering buyers toward refurbished gear. Vendors respond with leasing and instrument-as-a-service models, but they must carry inventory risk, which keeps margins thin and lengthens payback, softening near-term uptake within the particle size analysis market.
Shortage of Skilled Operators and Data Scientists
A 2024 American Chemical Society survey revealed that 38% of labs struggle to recruit particle characterization talent, and more than half cite training gaps as a barrier to adoption. AI-infused software lowers the skill floor, yet firmware, data integrity, and cybersecurity requirements demand specialized knowledge. Vendors offer guided workflows and cloud-based expert systems, but pharmaceutical and defense customers often prohibit external connectivity, forcing suppliers to ship air-gapped versions that cost more and limit update cycles.
*Our forecasts treat driver/restraint impacts as directional, not additive. The impact forecasts reflect baseline growth, mix effects, and variable interactions.
Segment Analysis
By Technology: Laser Diffraction Retains Primacy While Nanoparticle Tracking Scales Up
Laser diffraction accounted for 32.74% of 2025 revenue, maintaining the largest particle size analysis market share due to a 10 nm–3,500 µm dynamic range that suits both fine APIs and coarse clinker. Validation against ISO 13320 enables laboratories to file data without lengthy method justification, and software plugins now overlay zeta potential and concentration, allowing users to diagnose root-cause failures on a single screen. Suppliers defend the franchise by bundling imaging add-ons, cloud libraries, and CFR Part 11 audit trails, which shorten the installation qualification process for pharmaceutical buyers. Competitive noise centers on resolution; vendors advertise sub-100 nm sensitivity, but diffraction physics limits precision once particles approach the laser wavelength, pushing buyers to consider orthogonal tools for biologics and solid-state battery tasks.
Nanoparticle tracking analysis, forecast to advance at a 7.69% CAGR to 2031, solves that blind spot with single-particle visualization below 100 nm, making it the fastest-moving slice of the particle size analysis market. Biologic drug makers use this method to quantify protein aggregates that trigger immunogenicity, while battery developers check sulfide electrolytes for uniformity at sub-5 µm levels that prevent dendrite formation. Dynamic light scattering maintains a strong presence in academia for hydrodynamic radius studies, but batch mode and dilution artifacts hinder industrial adoption. Imaging analyzers fill morphology-sensitive niches, such as abrasives and metal powders, whereas the Coulter principle is resurfacing in graphite slurries because electrical impedance can ignore refractive-index swings. Ultra-specialized Taylor dispersion and resonant mass instruments command premium prices in R&D environments where absolute precision outweighs throughput.


By Dispersion Type: Wet Systems Dominate as Spray Platforms Gain Velocity
Wet dispersion instruments captured 53.89% of 2025 revenue by underpinning slurry-heavy verticals, such as mining, ceramics, and pharmaceutical suspensions, where inline density adjustments rely on rapid feedback loops. Closed-loop recirculation cells reduce solvent use, and anti-settling impellers prevent coarse tails from skewing the D50, thereby reinforcing the technology’s hold on the particle size analysis market share. Dry analyzers remain staples for cement, toner, and metal powders; however, combustible-dust standards require inert-gas purges, which increase operating costs, prompting some users to adopt wet methods using volatile solvents that evaporate after testing.
Spray analyzers are projected to grow at a 6.81% CAGR, driven by stricter aerodynamic particle-size distribution limits in inhaler and nasal spray dossiers. Optical spectrometers built into formulation booths now alert operators when droplet medians drift beyond cascade-impactor guardrails, slashing rework. Pesticide formulators in Brazil and Argentina are adopting laser-based spray profilers to curb off-target drift and meet environmental caps, creating a new market opportunity within particle size analysis. Barriers remain: calibrating spray optics to reference impactors demands meticulous alignment, and closed-loop solvent capture can add USD 15,000–25,000 to capital outlay, a hurdle for mid-tier producers.
By Mode of Analysis: Offline Dominates Yet Inline Adoption Accelerates
Offline laboratory systems accounted for 64.18% of mode-based revenue in 2025 because legacy SOPs favor triplicate bench runs with documented custody chains. Pharmaceutical sites embed barcode-scanned vials and audit-locked firmware, ensuring each run aligns with CFR Part 11, while chemical plants rely on the flexibility to swap dispersion media across multiple product lines. Online at-line rigs sit beside reactors for ten-minute turnaround on shift-change checks, bridging the gap for firms uneasy about fully integrating sensors into pressurized loops.
Inline probes, expected to clock a 6.89% CAGR, benefit from continuous-manufacturing pushes that make real-time release tempting once validation costs decline. Sapphire-glass windows withstand abrasive slurries, and edge computers compress spectra into summary statistics before posting to plant historians, trimming cybersecurity exposure. Early adopters in US biologics fill-finish suites use inline laser diffraction to flag nozzle fouling within seconds, while cathode lines in China deploy focused-beam reflectance units to optimize granulation energy. Smaller firms still hesitate because requalifying an established batch method can run USD 50,000 in consultant hours, but vendor-financed pilots are closing that gap.
By End-User Industry: Pharma Leads, Batteries Surge
Pharmaceutical and biopharmaceutical buyers generated 37.91% of demand in 2025 and continue to anchor the particle size analysis market. Generic drug makers rely on laser-diffraction histograms to demonstrate bioequivalence, while biosimilar developers utilize nanoparticle tracking to verify the parity of protein aggregates with reference biologics. Data-integrity clampdowns prompt many facilities to duplicate analyzers across QA and QC labs for redundancy, effectively doubling instrument footprint. Outsourced development firms mirror client setups to avoid method-transfer friction, locking in stable multi-year service contracts for vendors.
Energy and battery materials represent the fastest-growing segment, with a 7.66% CAGR, as cathode D50 tolerances narrow to ±2 µm and solid-state electrolytes pursue sub-5 µm medians. The particle size analysis market size within gigafactories is expected to grow further when inline probes stream data into manufacturing execution systems, which adjust milling speed or binder ratios on the fly, resulting in a reduction of scrap by double-digit percentages. Catalyst producers, food processors, and mineral concentrators round out demand with steady orders tied to capacity expansions rather than greenfield builds. Procurement approaches diverge: pharma buyers prize 21 CFR Part 11 templates and vendor audit trails, whereas battery makers negotiate aggressively on throughput and consumable costs, welcoming credible newcomers that hit accuracy benchmarks.
Geography Analysis
North America accounted for 37.79% of the 2025 revenue. Intensive FDA inspection schedules have made particle-size validation a non-negotiable dossier element, and the region’s biopharma clusters continue to drive demand for replacement systems. Midwest and Southeastern battery gigafactories integrate dozens of inline probes to monitor cathode slurries, while Canada’s potash and critical-mineral assets sustain steady wet-analysis sales. Installed-base maturity means that replacement rather than greenfield projects dominate, so vendors pivot to service contracts and software upgrades.
Asia-Pacific is projected to post a 7.27% CAGR through 2031, led by China’s dominance in lithium-ion technology and subsidies for domestic instrumentation. Local producers, Bettersize Instruments and Winner Particle, expand within mid-tier price bands, eroding market share from imported systems. Japan’s quality-obsessed pharmaceutical and ceramics sectors continue to buy premium analyzers, and South Korea’s display and semiconductor fabs deploy particle-size checks to qualify CMP slurries. India’s generics industry upgrades its labs to meet US and EU data-integrity requirements, while Australia leverages inline analyzers in mineral processing.
Europe balances mature adoption with continuous manufacturing directives. German chemical and automotive plants embed particle-size sensors into digital twin platforms, and the United Kingdom’s dual regulatory landscape drives duplicate instrumentation to satisfy both domestic and EU authorities. France deploys particle-size analyzers in nuclear fuel and aerospace composites where traceability over decades is essential. The Middle East and Africa are gaining traction through mining, and South America is showing a budding uptake in agricultural spray analysis, with Brazil and Argentina leading the adoption.

Regulatory Landscape
Particle size analysis is shaped by pharmaceutical validation expectations and cross-industry measurement standards that buyers use to defend data traceability in audits. In pharmaceuticals, the FDA Q2(R2) analytical validation revision (2024) and complementary ICH Q14 guidance raise the bar for method robustness and lifecycle validation, which increases demand for documented performance, audit trails (for example, 21 CFR Part 11-ready workflows), and orthogonal confirmation for sub-micron distributions.
Across manufacturing and electronics environments, standardization anchors procurement and qualification. ISO 13320:2020 remains a widely cited benchmark for laser diffraction method validation, while ASTM E2651-25 provides a current guide for powder particle size analysis techniques. Clean manufacturing requirements add another layer in electronics, with EN ISO 14644-14:2026 formalizing a harmonized approach to assessing cleanroom equipment suitability for airborne particle control, and SEMI F121 guiding evaluation of metrology for particle precursors in ultrapure water. Together, these frameworks support tighter particle monitoring practices in semiconductor fabrication and related yield-protection processes.
Value Chain Analysis
The particle size analysis value chain covers upstream optics, lasers, detectors, precision mechanics, and embedded software, which instrument OEMs combine into platforms configured around dispersion hardware (wet, dry, spray) and measurement modalities (laser diffraction, dynamic light scattering, nanoparticle tracking, imaging, SPOS/MRPS, and related single-particle approaches). Midstream, OEMs and subsystem suppliers depend on calibration standards and reference materials, while application development and method templates are increasingly bundled into software to reduce operator dependency and speed qualification for regulated users.
Downstream channels include direct sales to large pharmaceutical, battery, and semiconductor accounts, supported by distributors for academia and mid-tier industrial labs. Implementation and aftermarket services remain structurally important, covering installation qualification/operational qualification, periodic verification, consumables (cells, dispersants, filtration), and service contracts. In electronics and semiconductor flows, particle measurement is embedded into process ecosystems such as CMP slurry quality control and ultrapure water monitoring, where standards such as SEMI F121 help align particle monitoring needs across chemical suppliers, metrology providers, and fabs. The shift from offline sampling toward at-line and inline monitoring supports faster feedback loops and lower defect risk.
Competitive Landscape
Malvern Panalytical, Horiba, and Beckman Coulter jointly hold an estimated 45-50% share; however, more than 20 regional and niche providers prevent a price oligopoly. Platform integration is the unifying theme: vendors bundle size, zeta potential, and molecular-weight data inside FDA-ready software ecosystems. Malvern Panalytical’s 2024 OmniTrust firmware incorporates 21 CFR Part 11 compliance, while Horiba’s 2025 alliance with Retsch integrates milling and particle sizing to minimize sample preparation variability. Service revenue, software subscriptions, and spare parts account for 30-40% of top-line revenue, insulating incumbents against capital-expenditure cycles.
White-space innovation focuses on microfluidic lab-on-chip devices that embed disposable cartridges for point-of-care diagnostics and environmental monitoring. IZON Science and Particle Sizing Systems spearhead commercialization but must reassure regulators on calibration traceability. Software-only startups apply computer vision to smartphone microscopy, democratizing access yet still chasing repeatability. Vendors that demonstrate sub-50 nm resolution, automated sample preparation, and AI-driven anomaly detection routinely win specifications at pharmaceutical and battery plants, checking all procurement boxes in terms of accuracy, compliance, and uptime.
Particle Size Analysis Industry Leaders
Malvern Panalytical Ltd
Horiba Ltd
Beckman Coulter Inc.
Agilent Technologies Inc.
Microtrac MRB
- *Disclaimer: Major Players sorted in no particular order

Market Opportunities and Future Outlook
Opportunities are building around faster, more information-dense measurements that combine size and shape, and around single-particle sensitivity for nanometer-scale contaminants and advanced formulations. HORIBA introduced its Partica platform in 2026 to combine laser diffraction with dynamic imaging, emphasizing rapid particle size distribution and shape analysis, and aligning with labs and plants that want higher throughput without adding separate instruments. In parallel, Bruker introduced iNTApharma in 2026 for label-free nanoparticle characterization in mRNA drug and gene therapy workflows, reinforcing demand for native-state measurements where concentration and size distributions matter for release decisions.
Industrial whitespace is also visible in semiconductor-related contamination control, especially ultrapure water and CMP slurry monitoring, where SEMI F121 highlights the need to evaluate metrology for particle precursors in ultrapure water. That direction supports preventative monitoring rather than end-of-line inspection, favoring inline and at-line architectures, tighter integration with fluid management systems, and tools that can resolve smaller particle populations and related attributes (for example, refractive index cues to help trace contamination sources). The pull supports multi-technique portfolios, automation that reduces sample-prep variability, and software packages designed for documented traceability across pharma, energy materials, and high-precision electronics manufacturing.
Recent Industry Developments
- March 2026: HORIBA released the Partica particle size and shape analyzer that combines laser diffraction with dynamic imaging, with a sequential launch starting April 1, 2026. The system targets faster measurement cycles for research and QC, supporting users that need both particle size distribution and morphology signals in a single workflow. The launch reinforces vendor differentiation around multi-technique integration and throughput, particularly for complex formulations and advanced materials.
- July 2025: Malvern Panalytical joined the International Pharmaceutical Aerosol Consortium on Regulation & Science (IPAC-RS) as an associate member. The move brings the company closer to evolving regulatory science for orally inhaled and nasal drug products, where aerodynamic particle-size distribution requirements influence instrument selection and validation practices. Participation also supports method harmonization and increases the emphasis on compliance-ready software and documentation in vendor offerings.
- July 2024: Malvern Panalytical announced a definitive agreement to acquire Micromeritics for USD 630 million plus deferred consideration, subject to regulatory approval. The transaction broadened Malvern Panalyticals materials characterization footprint by adding complementary particle characterization and related physical analysis capabilities. This consolidation strengthens bundled platform strategies that appeal to pharma, chemicals, and advanced materials labs seeking fewer vendors across qualification, service, and data integrity needs.


Research Methodology Framework and Report Scope
Market Definition and Coverage
This market covers the revenues generated from particle size analysis solutions used to measure and monitor particle and powder size distributions in laboratory and process settings, including relevant instruments, supporting components, and the related software and services tied to the measurement workflow.
Scope exclusions: We exclude broad lab instruments that do not perform particle sizing as a primary function, along with general lab consumables and unrelated contract testing that is not focused on particle size characterization.
Segmentation Overview
- By Technology
- Laser Diffraction
- Dynamic Light Scattering
- Nanoparticle Tracking Analysis
- Imaging Analysis
- Coulter Principle
- Taylor Dispersion Analysis
- Resonant Mass Measurement
- By Dispersion Type
- Wet Particle Analyzers
- Dry Particle Analyzers
- Spray Particle Analyzers
- By Mode of Analysis
- Offline / Laboratory Systems
- Online / At-Line Systems
- Inline / Real-Time Process Systems
- By End-User Industry
- Pharmaceuticals and Biopharmaceuticals
- Chemicals and Petrochemicals
- Food, Beverage and Nutrition
- Mining, Minerals and Cement
- Agriculture and Forestry
- Energy and Battery Materials
- Environmental and Regulatory Labs
- By Geography
- North America
- United States
- Canada
- Mexico
- Europe
- Germany
- United Kingdom
- France
- Russia
- Rest of Europe
- Asia-Pacific
- China
- Japan
- India
- South Korea
- Australia
- Rest of Asia-Pacific
- Middle East and Africa
- Middle East
- Saudi Arabia
- United Arab Emirates
- Rest of Middle East
- Africa
- South Africa
- Egypt
- Rest of Africa
- Middle East
- South America
- Brazil
- Argentina
- Rest of South America
- North America
Data Sources, Market Sizing, and Validation
Desk Research
Desk research was used to build the initial picture of demand and adoption for particle size analysis across regulated and industrial labs. We reviewed public information such as US FDA guidance and pharmacopeia references (for example, USP style testing expectations), ASTM and ISO method standards linked to particle characterization, and trade data signals from customs statistics where instrument trade is visible. We also relied on peer reviewed journals and conference proceedings to understand technique mix shifts, like laser diffraction versus dynamic light scattering, and where nanoparticle tracking is used.
Alongside these, we referenced company annual reports, product catalogs, investor presentations, and credible press coverage to map product positioning, typical pricing bands, and replacement cycles. We used a paid subscription for company financials and intelligence, plus a patent database, selectively to cross check business line exposure and new feature directions, without over relying on marketing claims. These desk sources are not exhaustive, and many other public references were also used for data collection, validation, and research clarification.
Primary Interviews and Surveys
Primary work was carried out through expert interviews and structured surveys with instrument suppliers, distributors, application specialists, lab managers, and procurement teams who buy or specify particle sizing equipment. For global coverage, feedback was balanced across major manufacturing hubs and mature testing markets, which helped us validate adoption by end use, confirm typical system configurations, and test pricing assumptions used in the model. Where desk data was thin (such as service attach rates and online or inline measurement penetration), gaps were narrowed through follow up discussions and careful averaging across comparable user profiles.
Distribution of primary research fieldwork respondents
| Company type | Respondent position | Region |
|---|---|---|
| Top tier: 37% | CXOs: 15% | APAC: 40% |
| Mid tier: 45% | Functional/Unit leaders: 26% | EMEA: 34% |
| Smaller Players: 18% | Managers: 59% | Americas: 26% |
Market-Sizing & Forecasting
Sizing starts from a top down build that reconstructs the addressable instrument and service demand pool by linking end user testing intensity to the installed base of relevant labs and production sites, and then applying realistic penetration by technique and mode of analysis. That structure was then corroborated with selective bottom-up approximations, where sampled supplier revenues, channel checks, and an ASP times volume view (by technique and configuration) were used to confirm totals and adjust outliers.
Key inputs used in the model include the mix of measurement technologies (for example, laser diffraction, imaging, and dynamic light scattering), the split between offline laboratory versus online or inline monitoring, typical replacement and calibration cycles, average selling price progression by system class, and service and software attachment rates. To keep the forecast reproducible, scenario analysis was applied around variables that change faster than volume, such as ASP movement, regulatory driven testing intensity in pharmaceuticals, and process adoption in mining, minerals, and battery materials. Where bottom-up visibility was incomplete for smaller geographies or niche techniques, we bridged the gap using ratio based scaling from validated markets, followed by a second pass check with interview ranges.
Data Validation & Update Cycle
Validation is done by triangulating the model outputs against independent signals, such as reported instrument business performance, technique level adoption commentary, and the implied spend per lab or per production site in key industries. When a region or segment shows an unusual jump, the assumptions behind penetration, ASP, and service rates are rechecked, and we recontact sources if the variance stays outside a reasonable band.
Before sign off, the work goes through multi step analyst review, including consistency checks across years and a final reconciliation of totals back to the market definition. Reports are refreshed annually, and interim updates are made when material events affect pricing, supply, or demand patterns. Right before delivery, a final pass is completed so clients receive the latest updated view.
Mordor Intelligence's Particle Size Analysis Market Size Measured Against Other Published Estimates
Published market sizes for particle size analysis often do not match because the refresh timing, the currency conversion cut off, and the way average selling prices are rolled forward can vary a lot across studies. Some estimates also treat services and software differently, which can change the total even if the instrument volumes are similar.
A common gap driver is whether online, at-line, and inline monitoring deployments are counted as part of the same spend pool as standard lab systems, and whether service attach is applied as a flat percentage or tied to installed base aging. In our work, the refresh cadence is tied to recent pricing movements and new system introductions, and then validated through end user checks before totals are locked, which is a practical reason the final number can differ in Mordor Intelligence outputs.
Benchmark comparison
| Source | Market Size | Gaps in Research Methodology |
|---|---|---|
| Mordor Intelligence | USD 489.26 M (2026) | |
| Global Research Publisher A | USD 433.10 M (2025) | Uses an earlier base year and applies a slower price progression curve, and it also appears to bundle instruments and related services in a way that smooths year to year changes. |
| Industry Research Group B | USD 400.00 M (2024) | Starts from a lower base year value and leans on broader technique categories, which can understate higher ASP configurations and newer inline adoption in process industries. |
The spread in the table is mainly explained by timing and what is assumed for ASP movement and service attachment rather than a disagreement that the end markets exist. By keeping assumptions traceable to technique mix, mode of analysis, and interview tested pricing bands, the resulting figure stays easier to reproduce and update when market conditions change.


Key Questions Answered in the Report
How large is the particle size analysis market in 2026?
The market stood at USD 489.26 million in 2026 and is set to reach USD 661.56 million by 2031, reflecting a 6.22% CAGR.
Which technology dominates particle size measurement?
Laser diffraction maintained 32.74% of 2025 revenue because of its broad dynamic range and ISO 13320 validation pathway.
What end-user vertical is growing fastest?
Energy and battery materials are forecast for a 7.66% CAGR as producers tighten cathode and electrolyte particle tolerances.
Why are inline probes gaining traction?
Continuous-manufacturing and Industry 4.0 programs favor real-time feedback loops, and inline systems cut scrap and speed release.
What is the primary barrier to wider adoption?
High capital costs, often surpassing USD 100,000 per unit, and ongoing maintenance fees limit uptake among smaller labs.
How does AI change particle size analysis?
Embedded machine-learning models classify morphology, flag anomalies, and automate troubleshooting, reducing operator workload and downtime.
Page last updated on:


