Table Grape Market Size and Share
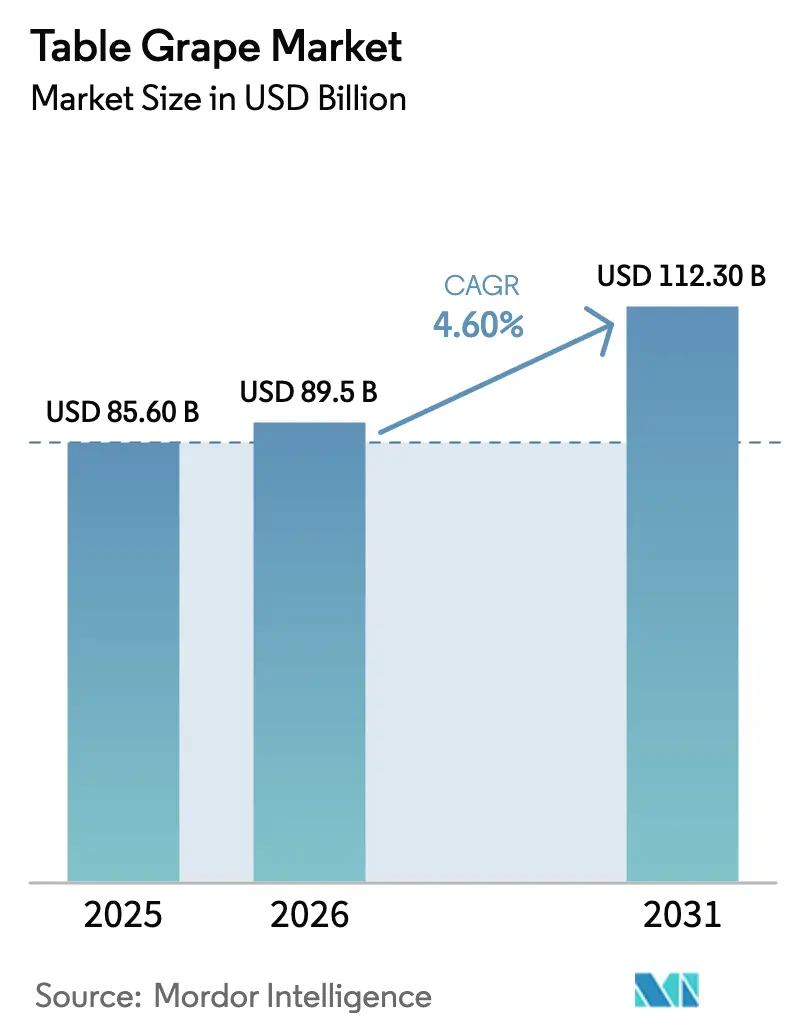
Table Grape Market Analysis by Mordor Intelligence
The table grape market size was valued at USD 85.6 billion in 2025 and estimated to grow from USD 89.5 billion in 2026 to reach USD 112.30 billion by 2031, at a CAGR of 4.6% during the forecast period (2026-2031). The demand momentum is driven by the Asia-Pacific region, which holds a significant share of the global market value, and Africa, which is experiencing the fastest growth rate among all regions. Proprietary seedless genetics, controlled-atmosphere logistics, and blockchain-enabled traceability are widening price spreads between premium and commodity fruit while allowing exporters to serve distant Asian and Middle Eastern buyers with limited quality loss. At the same time, climate volatility and escalating wage costs compress margins in California, South Africa, and Mediterranean Europe, accelerating trials of agri-voltaic shade structures and AI-driven yield-forecasting tools. Rising organic certification, which commands retail premiums of 15–25%, further differentiates the supply base as growers invest in biological pest control and three-year transition programs.
Key Report Takeaways
By geography, Asia-Pacific led with 45% of the table grape market share in 2025, while Africa is forecast to expand at a 5.6% CAGR through 2031.
Note: Market size and forecast figures in this report are generated using Mordor Intelligence’s proprietary estimation framework, updated with the latest available data and insights as of January 2026.
Global Table Grape Market Trends and Insights
Drivers Impact Analysis*
| Driver | (~) % Impact on CAGR Forecast | Geographic Relevance | Impact Timeline |
|---|---|---|---|
| Growing global demand for fresh fruit | +1.2% | Global, strongest in Asia-Pacific cities and Middle Eastern import hubs | Medium term (2–4 years) |
| Expansion of controlled-atmosphere cold chain logistics | +0.9% | South America, South Africa, and China export corridors to Asia and Middle East | Short term (≤2 years) |
| Increase in certified-organic vineyard acreage | +0.7% | North America and European Union, spill-over to Chile and Peru | Medium term (2–4 years) |
| Rapid adoption of proprietary seedless cultivars | +1.1% | Global, led by North America, South Africa, Peru, and Australia | Long term (≥4 years) |
| Blockchain-based traceability premiums in export contracts | +0.3% | Europe and North America import markets, pilots in Peru and South Africa | Long term (≥4 years) |
| Agri-voltaic shade structures improving micro-climates | +0.4% | California, South Africa Western Cape, Spain, and Italy | Medium term (2–4 years) |
| Source: Mordor Intelligence | |||
Growing Global Demand for Fresh Fruit
Urban middle-class expansion in China, India, and Gulf Cooperation Council economies is boosting per-capita consumption, with China alone absorbing 13.2 million metric tons of table grapes each year despite its new role as a top exporter [1]Source: USDA Foreign Agricultural Service, “China Table Grape Production and Trade,” fas.usda.gov. Health-conscious shoppers in the United States and Europe are replacing processed snacks with fresh fruit, driving the market availability to a record 4.34 kg per person in 2024/25. Retail chains in the United Arab Emirates and Saudi Arabia are expanding chilled-aisle space, creating year-round windows for Southern Hemisphere suppliers. Snackable, high-Brix seedless cultivars now compete with confectionery for impulse purchases, boosting premiums for proprietary varieties. While regulation remains limited, strict phytosanitary rules from the European Food Safety Authority and the United States Food and Drug Administration determine import eligibility.
Expansion of Controlled-Atmosphere Cold Chain Logistics
Lowering oxygen to 2–5% and raising carbon dioxide to 10–15% extends the shelf life of table grapes by up to 50%, letting South America exporters reach Asian markets with minimal quality loss. Peru invested USD 120 million in refrigerated containers and port cold stores during 2024–2025 to support a record 770,000 metric ton export season. South Africa upgraded Durban and Cape Town port infrastructure in 2024, cutting spoilage on China-bound cargoes to below 2%. High capital intensity favors vertically integrated grower-packers that amortize costs across multiple crops and seasons. Compliance with International Plant Protection Convention wood-packaging standards and Global Cold Chain Alliance temperature-monitoring requirements has become a fundamental criterion for securing premium contracts[3]Source: International Plant Protection Convention, “ISPM 15 Wood Packaging Standards,” ippc.int.
Increase in Certified-Organic Vineyard Acreage
Certified-organic vineyard land in the United States expanded 8% in 2025 to 12,400 hectares as growers pursued 15–25% retail premiums. European Union organic imports climbed 11% in 2024/25, led by Germany, the Netherlands, and the United Kingdom. European Union standards mandate a three-year transition to no synthetic pesticides, lifting production costs by 20–30% while unlocking premium retail channels. Peru’s organic area grew 14% in 2024, concentrated in Ica and Piura regions, where biological pest control meets export specifications. Disease-resistant proprietary cultivars are gaining favor because they lower fungicide dependence and ease certification.
Rapid Adoption of Proprietary Seedless Cultivars
Sun World’s Autumn Crisp and IFG’s Cotton Candy command 20–40% price premiums and pay USD 0.10–0.25 per-kilogram royalties to breeders. California growers replanted 2,800 hectares with licensed varieties in 2024–2025 to extend harvest windows and cut post-harvest loss. South Africa’s Hex and Orange River valleys raised the Sweet Globe and Crimson Seedless area by 9% in 2024/25, targeting European and Asian buyers. International Union for the Protection of New Varieties of Plants (UPOV) membership in 78 countries underpins royalty enforcement, though gaps in emerging markets reduce revenue capture. Large growers negotiate volume discounts on license fees, widening the cost gap with smaller competitors.
Restraints Impact Analysis*
| Restraint | (~) % Impact on CAGR Forecast | Geographic Relevance | Impact Timeline |
|---|---|---|---|
| Climate-change-driven weather volatility | −0.8% | Global, acute in California, South Africa Western Cape, Mediterranean Europe | Short term (≤2 years) |
| Rising labor shortages and wage costs | −0.6% | North America, South Africa, Chile, Peru harvest regions | Medium term (2–4 years) |
| Stricter MRLs in Eurasian Customs Union | −0.3% | China, India, Central Asian exporters to Russia, Kazakhstan, Belarus | Medium term (2–4 years) |
| Port congestion from Red Sea route security risks | −0.2% | South Africa, India, and Middle Eastern lanes via Suez Canal | Short term (≤2 years) |
| Source: Mordor Intelligence | |||
Climate-Change-Driven Weather Volatility
California's table grape production experienced substantial losses during the 2023-24 season, marking the third consecutive year of decline due to irrigation damage caused by Hurricane Hilary. South Africa saw 15–20% yield swings in 2024/25, with Orange River frost reducing early-season set rates. Spain and Italy endured July heat waves above 40 °C in both 2024 and 2025, compressing harvest windows and overloading cold storage [2]Source: European Environment Agency, “Climate Change Impacts on European Agriculture,” eea.europa.eu. Growers are pivoting to heat-tolerant and frost-resistant genetics, but 10–15-year breeding cycles delay commercial release. Insurance coverage remains below 30%, leaving producers exposed to revenue shocks.
Rising Labor Shortages and Wage Costs
United States H-2A visa petitions rose 12% in 2025, yet California still lacked more than 8,000 pickers at peak harvest, leaving 5% of fruit unpicked. South Africa’s mandated wage floor climbed from ZAR 27.58 (USD 1.50) in 2024 to ZAR 29.15 (USD 1.59) in 2025, squeezing exporter margins. Peru’s labor costs increased 9% in 2024 after union negotiations in Ica and La Libertad regions, where grape and asparagus campaigns overlap. Mechanical harvesters achieve 60–70% efficiency in juice grapes but remain too rough for table fruit. Compliance with International Labour Organization Convention 184 on farm safety is now a prerequisite for many European and United States retail contracts, raising costs for smaller growers.
*Our forecasts treat driver/restraint impacts as directional, not additive. The impact forecasts reflect baseline growth, mix effects, and variable interactions.
Geography Analysis
In 2026, the Asia-Pacific region accounted for 45% of the table grape market value, driven by China’s extensive production base and export activities, positioning it alongside Peru as a leading global supplier. Strong domestic demand ensures that most Chinese table grapes are consumed within the country, while the growing cold-chain infrastructure is enabling exports of premium seedless varieties to Southeast Asia and the Middle East. India remains a significant exporter by value, with Maharashtra contributing over two-thirds of the country’s production, dominated by the Thompson Seedless variety. Japan and Australia continue to be high-value import markets, with Japanese retailers paying 30–50% premiums for large-berry, high-Brix grapes imported from Peru and Chile. Additionally, urbanization in tier-two cities in China and the expansion of modern retail outlets in Indian metropolitan areas are increasing chilled-produce shelf space, further enhancing the region’s table grape market penetration.
Africa is experiencing the fastest regional growth, with a 5.6% CAGR projected through 2031. This growth is driven by Kenya's expanding drip-irrigation infrastructure and South Africa's robust export performance. In South Africa, the Hex River region remains the primary production hub, with Crimson Seedless, Sweet Globe, and Autumn Crisp varieties dominating vineyard plantings, indicating a shift toward premium seedless grapes. Kenya's greenhouse expansions and irrigation investments are enhancing its role as an off-season supplier to European and Gulf markets. In South America, Peru maintains its position as the leading global exporter due to counter-seasonal advantages, while Chile faces increasing export challenges due to water scarcity. To address this, Chilean growers are adopting desalination and wastewater-recycling technologies.
North America and Europe exhibit stable domestic production but an increasing dependence on imports, highlighting structural supply gaps alongside consistent demand. In the United States, imports continue to sustain record per-capita availability. Meanwhile, Europe’s major producers, Spain, Italy, and France, depend on imports from South Africa, Peru, and Chile to satisfy consumer needs. In Spain, growers in Murcia and Valencia are experimenting with agri-voltaic systems to reduce heat stress, while Italian producers in Puglia and Sicily are adopting licensed seedless varieties to remain competitive against imports from the Southern Hemisphere. The European Food Safety Authority’s stringent oversight of maximum residue levels ensures high compliance across all sources.
Mordor Intelligence provides coverage of the table grape market across other key regional markets. Detailed country-level analysis extends to Spain and China incorporating local coverage and market participation, as required.
Competitive Landscape
The table grape market remains moderately fragmented, with the top five exporters accounting for the majority share of global shipments, and the next tier populated by hundreds of mid-scale growers focused on single-country sales. Proprietary genetics are the dominant competitive lever. Sun World International and International Fruit Genetics collectively license a significant area of premium seedless varieties, generating royalties within a defined range, ensuring consistent revenue streams. Their Autumn Crisp, Sweet Celebration, Cotton Candy, and Sweet Sapphire cultivars capture 20–40% retail premiums in North American, European, and Asian supermarkets, widening margin gaps versus commodity Thompson Seedless fruit.
Vertically integrated grower-packers such as Capespan, Vanguard International, and Dole plc secure both farming and distribution margins by owning orchards, packhouses, cold stores, and charters on main East–West routes. In 2025, Unifrutti strengthened its South American footprint through the acquisition of Safco Peru, adding export capacity that reinforces its position in North America and Asia. In 2025, South Africa’s SATI (South African Table Grape Industry) expanded into the Philippines, diversifying away from European dependence and mitigating the risk of the Red Sea route.
Technological adoption is producing a two-tier cost structure. Capitalized operators deploy AI-based yield forecasting, blockchain traceability, and agri-voltaic shade to lower water use, reduce paperwork, and generate solar power. Smaller growers attempt to bridge the gap through cooperatives that pool cold-storage and licensing resources, but coordination costs and free-rider issues limit scale gains. Consolidation pressure is projected to increase due to rising food safety regulations, stricter royalty enforcement, and higher cold-chain investment thresholds. These factors are likely to benefit multi-origin suppliers with institutional capital and direct-to-retail contracts.
Recent Industry Developments
- December 2025: Unifrutti completed the acquisition of Safco Peru, adding 1,200 hectares of grapes production and 18,000 metric tons of export capacity to its South American portfolio, strengthening its reach in North America and Asia-Pacific.
- August 2025: The United States imposed a 30% tariff on South African table grapes under Section 232 of the Trade Expansion Act, pushing exporters toward China and Southeast Asia.
- February 2025: South Africa has gained official access to export fresh table grapes to the Philippines for the first time, after a decade of negotiations. This development, finalized by the Department of Agriculture, presents a valuable opportunity for South African producers to strengthen their presence in the Asia Pacific and reduce reliance on the European Union and the United Kingdom's markets.


Global Table Grape Market Report Scope
Table grapes are varieties of grapes cultivated primarily for fresh consumption, rather than for wine, juice, or raisin production. They are typically characterized by large, firm berries, thin skins, and a sweet flavor, often seedless, and are marketed for their freshness, appearance, and eating quality.
The Table Grape Market Report is Segmented by Geography (North America, Europe, Asia-Pacific, Africa, and More). The Report Includes Production Analysis (Volume), Consumption Analysis (Value and Volume), Export Analysis (Value and Volume), Import Analysis (Value and Volume), Wholesale Price Trend Analysis and Forecast, regulatory framework, List of key players, Logistics and Infrastructure, and Seasonality Analysis. The Market Forecasts are Provided in Terms of Value (USD) and Volume (Metric Tons).
| North America | United States | Production Analysis (Area Harvested, Yield, and Production Volume) |
| Consumption Analysis (Consumption Value and Volume) | ||
| Import Market Analysis (Import Value, Volume, and Key Supplying Markets) | ||
| Export Market Analysis (Export Value, Volume, and Key Destination Markets) | ||
| Wholesale Price Trend Analysis and Forecast | ||
| Regulatory Framework | ||
| List of Key Players | ||
| Logistics and Infrastructure | ||
| Seasonality Analysis | ||
| Canada | Production Analysis (Area Harvested, Yield, and Production Volume) | |
| Consumption Analysis (Consumption Value and Volume) | ||
| Import Market Analysis (Import Value, Volume, and Key Supplying Markets) | ||
| Export Market Analysis (Export Value, Volume, and Key Destination Markets) | ||
| Wholesale Price Trend Analysis and Forecast | ||
| Regulatory Framework | ||
| List of Key Players | ||
| Logistics and Infrastructure | ||
| Seasonality Analysis | ||
| Europe | Germany | Production Analysis (Area Harvested, Yield, and Production Volume) |
| Consumption Analysis (Consumption Value and Volume) | ||
| Import Market Analysis (Import Value, Volume, and Key Supplying Markets) | ||
| Export Market Analysis (Export Value, Volume, and Key Destination Markets) | ||
| Wholesale Price Trend Analysis and Forecast | ||
| Regulatory Framework | ||
| List of Key Players | ||
| Logistics and Infrastructure | ||
| Seasonality Analysis | ||
| United Kingdom | Production Analysis (Area Harvested, Yield, and Production Volume) | |
| Consumption Analysis (Consumption Value and Volume) | ||
| Import Market Analysis (Import Value, Volume, and Key Supplying Markets) | ||
| Export Market Analysis (Export Value, Volume, and Key Destination Markets) | ||
| Wholesale Price Trend Analysis and Forecast | ||
| Regulatory Framework | ||
| List of Key Players | ||
| Logistics and Infrastructure | ||
| Seasonality Analysis | ||
| France | Production Analysis (Area Harvested, Yield, and Production Volume) | |
| Consumption Analysis (Consumption Value and Volume) | ||
| Import Market Analysis (Import Value, Volume, and Key Supplying Markets) | ||
| Export Market Analysis (Export Value, Volume, and Key Destination Markets) | ||
| Wholesale Price Trend Analysis and Forecast | ||
| Regulatory Framework | ||
| List of Key Players | ||
| Logistics and Infrastructure | ||
| Seasonality Analysis | ||
| Asia-Pacific | China | Production Analysis (Area Harvested, Yield, and Production Volume) |
| Consumption Analysis (Consumption Value and Volume) | ||
| Import Market Analysis (Import Value, Volume, and Key Supplying Markets) | ||
| Export Market Analysis (Export Value, Volume, and Key Destination Markets) | ||
| Wholesale Price Trend Analysis and Forecast | ||
| Regulatory Framework | ||
| List of Key Players | ||
| Logistics and Infrastructure | ||
| Seasonality Analysis | ||
| Australia | Production Analysis (Area Harvested, Yield, and Production Volume) | |
| Consumption Analysis (Consumption Value and Volume) | ||
| Import Market Analysis (Import Value, Volume, and Key Supplying Markets) | ||
| Export Market Analysis (Export Value, Volume, and Key Destination Markets) | ||
| Wholesale Price Trend Analysis and Forecast | ||
| Regulatory Framework | ||
| List of Key Players | ||
| Logistics and Infrastructure | ||
| Seasonality Analysis | ||
| India | Production Analysis (Area Harvested, Yield, and Production Volume) | |
| Consumption Analysis (Consumption Value and Volume) | ||
| Import Market Analysis (Import Value, Volume, and Key Supplying Markets) | ||
| Export Market Analysis (Export Value, Volume, and Key Destination Markets) | ||
| Wholesale Price Trend Analysis and Forecast | ||
| Regulatory Framework | ||
| List of Key Players | ||
| Logistics and Infrastructure | ||
| Seasonality Analysis | ||
| Japan | Production Analysis (Area Harvested, Yield, and Production Volume) | |
| Consumption Analysis (Consumption Value and Volume) | ||
| Import Market Analysis (Import Value, Volume, and Key Supplying Markets) | ||
| Export Market Analysis (Export Value, Volume, and Key Destination Markets) | ||
| Wholesale Price Trend Analysis and Forecast | ||
| Regulatory Framework | ||
| List of Key Players | ||
| Logistics and Infrastructure | ||
| Seasonality Analysis | ||
| South America | Bolivia | Production Analysis (Area Harvested, Yield, and Production Volume) |
| Consumption Analysis (Consumption Value and Volume) | ||
| Import Market Analysis (Import Value, Volume, and Key Supplying Markets) | ||
| Export Market Analysis (Export Value, Volume, and Key Destination Markets) | ||
| Wholesale Price Trend Analysis and Forecast | ||
| Regulatory Framework | ||
| List of Key Players | ||
| Logistics and Infrastructure | ||
| Seasonality Analysis | ||
| Brazil | Production Analysis (Area Harvested, Yield, and Production Volume) | |
| Consumption Analysis (Consumption Value and Volume) | ||
| Import Market Analysis (Import Value, Volume, and Key Supplying Markets) | ||
| Export Market Analysis (Export Value, Volume, and Key Destination Markets) | ||
| Wholesale Price Trend Analysis and Forecast | ||
| Regulatory Framework | ||
| List of Key Players | ||
| Logistics and Infrastructure | ||
| Seasonality Analysis | ||
| Argentina | Production Analysis (Area Harvested, Yield, and Production Volume) | |
| Consumption Analysis (Consumption Value and Volume) | ||
| Import Market Analysis (Import Value, Volume, and Key Supplying Markets) | ||
| Export Market Analysis (Export Value, Volume, and Key Destination Markets) | ||
| Wholesale Price Trend Analysis and Forecast | ||
| Regulatory Framework | ||
| List of Key Players | ||
| Logistics and Infrastructure | ||
| Seasonality Analysis | ||
| Paraguay | Production Analysis (Area Harvested, Yield, and Production Volume) | |
| Consumption Analysis (Consumption Value and Volume) | ||
| Import Market Analysis (Import Value, Volume, and Key Supplying Markets) | ||
| Export Market Analysis (Export Value, Volume, and Key Destination Markets) | ||
| Wholesale Price Trend Analysis and Forecast | ||
| Regulatory Framework | ||
| List of Key Players | ||
| Logistics and Infrastructure | ||
| Seasonality Analysis | ||
| Middle East | Saudi Arabia | Production Analysis (Area Harvested, Yield, and Production Volume) |
| Consumption Analysis (Consumption Value and Volume) | ||
| Import Market Analysis (Import Value, Volume, and Key Supplying Markets) | ||
| Export Market Analysis (Export Value, Volume, and Key Destination Markets) | ||
| Wholesale Price Trend Analysis and Forecast | ||
| Regulatory Framework | ||
| List of Key Players | ||
| Logistics and Infrastructure | ||
| Seasonality Analysis | ||
| United Arab Emirates | Production Analysis (Area Harvested, Yield, and Production Volume) | |
| Consumption Analysis (Consumption Value and Volume) | ||
| Import Market Analysis (Import Value, Volume, and Key Supplying Markets) | ||
| Export Market Analysis (Export Value, Volume, and Key Destination Markets) | ||
| Wholesale Price Trend Analysis and Forecast | ||
| Regulatory Framework | ||
| List of Key Players | ||
| Logistics and Infrastructure | ||
| Seasonality Analysis | ||
| Africa | Kenya | Production Analysis (Area Harvested, Yield, and Production Volume) |
| Consumption Analysis (Consumption Value and Volume) | ||
| Import Market Analysis (Import Value, Volume, and Key Supplying Markets) | ||
| Export Market Analysis (Export Value, Volume, and Key Destination Markets) | ||
| Wholesale Price Trend Analysis and Forecast | ||
| Regulatory Framework | ||
| List of Key Players | ||
| Logistics and Infrastructure | ||
| Seasonality Analysis | ||
| South Africa | Production Analysis (Area Harvested, Yield, and Production Volume) | |
| Consumption Analysis (Consumption Value and Volume) | ||
| Import Market Analysis (Import Value, Volume, and Key Supplying Markets) | ||
| Export Market Analysis (Export Value, Volume, and Key Destination Markets) | ||
| Wholesale Price Trend Analysis and Forecast | ||
| Regulatory Framework | ||
| List of Key Players | ||
| Logistics and Infrastructure | ||
| Seasonality Analysis | ||
| By Geography | North America | United States | Production Analysis (Area Harvested, Yield, and Production Volume) |
| Consumption Analysis (Consumption Value and Volume) | |||
| Import Market Analysis (Import Value, Volume, and Key Supplying Markets) | |||
| Export Market Analysis (Export Value, Volume, and Key Destination Markets) | |||
| Wholesale Price Trend Analysis and Forecast | |||
| Regulatory Framework | |||
| List of Key Players | |||
| Logistics and Infrastructure | |||
| Seasonality Analysis | |||
| Canada | Production Analysis (Area Harvested, Yield, and Production Volume) | ||
| Consumption Analysis (Consumption Value and Volume) | |||
| Import Market Analysis (Import Value, Volume, and Key Supplying Markets) | |||
| Export Market Analysis (Export Value, Volume, and Key Destination Markets) | |||
| Wholesale Price Trend Analysis and Forecast | |||
| Regulatory Framework | |||
| List of Key Players | |||
| Logistics and Infrastructure | |||
| Seasonality Analysis | |||
| Europe | Germany | Production Analysis (Area Harvested, Yield, and Production Volume) | |
| Consumption Analysis (Consumption Value and Volume) | |||
| Import Market Analysis (Import Value, Volume, and Key Supplying Markets) | |||
| Export Market Analysis (Export Value, Volume, and Key Destination Markets) | |||
| Wholesale Price Trend Analysis and Forecast | |||
| Regulatory Framework | |||
| List of Key Players | |||
| Logistics and Infrastructure | |||
| Seasonality Analysis | |||
| United Kingdom | Production Analysis (Area Harvested, Yield, and Production Volume) | ||
| Consumption Analysis (Consumption Value and Volume) | |||
| Import Market Analysis (Import Value, Volume, and Key Supplying Markets) | |||
| Export Market Analysis (Export Value, Volume, and Key Destination Markets) | |||
| Wholesale Price Trend Analysis and Forecast | |||
| Regulatory Framework | |||
| List of Key Players | |||
| Logistics and Infrastructure | |||
| Seasonality Analysis | |||
| France | Production Analysis (Area Harvested, Yield, and Production Volume) | ||
| Consumption Analysis (Consumption Value and Volume) | |||
| Import Market Analysis (Import Value, Volume, and Key Supplying Markets) | |||
| Export Market Analysis (Export Value, Volume, and Key Destination Markets) | |||
| Wholesale Price Trend Analysis and Forecast | |||
| Regulatory Framework | |||
| List of Key Players | |||
| Logistics and Infrastructure | |||
| Seasonality Analysis | |||
| Asia-Pacific | China | Production Analysis (Area Harvested, Yield, and Production Volume) | |
| Consumption Analysis (Consumption Value and Volume) | |||
| Import Market Analysis (Import Value, Volume, and Key Supplying Markets) | |||
| Export Market Analysis (Export Value, Volume, and Key Destination Markets) | |||
| Wholesale Price Trend Analysis and Forecast | |||
| Regulatory Framework | |||
| List of Key Players | |||
| Logistics and Infrastructure | |||
| Seasonality Analysis | |||
| Australia | Production Analysis (Area Harvested, Yield, and Production Volume) | ||
| Consumption Analysis (Consumption Value and Volume) | |||
| Import Market Analysis (Import Value, Volume, and Key Supplying Markets) | |||
| Export Market Analysis (Export Value, Volume, and Key Destination Markets) | |||
| Wholesale Price Trend Analysis and Forecast | |||
| Regulatory Framework | |||
| List of Key Players | |||
| Logistics and Infrastructure | |||
| Seasonality Analysis | |||
| India | Production Analysis (Area Harvested, Yield, and Production Volume) | ||
| Consumption Analysis (Consumption Value and Volume) | |||
| Import Market Analysis (Import Value, Volume, and Key Supplying Markets) | |||
| Export Market Analysis (Export Value, Volume, and Key Destination Markets) | |||
| Wholesale Price Trend Analysis and Forecast | |||
| Regulatory Framework | |||
| List of Key Players | |||
| Logistics and Infrastructure | |||
| Seasonality Analysis | |||
| Japan | Production Analysis (Area Harvested, Yield, and Production Volume) | ||
| Consumption Analysis (Consumption Value and Volume) | |||
| Import Market Analysis (Import Value, Volume, and Key Supplying Markets) | |||
| Export Market Analysis (Export Value, Volume, and Key Destination Markets) | |||
| Wholesale Price Trend Analysis and Forecast | |||
| Regulatory Framework | |||
| List of Key Players | |||
| Logistics and Infrastructure | |||
| Seasonality Analysis | |||
| South America | Bolivia | Production Analysis (Area Harvested, Yield, and Production Volume) | |
| Consumption Analysis (Consumption Value and Volume) | |||
| Import Market Analysis (Import Value, Volume, and Key Supplying Markets) | |||
| Export Market Analysis (Export Value, Volume, and Key Destination Markets) | |||
| Wholesale Price Trend Analysis and Forecast | |||
| Regulatory Framework | |||
| List of Key Players | |||
| Logistics and Infrastructure | |||
| Seasonality Analysis | |||
| Brazil | Production Analysis (Area Harvested, Yield, and Production Volume) | ||
| Consumption Analysis (Consumption Value and Volume) | |||
| Import Market Analysis (Import Value, Volume, and Key Supplying Markets) | |||
| Export Market Analysis (Export Value, Volume, and Key Destination Markets) | |||
| Wholesale Price Trend Analysis and Forecast | |||
| Regulatory Framework | |||
| List of Key Players | |||
| Logistics and Infrastructure | |||
| Seasonality Analysis | |||
| Argentina | Production Analysis (Area Harvested, Yield, and Production Volume) | ||
| Consumption Analysis (Consumption Value and Volume) | |||
| Import Market Analysis (Import Value, Volume, and Key Supplying Markets) | |||
| Export Market Analysis (Export Value, Volume, and Key Destination Markets) | |||
| Wholesale Price Trend Analysis and Forecast | |||
| Regulatory Framework | |||
| List of Key Players | |||
| Logistics and Infrastructure | |||
| Seasonality Analysis | |||
| Paraguay | Production Analysis (Area Harvested, Yield, and Production Volume) | ||
| Consumption Analysis (Consumption Value and Volume) | |||
| Import Market Analysis (Import Value, Volume, and Key Supplying Markets) | |||
| Export Market Analysis (Export Value, Volume, and Key Destination Markets) | |||
| Wholesale Price Trend Analysis and Forecast | |||
| Regulatory Framework | |||
| List of Key Players | |||
| Logistics and Infrastructure | |||
| Seasonality Analysis | |||
| Middle East | Saudi Arabia | Production Analysis (Area Harvested, Yield, and Production Volume) | |
| Consumption Analysis (Consumption Value and Volume) | |||
| Import Market Analysis (Import Value, Volume, and Key Supplying Markets) | |||
| Export Market Analysis (Export Value, Volume, and Key Destination Markets) | |||
| Wholesale Price Trend Analysis and Forecast | |||
| Regulatory Framework | |||
| List of Key Players | |||
| Logistics and Infrastructure | |||
| Seasonality Analysis | |||
| United Arab Emirates | Production Analysis (Area Harvested, Yield, and Production Volume) | ||
| Consumption Analysis (Consumption Value and Volume) | |||
| Import Market Analysis (Import Value, Volume, and Key Supplying Markets) | |||
| Export Market Analysis (Export Value, Volume, and Key Destination Markets) | |||
| Wholesale Price Trend Analysis and Forecast | |||
| Regulatory Framework | |||
| List of Key Players | |||
| Logistics and Infrastructure | |||
| Seasonality Analysis | |||
| Africa | Kenya | Production Analysis (Area Harvested, Yield, and Production Volume) | |
| Consumption Analysis (Consumption Value and Volume) | |||
| Import Market Analysis (Import Value, Volume, and Key Supplying Markets) | |||
| Export Market Analysis (Export Value, Volume, and Key Destination Markets) | |||
| Wholesale Price Trend Analysis and Forecast | |||
| Regulatory Framework | |||
| List of Key Players | |||
| Logistics and Infrastructure | |||
| Seasonality Analysis | |||
| South Africa | Production Analysis (Area Harvested, Yield, and Production Volume) | ||
| Consumption Analysis (Consumption Value and Volume) | |||
| Import Market Analysis (Import Value, Volume, and Key Supplying Markets) | |||
| Export Market Analysis (Export Value, Volume, and Key Destination Markets) | |||
| Wholesale Price Trend Analysis and Forecast | |||
| Regulatory Framework | |||
| List of Key Players | |||
| Logistics and Infrastructure | |||
| Seasonality Analysis | |||


Key Questions Answered in the Report
How large is Asia-Pacific’s share of the table grape market?
Asia-Pacific accounted for 45% of global value in 2025, anchored by China’s dominant production and rising exports.
Which region is growing fastest in table grapes?
Africa leads with a 5.6% CAGR to 2031, driven by South African exports and Kenya’s irrigation expansion.
Why are proprietary seedless cultivars important?
Varieties such as Autumn Crisp and Cotton Candy earn 20–40% retail premiums and pay breeders USD 0.10–0.25 per kilogram in royalties, boosting margins for licensed growers.
How is cold-chain investment shaping trade flows?
Controlled-atmosphere logistics cut spoilage below 2% on long voyages, enabling South American and South African shippers to reach Asian and Middle Eastern buyers profitably.
Page last updated on:


