Italy Data Center Power Market Size and Share
Market Overview
| Study Period | 2020 - 2031 |
|---|---|
| Forecast Data Period | 2026 - 2031 |
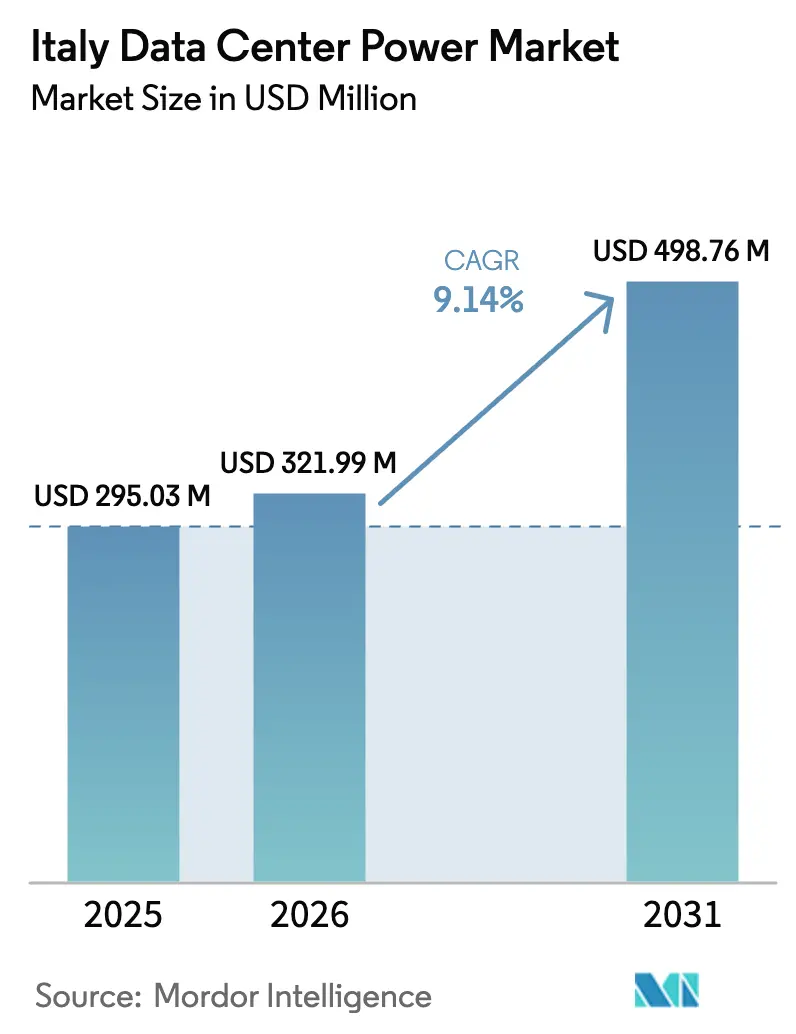
| Base Year Market Size (2025) | USD 295.03 Million |
| Market Size (2026) | USD 321.99 Million |
| Market Size (2031) | USD 498.76 Million |
| Growth Rate (2026 - 2031) | 9.14% CAGR |
| Market Concentration | Medium |
Major Players *Disclaimer: Major Players sorted in no particular order Image © Mordor Intelligence. Reuse requires attribution under CC BY 4.0. | |
Italy Data Center Power Market Analysis by Mordor Intelligence
The Italy data center power market size was valued at USD 295.03 million in 2025 and estimated to grow from USD 321.99 million in 2026 to reach USD 498.76 million by 2031, at a CAGR of 9.14% during the forecast period (2026-2031). The near-double expansion comes from the country’s status as a Mediterranean digital gateway, rising grid investments, and fresh power needs tied to AI and cloud workloads. Large pipeline commitments around Milan, Rome, and emerging southern hubs are reinforcing equipment demand as operators strive for both capacity and energy efficiency. Rapid hyperscale build-outs, state incentives under the National Recovery and Resilience Plan, and steady renewable-energy penetration are further shaping capital allocation across uninterruptible-power supplies, distribution gear, and on-site generation assets. Simultaneously, operators face growing urgency to limit exposure to electricity-price swings, accelerate sustainability metrics, and overcome lengthy grid-connection queues.
Key Report Takeaways
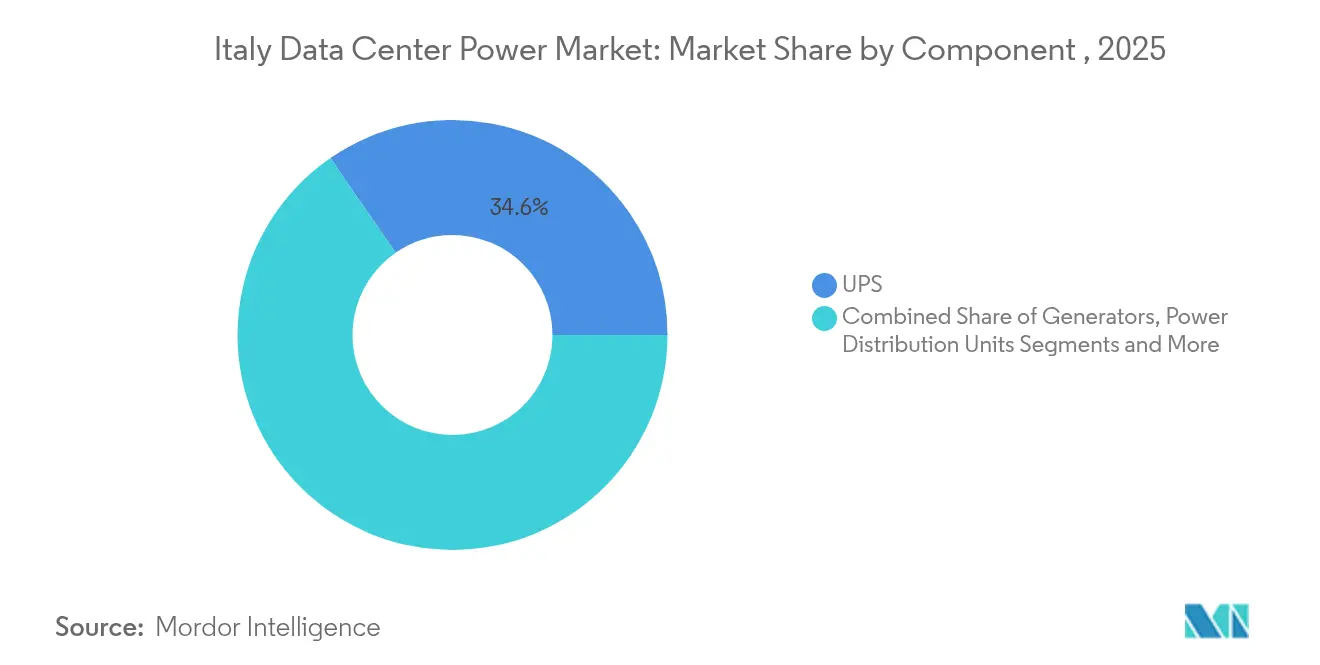
- By component category, UPS systems led with 34.62% of the Italy data center power market share in 2025, while power distribution units are projected to grow at a 12.39% CAGR to 2031.
- By data-center type, colocation providers held 56.28% of the Italy data center power market share in 2025, with hyperscale and cloud service facilities expanding at 14.68% CAGR through 2031.
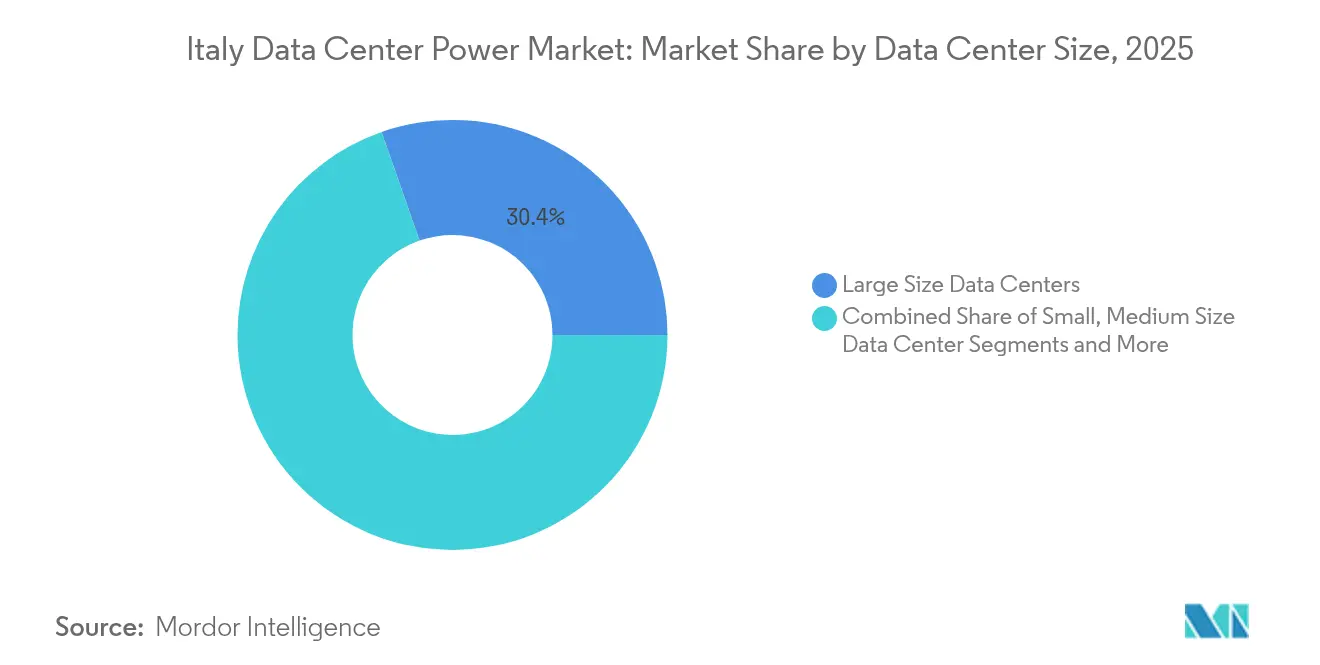
- By size, large facilities accounted for 30.35% of the Italy data center power market size in 2025 and mega installations are forecast to surge at 13.74% CAGR between 2026 and 2031.
- By tier level, Tier III sites captured 51.12% of the Italy data center power market size in 2025, whereas Tier IV builds are advancing at a 13.05% CAGR
Note: Market size and forecast figures in this report are generated using Mordor Intelligence’s proprietary estimation framework, updated with the latest available data and insights as of 2026.
Italy Data Center Power Market Trends and Insights
Drivers Impact Analysis*
| Driver | (~)% Impact on CAGR Forecast | Geographic Relevance | Impact Timeline |
|---|---|---|---|
| Expansion of hyperscale cloud facilities in Milan corridor | +2.1% | Northern Italy, Milan metropolitan area | Medium term (2-4 years) |
| Government NRRP incentives for digital infrastructure | +1.8% | National, with concentration in Milan and Rome | Short term (≤ 2 years) |
| Rising electricity-price volatility spurring UPS efficiency upgrades | +1.4% | National, particularly industrial regions | Short term (≤ 2 years) |
| Renewable micro-grid projects in Southern Italy enabling edge DCs | +1.2% | Southern Italy, Sicily, Sardinia | Long term (≥ 4 years) |
| Feasibility studies for SMR nuclear back-up power | +0.9% | National, with pilot sites in Northern Italy | Long term (≥ 4 years) |
| AI/ML Workloads Driving High-Density Power | +2.4% | National, concentrated in Milan and Rome | Medium term (2-4 years) |
| Source: Mordor Intelligence | |||
Expansion of Hyperscale Cloud Facilities in Milan Corridor
Milan has become Europe’s fourth-largest data-center cluster, attracting more than USD 10 billion in commitments through 2025, including a 70 MW campus by VIRTUS Data Centres and the eight-building Mil02 project by Data4. The clustering effect compresses procurement cycles for power gear, trims unit costs, and fosters vendor specialization. Microsoft pledged EUR 4.3 billion to expand its local cloud region, while AWS set aside EUR 1.2 billion, both specifying redundant UPS rooms and medium-voltage switchgear that can scale in modular blocks. Ready access to Swiss hydro resources also pushes operators toward hybrid architectures that blend grid power with on-site generation for sustainability compliance.
Government NRRP Incentives for Digital Infrastructure
The National Recovery and Resilience Plan sets aside EUR 13.87 billion for digital public services, of which EUR 900 million funds the national cloud hub, creating preferential procurement for power gear with PUE below 1.3.[1]European Commission, “Italy Recovery and Resilience Plan,” ec.europa.euThe Trentino Data Mine illustrates the model, receiving EUR 50 million to convert an active mine into an underground facility delivering 25% energy savings. Operators upgrading to high-efficiency UPS units and lithium-ion storage systems can tap these subsidies, accelerating refresh cycles for aging equipment fleets.
Rising Electricity-Price Volatility Spurring UPS Efficiency Upgrades
Enterprise tariffs rose to EUR 0.356 per kWh in 2024, prompting operators to deploy grid-interactive UPS platforms that trade ancillary services with Terna, Italy’s TSO, to capture balancing revenue. Lithium-ion batteries now command 30% higher discharge efficiency than lead-acid alternatives, allowing facilities to hedge peak-hour costs and lower total power usage. Colocation houses are capitalizing on savings by passing lower bills to tenants, securing higher occupancy in a tight real estate market.
AI and ML Workloads Driving High-Density Power
AI-optimized racks swallow 200–250 kW compared with the historical 8–17 kW envelope. Twenty-two percent of Italian operators have already rolled out liquid or immersion cooling at scale.[2]RCR Wireless News, “Liquid Cooling Adoption Survey,” rcrwireless.comThe surge forces redesigned busway layouts and modular PDUs with granular monitoring. Providers are adopting hybrid cooling where liquid systems target AI clusters and air remains for conventional loads, thereby keeping capex contained while accommodating extreme densities.
Restraint Impact Analysis*
| Restraint | (~)% Impact on CAGR Forecast | Geographic Relevance | Impact Timeline |
|---|---|---|---|
| High CAPEX of redundant power systems | -1.6% | National, particularly affecting Tier IV facilities | Medium term (2-4 years) |
| Grid-connection delays & transmission bottlenecks | -2.1% | National, severe in Southern Italy | Short term (≤ 2 years) |
| Shortage of power-electronics talent for liquid/immersive cooling plants | -0.8% | Northern Italy, Milan and Turin regions | Medium term (2-4 years) |
| Limited domestic manufacturing; long lead-times for switchgear/UPS | -1.1% | National, affecting all facility types | Short term (≤ 2 years) |
| Source: Mordor Intelligence | |||
Grid-Connection Delays & Transmission Bottlenecks
Average connection queues stand at 24–36 months, double that of many European peers, as the legacy grid struggles to absorb 30 GW of data-center requests logged by 2025. Developers resort to temporary diesel gensets or battery containers to meet commissioning dates. Pressure is highest in Sicily and Sardinia where renewable output exceeds transport capacity, highlighting the need for the Tyrrhenian Link and Sa.Co.I.3 upgrades now underway.
High CAPEX of Redundant Power Systems
Tier IV certification demands 2N+1 redundancy, driving investment to EUR 1,500–2,000 per kW of IT load, versus EUR 800–1,200 for Tier III.[3]Uptime Institute, “Tier Certification Overview,” uptimeinstitute.comSmaller operators and edge sites often cannot justify the outlay, slowing adoption. Financing innovations such as power-as-a-service contracts spread cost over operating periods, and distributed UPS topologies are gaining traction to deliver near-Tier IV resiliency at lower capital intensity.
*Our forecasts treat driver/restraint impacts as directional, not additive. The impact forecasts reflect baseline growth, mix effects, and variable interactions.
Segment Analysis
By Component: UPS Systems Lead While PDUs Accelerate
UPS systems captured 34.62% of 2025 revenue, forming the backbone of the Italy data center power market. Spend has concentrated on lithium-ion units, grid-interactive firmware, and modular frames sized from 250 kVA to 4 MVA. Terna’s updated power-quality directives reinforce operator preference for double-conversion architectures paired with active harmonic filters. Remote monitoring features tie into broader DCIM stacks to enable predictive maintenance and load shifting.
Power distribution units are the fastest climber at a 12.39% CAGR supported by AI racks and edge cabinets that need branch-circuit monitoring. Three-phase intelligent PDUs with hot-swappable breaker modules allow quick load rebalancing without downtime, a key win in multi-tenant halls. Generator demand remains robust for medium-speed diesel sets between 2 MW and 5 MW. Operators continue to test hydrogen blends yet maintain diesel dominance amid uncertain fuel-cell economics.


By Data Center Type: Colocation Dominance Amid Hyperscale Acceleration
Colocation sites owned by players such as Equinix and Digital Realty secured 56.28% of 2025 revenue, reflecting deep demand from Italy’s SME landscape that prefers renting over building. Operators bundle power, cooling, and dark-fiber cross-connects to remove upfront hurdles for customers adopting hybrid-cloud strategies. They also lead in ancillary services, offering metered power billing as a differentiator in a price-sensitive market.
The hyperscale segment is expanding at 14.68% CAGR, fueled by cloud giants scaling Italian availability zones. Their preference for slab-to-slab layouts and software-defined power gear accelerates the uptake of bus-plug systems and high-ampacity whips. Enterprise and edge facilities follow in third place but enjoy NRRP grants that subsidize micro edge nodes in municipalities with limited latency budgets. They lean on integrated power-cooling pods shipped pretested from factories, letting local installers meet schedule constraints.
By Data Center Size: Large Facilities Dominate While Mega Installations Surge
Large sites between 10 MW and 50 MW made up 30.35% of 2025 revenues, representing the pragmatic sweet spot for balancing capex, real-estate availability, and utility interconnect limits. Terna’s standard feeder packages are designed around this envelope, simplifying application reviews. These campuses usually host two to six buildings and spread loads across redundant utility transformers plus four-string UPS rooms.
Mega facilities, characterized by draws above 50 MW, exhibit the quickest rise at 13.74% CAGR as developers cluster compute in a few super-nodes for efficiency. They integrate on-site 132 kV substations and medium-voltage ring buses to cut distribution losses. Medium and small facilities cater to regional traffic bursts and disaster-recovery mandates, while massive AI-specific builds above 100 MW remain early but visible in site selection pipelines near Milan and Vicenza.
By Tier Level: Tier III Reliability Preferred With Tier IV Growth
Tier III continues as the de facto design thanks to 99.982% uptime, concurrent maintainability, and manageable cost trade-offs. Operators incorporate N+1 UPS blocks and dual utility feeds. The architecture dovetails with Italian leasing norms, where end clients accept brief maintenance windows if priced competitively.
Tier IV is growing at 13.05% CAGR as cloud and fintech tenants demand 99.995% availability. Projects pursue isolated dual power paths, double generator yards, and at least two geographically separate utility substations. Tier I and Tier II fill budget-conscious or edge roles, especially in academic research clusters and telecom shelters where service-level agreements tolerate shorter recovery times.

Geography Analysis
Italy’s power-hungry digital economy remains highly concentrated in the northern macro-region. The Milan corridor claims roughly 60.00% of fresh megawatt bookings because of carrier density, financial-services demand, and logistical access to Alpine renewable exports. Campus announcements include the eight-building Mil02 site and multiple 20 MW shells pre-leased by interconnection providers. Rome ranks second, riding government cloud mandates and subsea cable landings that position it as a transit hub into North Africa.
Northern Italy benefits from mature hydro resources that shave carbon intensity, giving operators flexibility to publicize green-supply mixes in marketing literature. Turin pursues automotive digitalization, converting redundant factory lots into 10 MW edge facilities. Vicenza and Verona attract AI training clusters from manufacturing groups in search of local GPU capacity. Southern regions, traditionally restrained by grid congestion, are pivoting as renewable micro-grids mature. Sardinia hosts Terna’s grid-support laboratory and leverages the Tyrrhenian Link to export excess solar and wind into mainland loads.
Competitive Landscape
The Italy data center power market shows moderate fragmentation. Global multinationals exploit scale, integrating UPS, switchgear, and monitoring software in bundled bids. Local players counter with agile project management, Italian-language support, and rapid spare-parts delivery.
Strategic activity revolves around two axes. First, software-defined power, where vendors embed AI algorithms for load prediction and dynamic throttling inside UPS controllers and PDU firmware. Second, sustainability, with firms unveiling hydrogen-ready generator lines and lithium-ion battery cabinets featuring fire-suppression chemistries compliant with Italy’s strict civil-protection codes. Cummins broadened its Centum Series and earmarked USD 200 million across global plants to keep pace with quoted lead times under 20 weeks. Hitachi Energy pilots HyFlex hydrogen cells, signaling an eventual diesel displacement for long endurance backup. Meanwhile, energy-as-a-service outfits package generators, batteries, and micro-grid controls under OPEX contracts, relieving customers from upfront capital pressure and de-risking obsolescence.
Italy Data Center Power Industry Leaders
ABB Ltd
Schneider Electric SE
Vertiv Group Corp.
Caterpillar Inc.
Eaton Corporation plc
- *Disclaimer: Major Players sorted in no particular order

Recent Industry Developments
- May 2025: Terna and IPTO signed a EUR 2 billion agreement to reinforce the Italy-Greece electricity link, enhancing Mediterranean grid resilience.
- May 2025: Terna reported Q1 2025 capex of EUR 562.1 million, up 16.4% year on year, prioritizing Tyrrhenian Link and Sa.Co.I.3 transmission corridors.
- March 2025: Terna’s 2025 Development Plan allocated more than EUR 23 billion through 2034 to handle 30 GW of pending data-center connections.
- March 2025: Cummins launched four generator models for Tier III and Tier IV sites and confirmed a USD 200 million manufacturing expansion.


Research Methodology Framework and Report Scope
Market Definitions and Key Coverage
Our study defines the Italy data center power market as all electrical solutions and related services (UPS systems, generators, switchgear, power distribution units, transfer switches, remote power panels, and battery or fuel-cell energy storage) procured to supply, condition, and monitor power inside purpose-built data centers across the country. The sizing is expressed in revenue terms (USD) and tracks spend flowing from owners or operators of colocation, hyperscale, enterprise, and edge facilities.
Scope does not extend to cooling equipment, building electrical wiring outside the data hall, or power consumed by telecom central offices.
Segmentation Overview
- By Component
- Electrical Solutions
- UPS Systems
- Generators
- Diesel Generators
- Gas Generators
- Hydrogen Fuel-cell Generators
- Power Distribution Units
- Switchgear
- Transfer Switches
- Remote Power Panels
- Energy-storage Systems
- Service
- Installation and Commissioning
- Maintenance and Support
- Training and Consulting
- Electrical Solutions
- By Data Center Type
- Hyperscaler/Cloud Service Providers
- Colocation Providers
- Enterprise and Edge Data Center
- By Data Center Size
- Small Size Data Centers
- Medium Size Data Centers
- Large Size Data Centers
- Massive Size Data Centers
- Mega Size Data Centers
- By Tier Level
- Tier I and II
- Tier III
- Tier IV
Detailed Research Methodology and Data Validation
Desk Research
Mordor analysts first assembled a macro picture using open datasets from Terna grid statistics, Eurostat electricity price files, the Italian National Institute of Statistics, and ENEA energy efficiency bulletins. Trade associations such as the Italian Data Center Association and DigitalEurope supplied deployment counts and planned megawatt additions. We complemented these with company filings, investor decks, and news archived in Dow Jones Factiva and D&B Hoovers for spend benchmarks and vendor share shifts. Patent abstracts from Questel and shipment intelligence from Volza offered early signals on emerging battery chemistries and import volumes. The sources cited above are illustrative. Many additional public and subscription datasets were reviewed to cross-check figures and clarify definitions.
Primary Research
Targeted interviews with facility designers, electrical engineers, and procurement heads in Milan, Rome, and Turin helped validate typical cost per installed kilowatt, redundancy preferences, and service attach rates. Short surveys of utility planners and edge-site operators filled data gaps on grid lead times and backup fuel adoption.
Market-Sizing & Forecasting
A top-down construct begins with installed and pipeline IT load (MW) disclosed by operators and Terna, which is multiplied by modeled electrical capex intensity and refreshed ASP curves. Then, sampled vendor roll-ups and channel checks offer a bottom-up sense check. Key variables include rack density migration, average utility tariff, UPS replacement cycle, cloud workload share, and availability tier mix. Five-year forecasts use multivariate regression blended with scenario analysis to capture sensitivities around electricity prices and AI workload penetration, after which values are reconciled with expert consensus before publication.
Data Validation & Update Cycle
Outputs pass through range and variance tests, senior analyst peer review, and re-contact loops when fresh build announcements shift baselines. The model is refreshed each year, with interim updates triggered by deals adding more than 10 MW or policy changes altering incentive schemes.
Why Mordor's Italy Data Center Power Baseline Commands Confidence
Published Italian market sizes differ because firms select dissimilar product scopes, capex to opex treatment, and forecast cadences. When unit density assumptions, currency conversions, and update frequency vary, totals naturally diverge.
Benchmark comparison
| Market Size | Anonymized source | Primary gap driver |
|---|---|---|
| USD 295 million (2025) | Mordor Intelligence | - |
| USD 197 million (2024) | Global Consultancy A | excludes service revenues and values UPS at discounted street prices |
| USD 742 million (2024) | Industry Portal B | bundles cooling and building wiring, inflating scope |
The comparison shows how tighter scope discipline, price level normalization, and an annual refresh let Mordor deliver a balanced, transparent baseline that decision makers can trace back to clearly stated variables and repeatable steps.


Key Questions Answered in the Report
How large is the Italy data center power market in 2026 and how fast is it growing?
The Italy data center power market stands at USD 321.99 million in 2026 and is on track to expand at 9.14% CAGR, reaching USD 498.76 million by 2031.
Which component holds the largest Italy data center power market share?
UPS systems lead, accounting for 34.62% of 2025 revenue, driven by grid-stability requirements and efficiency upgrades.
How are rising electricity prices influencing power-equipment choices?
Price volatility pushes operators toward grid-interactive UPS platforms with lithium-ion batteries that improve efficiency and enable revenue from ancillary services.
Where are the fastest emerging geographic clusters outside Milan?
Rome, Sardinia, Sicily, and Turin are gaining traction due to subsea cable landings, renewable micro-grids, and industrial digitization projects.
What is the outlook for Tier IV facilities in Italy?
Tier IV builds are forecast to rise at 13.05% CAGR as mission-critical workloads demand full fault tolerance and operators adopt modular redundancy designs.
Page last updated on:


