
Market Overview
| Study Period | 2020 - 2032 |
|---|---|
| Forecast Data Period | 2026 - 2032 |
| Base Year Market Size (2025) | USD 15.58 Billion |
| Market Size (2026) | USD 17.01 Billion |
| Market Size (2032) | USD 28.76 Billion |
| Growth Rate (2026 - 2032) | 9.14 % |
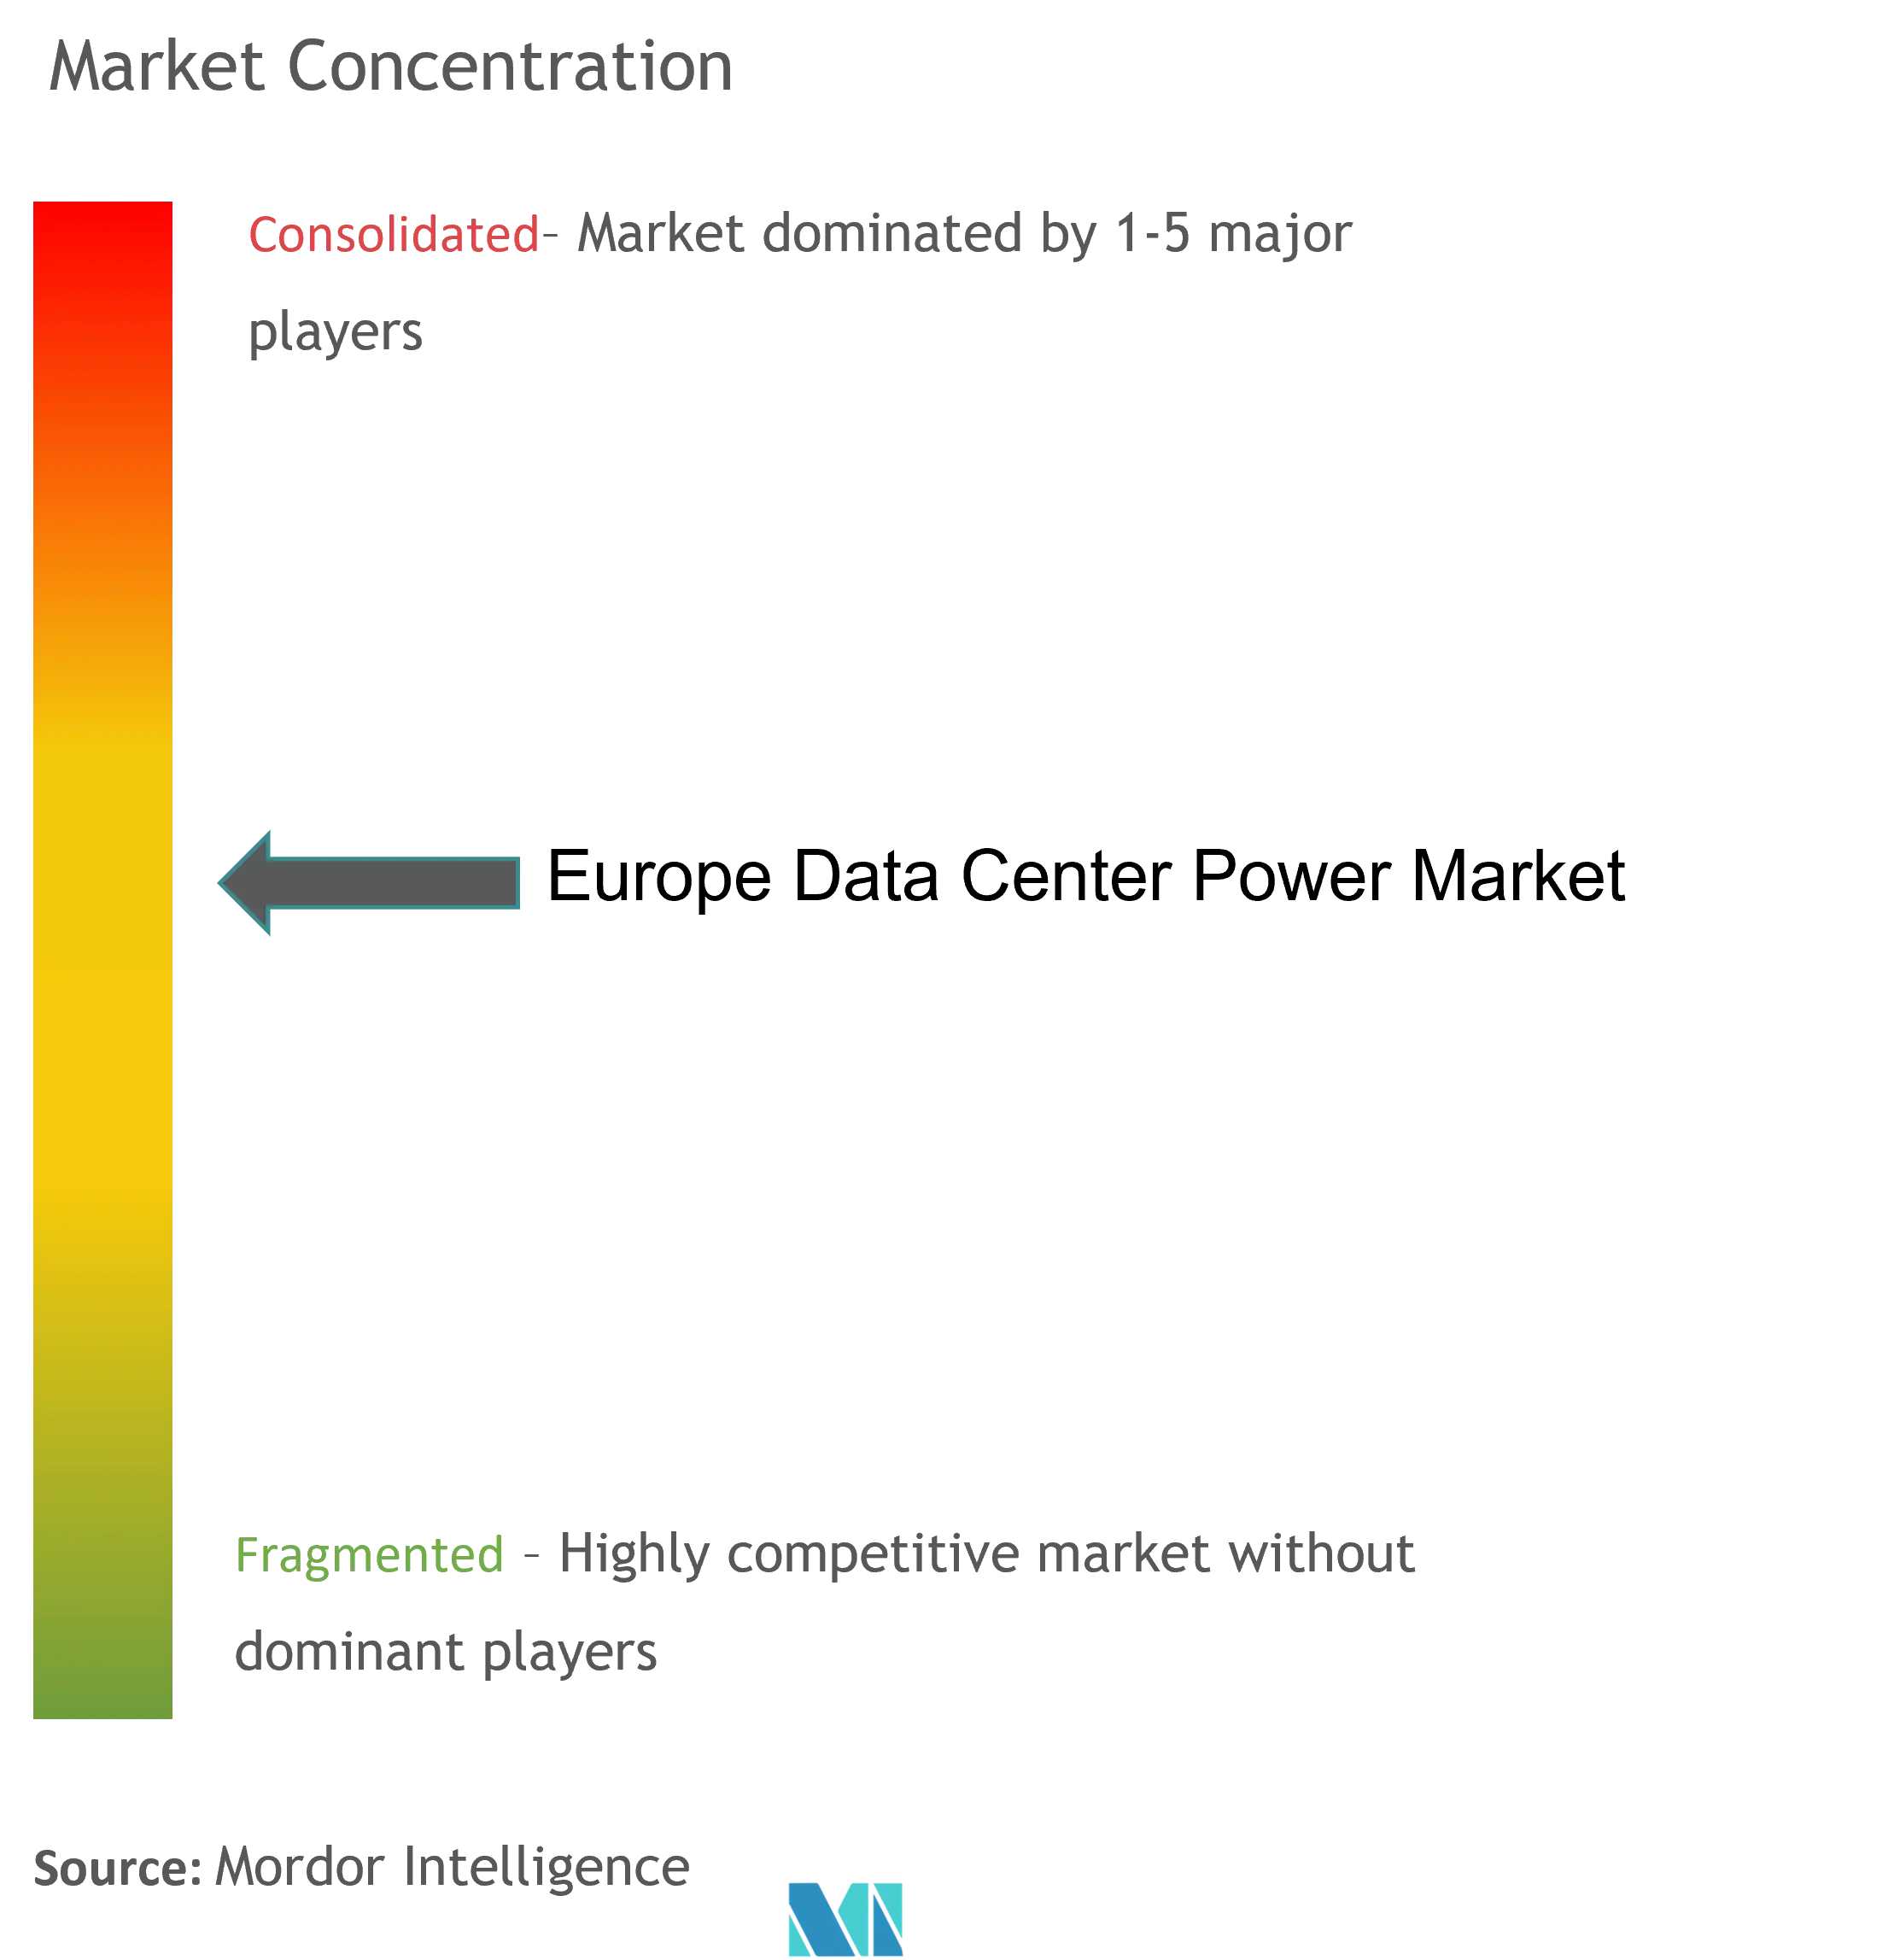
| Market Concentration | Medium |
Major Players *Disclaimer: Major Players sorted in no particular order Image © Mordor Intelligence. Reuse requires attribution under CC BY 4.0. | |
Europe Data Center Power Market Analysis by Mordor Intelligence
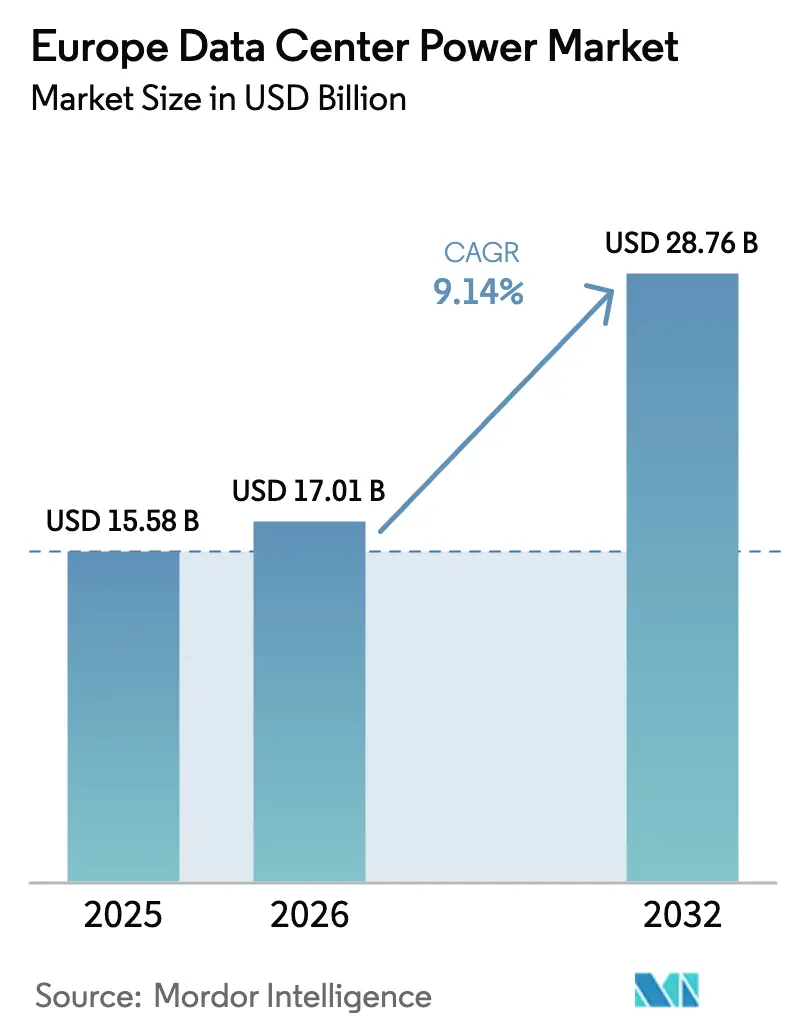
The Europe data center power market size is expected to grow from USD 15.58 billion in 2025 to USD 17.01 billion in 2026 and is forecast to reach USD 28.76 billion by 2032 at 9.14% CAGR over 2026-2032. Rapid AI adoption, hyperscale build-outs that now demand gigawatt-scale feeds, and mandatory energy-efficiency rules such as Germany’s 1.2 PUE cap are collectively reshaping investment priorities across the region. Operators are moving from 5-10 kW racks to liquid-cooled deployments that exceed 100 kW per rack, forcing wholesale upgrades in switchgear, transformers, and backup architectures. Simultaneously, grid bottlenecks in Frankfurt, London, and Amsterdam have triggered a flight to power-rich secondary locations and a surge in premium pricing, with London colocation rates climbing to USD 180-215 per kW each month. Competitive intensity is growing around hydrogen fuel cells and on-site power plants, both of which help operators bypass grid queues while meeting Scope 1 and Scope 2 decarbonization targets. Together these forces underpin the robust trajectory of the Europe data center power market through the end of the decade.
Key Report Takeaways
- By solution type, power distribution solutions captured 73.35% of the Europe data center power market share in 2025.
- By data center type, colocation facilities led with 47.40% revenue share in 2025, while the edge/micro DC segment is advancing at a 9.74% CAGR through 2032.
- By end-user industry, IT and telecom accounted for 37.55% share of the Europe data center power market size in 2025, and healthcare and life sciences is projected to grow at 9.42% CAGR to 2032.
- By power capacity, facilities greater than 3 MW held 42.30% share of the Europe data center power market size in 2025; the 1.1-3 MW band is forecast to post the fastest 9.66% CAGR through 2032.
- By tier standard, Tier III facilities commanded 61.25% of the Europe data center power market share in 2025, whereas Tier IV is the fastest-growing tier at 10.12% CAGR to 2032.
Note: Market size and forecast figures in this report are generated using Mordor Intelligence’s proprietary estimation framework, updated with the latest available data and insights as of 2026.
600+
data center reports by Mordor Intelligence
covering AI facilities, construction, hyperscale sites and more - global, regional or country-level, right down to individual data center components
Europe Data Center Power Market Trends and Insights
Drivers Impact Analysis*
| DRIVER | (~) % IMPACT ON CAGR FORECAST | GEOGRAPHIC RELEVANCE | IMPACT TIMELINE |
|---|---|---|---|
| Rising adoption of hyperscale and mega data centers | +2.1% | Germany, France, Netherlands, Ireland | Medium term (2-4 years) |
| Surge in cloud computing and OTT traffic | +1.8% | FLAP-D corridors | Short term (≤ 2 years) |
| Stringent PUE / energy-efficiency mandates | +1.5% | Germany, Netherlands, France | Long term (≥ 4 years) |
| Utility-scale renewable PPAs stabilizing power costs | +1.2% | Nordics, Spain, Ireland | Medium term (2-4 years) |
| Edge-AI micro DC rollout in rural and secondary cities | +0.9% | Spain, Italy, Poland | Long term (≥ 4 years) |
| On-prem green-hydrogen fuel cells for grid-constrained DCs | +0.7% | Netherlands, Germany, UK | Long term (≥ 4 years) |
| Source: Mordor Intelligence | |||
Rising adoption of hyperscale and mega data centers
Hyperscale operators are building campuses that resemble small utility districts, routinely contracting for 300-500 MW utility connections and, in some cases, developing on-site combined-cycle plants to assure supply continuity. Microsoft’s EUR 4.3 billion Italian expansion and Amazon’s multi-gigawatt footprint across Europe demonstrate how direct-to-utility models are displacing traditional colocation leasing. Average rack power density is poised to reach 500-1,000 kW for AI training clusters by 2027, driving a 20-30% uptick in facility-wide power draw because liquid cooling loops add pumping penalties.[2]ServeTheHome Editors, “Vertiv Hydrogen Fuel Cell Quick Look,” servethehome.com Siemens Energy reported that 60% of its 14 GW gas turbine backlog in 2024 was earmarked for data centers, underscoring the unprecedented infrastructure scale.[1]Capacity Media Staff, “Siemens Energy’s data-centre boom,” capacitymedia.com Utilities are racing to reinforce transmission corridors, yet localized grid stress persists, prompting regulators in Germany to fast-track critical infrastructure permits while the Netherlands enforces moratoriums in power-scarce municipalities.
Surge in cloud computing and OTT traffic
European data centers drew 45-65 TWh in 2022 and are on track to triple consumption by 2035 as 4K/8K streaming, generative AI, and augmented-reality services proliferate. OTT spikes during marquee sporting events oblige operators to install UPS lines that can instantaneously assume full load without flicker. To curtail latency, hyperscalers are standing up edge nodes across Spain, Italy, and Eastern Europe; each micro facility requires 500 kW-3 MW modular power blocks with precise voltage regulation. EU telecom directives enforce 99.9% uptime for networked media platforms, accelerating the refresh of legacy rotary UPS units with lithium-ion or sodium-ion designs that support rapid discharge cycles.
Stringent PUE / energy-efficiency mandates
Germany’s Energy Efficiency Act will prohibit data centers above 1.2 PUE beginning 2027, compelling operators to integrate dynamic cooling, waste-heat recovery, and AI-assisted load balancing that collectively add 15-20% to upfront capex. The Netherlands couples PUE targets with carbon-intensity ceilings, effectively obliging operators to document renewable provenance for every megawatt consumed. Demonstrations such as DataHub Switzerland’s 1.25 PUE liquid-cooled site—built at a EUR 2.5 million premium—signal the commercial payoff: tenants tolerate higher rents in exchange for guaranteed compliance and lower long-run utility bills.
Utility-scale renewable PPAs stabilizing power costs
Ten- to fifteen-year renewable PPAs now underpin most new hyperscale builds, locking power costs as low as EUR 0.03 per kWh in the Nordics while shaving Scope 2 emissions to near-zero.[3]Bulk Infrastructure, “Maximizing HPC investment through data center colocation,” bulkinfrastructure.com Operators in Spain are co-locating solar arrays with data halls, avoiding transmission charges and grid approval delays. Multi-source power orchestration platforms coordinate solar, wind, hydro, battery, and, increasingly, hydrogen-fuel-cell inputs to maintain frequency stability and reserve margins, underscoring the rising software component of the Europe data center power market.
Restraints Impact Analysis*
| RESTRAINTS | (~) % IMPACT ON CAGR FORECAST | GEOGRAPHIC RELEVANCE | IMPACT TIMELINE |
|---|---|---|---|
| High upfront CAPEX for power and cooling retrofits | -1.4% | Germany, UK, Netherlands | Short term (≤ 2 years) |
| Grid-capacity bottlenecks in Tier-1 metros | -1.1% | Frankfurt, London, Amsterdam, Paris | Medium term (2-4 years) |
| Shortage of certified high-voltage technicians | -0.8% | Germany, Netherlands, UK | Long term (≥ 4 years) |
| Water-based cooling’s hidden power-penalty scrutiny | -0.6% | Southern Europe | Medium term (2-4 years) |
| Source: Mordor Intelligence | |||
High upfront CAPEX for power and cooling retrofits
Transitioning legacy halls to 100 kW racks often costs USD 1,000 per kW, as switchboards, busways, and distribution cabling must all be replaced. Inflation lifted European construction inputs by 23% between 2023-2024, and electrical gear alone now represents 25% of build budgets. Transformers and high-speed breakers carry 12-18-month lead times, delaying revenue recognition and straining cash flow for mid-tier providers.
Grid-capacity bottlenecks in Tier-1 metros
Frankfurt faces power-connection queues that stretch beyond 2030; London’s West-Drayton zone is likewise oversubscribed despite National Grid’s multibillion-pound reinforcement plan. Amsterdam imposed a moratorium on hyperscale sites in Noord-Holland until 2026, diverting growth to Eindhoven and Brussels. These limits inflate land and power premiums and drive a patchwork of secondary clusters whose fiber density often lags demand, challenging network engineers.
*Our forecasts treat driver/restraint impacts as directional, not additive. The impact forecasts reflect baseline growth, mix effects, and variable interactions.
Segment Analysis
By Type: Power Distribution Dominates Infrastructure Modernization
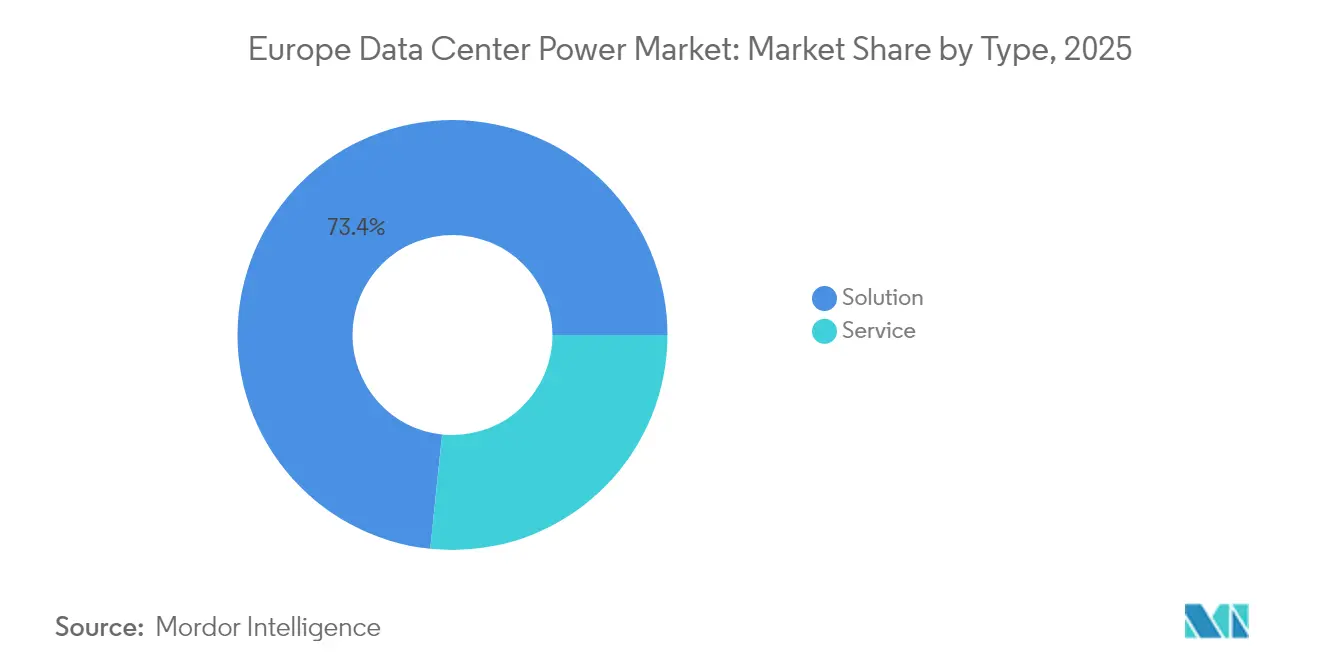
Power distribution systems generated 73.35% of the Europe data center power market size in 2025 as operators accelerated switchgear and busway upgrades to accommodate AI-class densities. Within this segment, intelligent switchboards that toggle between utility, battery, and fuel-cell sources in <5 milliseconds are now standard. UPS adoption remains strong within the 26.65% backup category, but diesel gensets are losing share to hydrogen stacks and large-format battery banks that fulfill emerging zero-emission mandates. Schneider Electric’s lithium-ion Galaxy VL and Vertiv’s trinium fuel-cell UPS are emblematic of the pivot toward cleaner, denser backup.
Design and consulting services are the fastest-growing sub-segment, rising at a 9.97% CAGR as clients demand holistic electrical-plus-mechanical designs tuned for mixed CPU/GPU loads. Integration contractors report project backlogs stretching to 2027, encouraging standardization around modular 2-4 MW blocks that can be factory-tested before shipment. This shift reduces on-site labor while enabling better quality control, a vital consideration given Europe’s technician shortfall.



By Data Center Type: Colocation Leads Amid Enterprise Outsourcing Trends
Colocation retained 47.40% revenue share of the Europe data center power market in 2025 because enterprises prefer renting AI-ready space versus funding complex electrical overhauls. Multi-tenant facilities amortize compliance costs—such as Germany’s PUE <1.2 rule—across broader customer bases, creating a price-performance edge. Edge and micro facilities, although smaller, are scaling fastest at 9.74% CAGR thanks to 5G, autonomous mobility, and smart-manufacturing deployments that cannot tolerate >20-millisecond latency.
Hyperscale self-builds remain pivotal; Microsoft’s Irish campus and NTT’s Frankfurt expansion exemplify direct utility partnership models that attach dual 400 kV feeds and on-site turbines. These investments insulate operators from congested public grids while enabling experimentation with hydrogen, battery, and flywheel hybrids. The competitive gap between colocation specialists and do-it-yourself hyperscalers is narrowing as both adopt prefabricated power cores and advanced monitoring suites.
By End-User Industry: IT and Telecom Drives AI Infrastructure Demand
IT and telecom entities consumed 37.55% of the Europe data center power market size in 2025, reflecting simultaneous roles as network backbone and AI platform provider. GPU clusters for language models now pull 30 kW-60 kW per rack continuously, compelling telecom carriers to double electrical capacity in many legacy central offices. BFSI follows closely, demanding Tier IV dual-fed architectures to satisfy algorithmic trading latency and regulatory redundancy.
Healthcare and life sciences is expanding fastest at 9.42% CAGR as genomics and drug-discovery workloads require weeks-long compute runs with zero interruption. Pharmaceutical giants routinely reserve 10+ MW power blocks for protein-folding simulations. Government and defense, manufacturing, media, and retail each bring distinct load profiles—ranging from bursty rendering farms to always-on fraud-analytics engines—driving customization in distribution topology and UPS chemistry.
By Power Capacity: Large-Scale Facilities Dominate Market Value
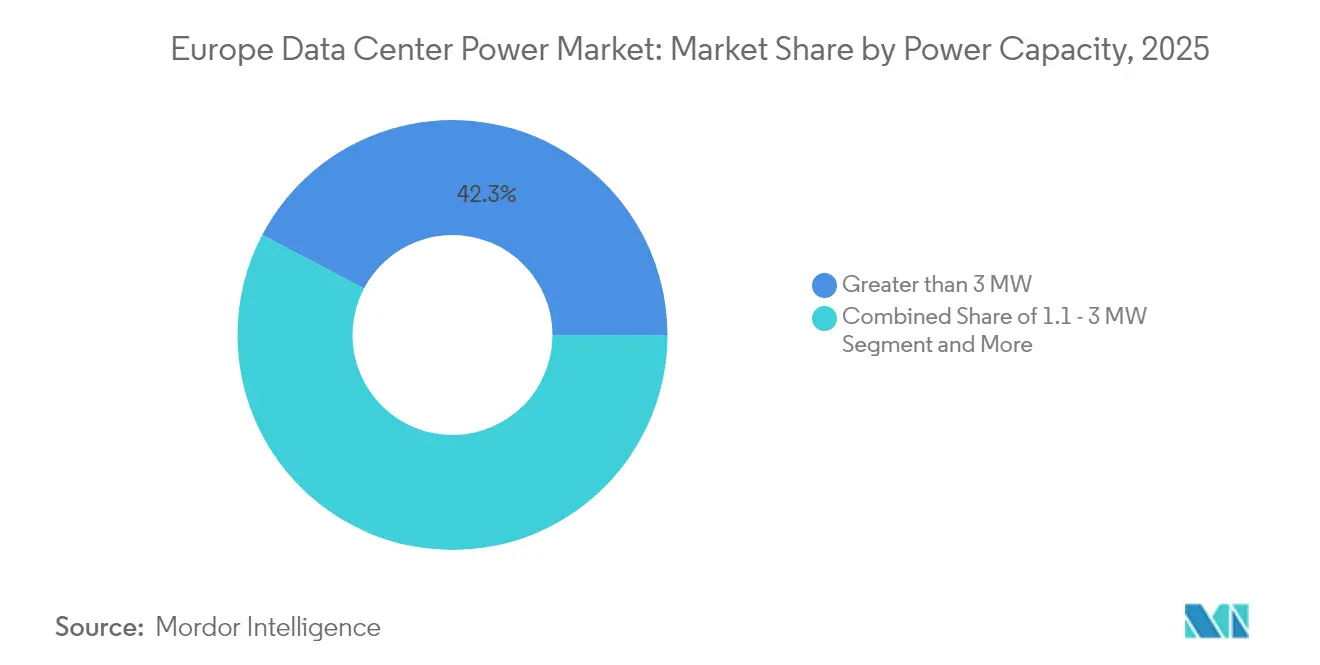
Sites above 3 MW held 42.30% of Europe data center power market share in 2025, underscoring the gravitational pull of hyperscale economics. Operators here deploy 20-40 MW blocks per building, often backed by 150 MVA substations and 220 kV transmission taps. Yet the 1.1-3 MW tier is projected to grow 9.66% CAGR, buoyed by regional and vertical-specific builds that align with renewable micro-grid footprints. Standardized 2 MW hydrogen-battery hybrid modules can now be trucked in and interconnected within 15 months, versus 30-plus months for brownfield expansions.
Facilities ≤500 kW remain niche but indispensable for edge and disaster-recovery use cases. In power-constrained metros, operators sometimes stitch multiple micro sites into virtual clusters, orchestrated by software-defined power controllers that distribute load based on tariff and carbon-intensity signals.
By Tier Standard: Tier III Balances Reliability and Cost Efficiency
Tier III sites accounted for 61.25% of market revenue in 2025, offering N+1 redundancy that satisfies most enterprise SLAs without doubling hardware outlays. However, Tier IV is growing fastest at 10.12% CAGR because financial, healthcare, and sovereign cloud mandates increasingly require fault-tolerant 2N topologies. Tier IV certification now encompasses proof of concurrent maintainability plus renewable sourcing declarations, blending reliability with sustainability compliance. Tier I/II footprints continue to shrink, relegated to dev-test, archive, and less critical workloads that tolerate occasional downtime.
Geography Analysis
Germany anchors the Europe data center power market, aided by a 62.7% renewable mix in 2024 and a regulatory fast track that classifies data centers as critical infrastructure. Frankfurt’s landlord-controlled power reservations exceed 1 GW, yet extended queue times push newer development toward Saarland and Lower Saxony. Operators typically negotiate dual utility feeds plus on-site cogeneration, enabling PUEs below 1.25 even at 30 °C ambient temperature. Compliance with the 1.2 PUE cap is accelerating retrofits of variable-speed chillers and solid-state transformers.
The United Kingdom combines strong demand with acute grid scarcity. London Docklands power tariffs climb to USD 215 per kW monthly, prompting data center operators to expand northward into Scotland and North-East England where renewable penetration is high and land cheaper. QTS’s 1.1 GW Northumberland campus embodies this pivot, leveraging proximity to offshore wind corridors. Post-Brexit data sovereignty laws funnel sensitive workloads into domestic facilities, reinforcing growth despite higher build costs.
France occupies the third slot, leveraging a nuclear-heavy grid that yields stable, low-carbon electricity. Paris and Marseille clusters enjoy ample fiber capacity and submarine cable landings, making them attractive for AI training and content delivery. Data4’s plan for a 1 GW AI campus south of Paris underlines confidence in the country’s power outlook. Environmental regulations compel heat-re-use schemes; several Parisian operators now feed district-heating loops that warm 20,000+ apartments each winter.
The Netherlands grapples with a decade-long moratorium in Noord-Holland due to grid saturation. Developers are pivoting to Eindhoven and Groningen while lobbying for interim capacity auctions. Dutch rules also impose carbon-intensity ceilings, nudging designs toward 24/7 matched renewables and smart-grid participation that can curtail load within 15 seconds during national peaks. Although growth slows near Amsterdam IX, the market remains strategically vital thanks to Europe’s densest internet exchange.
Regulatory Landscape
The EU Energy Efficiency Directive recast (Directive (EU) 2023/1791) brings large data centers into a harmonized energy-performance disclosure regime. Data centers with installed IT power demand of at least 500 kW must report KPIs including PUE, WUE, renewable energy use, and waste-heat reuse into a European database through national schemes, with annual submissions due by 15 May starting in 2025.
At the member-state level, mandatory efficiency caps are tightening design and procurement choices for power distribution and backup systems. Germanys Energy Efficiency Act introduces a 1.2 PUE limit for data centers from 2027, reinforcing demand for high-efficiency electrical architectures, monitoring and controls, and heat-reuse integration alongside broader EU sustainability reporting changes referenced in Directive (EU) 2026/470 (24 February 2026).
Value Chain Analysis
The value chain spans upstream electrical and power-electronics inputs (switchgear, transformers, busway, cabling, UPS, batteries, generators, and emerging fuel cells), engineering and integration (EPCs and specialist electrical contractors), and downstream data center operators (colocation, hyperscale, and edge/micro) that increasingly procure modular power blocks and software for orchestration and compliance reporting. Within solutions, power distribution remains the largest spend area (73.35% share in 2025), reflecting the need to rework MV/LV distribution, protection, and monitoring to support AI-class rack densities.
Grid access and energization have become gating nodes in the chain, shifting value toward utilities and connection assets (substations, HV transformers) and toward behind-the-meter generation and renewable PPAs that secure deliverable capacity. This is visible in projects such as Virtus Data Centres installation of two 185 MVA transformers at its Wustermark campus to connect to Germanys 380 kV network (July 2026) and in the pipeline of large campuses moving to power-available regions (for example, Pure Data Centres Groups 550 MW AI campus announcement in Seinajoki, Finland, July 2026). These dynamics elevate the role of OEM lead times, certified HV labor availability, and factory-tested modularization in system integration and commissioning schedules.
Competitive Landscape
The Europe data center power market exhibits moderate consolidation. Schneider Electric leads with a 36.7% revenue slice across switchgear, UPS, and DCIM suites, leveraging vertically integrated portfolios that simplify procurement for hyperscalers. ABB, Siemens, Vertiv, and Eaton round out the top tier, each exceeding 10% regional share. Their dominance stems from factory-certified global lead-times, broad service networks, and in-house R&D pipelines that support next-gen thermal and electrical platforms.
Disruptive activity centers on hydrogen fuel cells and high-density busways. ECL’s off-grid hydrogen data center blueprint and Microsoft’s Irish fuel-cell trial illustrate the encroachment of energy specialists into a domain once dominated by diesel-genset OEMs. Collaborations such as Eaton-Siemens Energy’s gigawatt-class onsite plants underscore the strategic move toward private power utilities. Start-ups focusing on 60 kW-plus rack power distribution units and AI-assisted breaker panels are attracting venture capital, aiming to supply edge container rows where space and maintenance windows are minimal.
Vendor competition increasingly hinges on software. Predictive maintenance algorithms that pre-empt breaker tripping and battery degradation now differentiate offerings. Schneider’s EcoStruxure, Vertiv’s Environet, and ABB’s Ability™ Energy Manager feed real-time telemetry into cloud dashboards, enabling operators to arbitrate workloads based on carbon signal, cost, and electrical headroom. Given the complexity of Europe’s regulatory mosaic, end-to-end compliance reporting has evolved into a pivotal selling point.
Europe Data Center Power Industry Leaders
Schneider Electric SE
ABB Ltd.
Legrand SA
Eaton Corporation
Vertiv Group
- *Disclaimer: Major Players sorted in no particular order

Market Opportunities and Future Outlook
Regulatory reporting and transparency requirements under the Energy Efficiency Directive recast create a clear product and services whitespace around measurement, verification, and audit-ready reporting for sites at or above 500 kW IT load (annual submissions due by 15 May). This supports demand for DCIM/energy-management software, advanced metering down to branch-circuit level, and integrated controls that can document PUE, WUE, renewable provenance, and waste-heat reuse, particularly for Tier III and fast-growing Tier IV facilities where uptime and compliance are jointly procured.
Power-availability constraints in core hubs are accelerating investment in alternatives that shorten time-to-power and improve grid compatibility, which in turn opens opportunities for medium-voltage distribution expansions, high-capacity transformers, and hybrid backup architectures that reduce reliance on diesel. EU policy signals also point to a larger buildout cycle: the European Commissions Cloud and AI Development Act (published June 2026) frames a program to scale EU data center capacity and links expansion to permitting and energy obligations, while industry bodies (for example, ENTSO-E) have elevated data centers as a planning case for grid connections and flexibility. In parallel, large campus announcements in power-rich geographies, such as Pure Data Centres Groups 550 MW Finland campus (July 2026), underline the addressable market for standardized 1.1 to 3 MW modular power blocks, renewable PPA structuring, and on-site solutions that support high-density AI deployments without waiting for congested metro connections.
Recent Industry Developments
- April 2026: Legrand announced the acquisition of TES, a United Kingdom-based data center power distribution specialist, as part of a two-acquisition transaction. It strengthens Legrands critical power and distribution portfolio used in data halls and electrical rooms, adding domain capability that complements its existing data center infrastructure lines.
- October 2025: ABB partnered with NVIDIA to develop power solutions for next-generation AI data centers, including work around higher-voltage DC architectures for large-scale deployments. The collaboration aligns electrical distribution and protection roadmaps with AI infrastructure requirements, reinforcing vendor differentiation as rack densities and site power blocks scale up.
- December 2024: Start Campus opened the 26 MW SIN01 data center facility in Sines, Portugal, built with Schneider Electric EcoStruxure technology. The site added a visible reference for integrated power and monitoring stacks in a Southern Europe location that is attracting new builds as grid constraints tighten in established FLAP-D hubs.


Research Methodology Framework and Report Scope
Market Definition and Coverage
This market is sized as the revenue generated from supplying, installing, and servicing electrical power infrastructure used inside data centers across Europe. It covers the systems that condition, distribute, and back up power from the grid entry point to IT loads.
Scope exclusions: We exclude the value of land and building construction, IT hardware, and pure network equipment unless it is sold as part of a power-infrastructure package.
Segmentation Overview
- By Type
- By Solution
- Power Distribution Solutions
- Power Backup Solutions
- By Service
- Design and Consulting
- System Integration
- Support and Maintenance
- By Solution
- By Data Center Type
- Colocation Facilities
- Enterprise / Edge / Micro DC
- Hyperscale / Self-built Facilities
- By End-User Industry
- BFSI
- IT and Telecom
- Government and Defense
- Manufacturing and Industrial
- Media and Entertainment
- Healthcare and Life Sciences
- Retail and E-commerce
- By Power Capacity
- less than equal to 500 kW
- 501 kW – 1 MW
- 1.1 – 3 MW
- greater than 3 MW
- By Tier Standard
- Tier I and II
- Tier III
- Tier IV
- By Geography
- Germany
- United Kingdom
- France
- Netherlands
- Ireland
- Spain
- Italy
- Nordic (Denmark, Sweden, Norway, Finland)
- Poland
Data Sources, Market Sizing, and Validation
Desk Research
Desk work starts with building a fact base on how fast European data center capacity is expanding and what power reliability requirements look like by country. We typically refer to public sources such as Eurostat, ENTSO-E, national grid operators and energy regulators, the International Energy Agency, and EU policy publications that track electricity demand and efficiency signals.
To translate that context into market inputs, we also review company annual reports, investor presentations, product catalogs, and reputable press coverage on new data center builds, power upgrades, and grid connection constraints. Where needed, our internal paid subscriptions for company financials, news, and patents help confirm supplier exposure and technology shifts, for example battery backup, fuel cells, and power management features. This desk source list is illustrative only, and many other references are used to collect, validate, and clarify the final assumptions.
Primary Interviews and Surveys
Primary discussions are used to pressure-test what the desk research suggests, especially around typical electrical bill of materials, replacement cycles, and project lead times across major European data center hubs. We speak with a mix of equipment suppliers, engineering and integration teams, operators, and large buyers, so gaps in pricing and adoption can be closed before finalizing the model.
Distribution of primary research fieldwork respondents
| Company type | Respondent position |
|---|---|
| Top tier: 26% | CXOs: 12% |
| Mid tier: 58% | Functional/Unit leaders: 29% |
| Smaller Players: 16% | Managers: 59% |
Market-Sizing & Forecasting
Sizing begins with a top-down reconstruction of the demand pool using Europe-specific build and expansion signals, then translating that into power infrastructure spending tied to installed and planned capacity. The core checks include new data center project counts, IT load additions in MW, typical redundancy targets (N+1 or 2N), and how equipment mix shifts with higher rack densities.
Once the demand pool is set, we corroborate totals with selective bottom-up approximations, such as sampling project bills of materials, applying realistic ASP ranges for UPS, PDUs, busway, switchgear, and transformers, and then validating service attach rates for consulting, integration, and maintenance. If a country or sub-region has limited disclosure, gaps are handled by using proxy markets with similar build patterns and grid constraints, followed by interview-based adjustment.
For forecasting, scenario analysis is used so we can reflect different pathways for grid connection timelines, electricity price sensitivity, and adoption of alternative backup architectures, including large-format batteries, hydrogen-ready systems, and fuel-cell pilots. The scenario weights are aligned to what industry experts expect for the next few years, and the resulting CAGR profile is checked against announced capacity pipelines and procurement cycles.
Data Validation & Update Cycle
Outputs are cross-checked against independent signals like announced capacity additions, capex intensity per MW, and the implied component mix by country. When values look off, assumptions are revisited, outliers are traced back to a specific input such as price, mix, or timing, and expert follow-ups are triggered so we do not carry forward a weak number.
Before sign-off, the model goes through a multi-step review where a second analyst checks formulas, unit consistency, and the logic behind each key assumption. The report is refreshed annually, and interim updates are made when major events change the outlook, such as large policy moves on energy efficiency or sudden shifts in data center build pipelines. Right before delivery, a final pass is done so clients receive the most current view available.
Mordor Intelligence's Europe Data Center Power Market Estimate Compared With Other Published Estimates
Published market sizes for Europe data center power often vary because analysts do not always count the same equipment and service boundaries, and they may also use different timing for projects that are announced but not yet commissioned. Differences also come from whether the market is treated as spending on electrical infrastructure only, or as a wider power ecosystem that includes more adjacent items.
The main gap comes from whether the estimate is limited to electrical infrastructure investment items or expanded to include a wider set of power solutions and related services. In that scope, Mordor Intelligence counts consulting, system integration, professional services, and support and maintenance alongside equipment like UPS, PDU, busway, switchgear, transformers, and newer backup architectures when they are procured for data center use.
Benchmark comparison
| Source | Market Size | Gaps in Research Methodology |
|---|---|---|
| Mordor Intelligence | USD 15.58 B (2025) | |
| Industry Publisher A | USD 4.21 B (2023) | Uses an investment-focused framing with a narrower electrical infrastructure basket, and the base year is earlier, which reduces the captured value versus a broader equipment plus services view. |
| Industry Publisher B | USD 3.03 B (2025) | Keeps scope tighter around selected solutions and services categories, and it may apply more conservative ASP and attach-rate assumptions for services across countries. |
Looking across the figures, most of the spread is explained by what is counted and when it is counted, rather than by a disagreement that Europe is expanding data center capacity. By anchoring the model to capacity additions, redundancy needs, and realistic equipment and service mixes, the final number stays traceable to clear inputs that can be rechecked as new projects and pricing signals emerge.


Key Questions Answered in the Report
What is the projected value of the Europe data center power market by 2032?
The market is forecast to reach USD 28.76 billion by 2032.
Which solution type commands the largest revenue share?
Power distribution equipment holds 73.35% of regional revenue in 2025.
How fast is the edge/micro data-center segment growing?
It is expanding at an annual 9.74% pace through 2032.
Why are hydrogen fuel cells gaining popularity?
They provide zero-emission, grid-independent power that helps operators bypass diesel bans and capacity queues.
Which country leads in renewable energy-backed data center power?
Germany leads, sourcing 62.7% of its electricity from renewables in 2024.
What tier standard dominates new European builds?
Tier III remains prevalent, supplying 61.25% of 2025 revenue thanks to its uptime-versus-cost balance.
Page last updated on:
More reports on data centers
- Artificial Intelligence (AI) Data Center Market Global AI facilities demand, split by facility type, component and tier.
- Data Center Construction Market Construction worldwide, split by tier, facility size and facility type.
- South America Data Center Construction Market Construction in South America, split by tier.
- China Data Center Construction Market China's construction, split by facility size and tier.
- Europe Hyperscale Data Center Market Europe hyperscale sites, split by facility type, component and tier.
- Data Center Infrastructure Management (DCIM) Market DCIM software across all regions, split by component, tier and facility size.





