Italy Data Center Market Size and Share
Market Overview
| Study Period | 2020 - 2031 |
|---|---|
| Forecast Data Period | 2026 - 2031 |
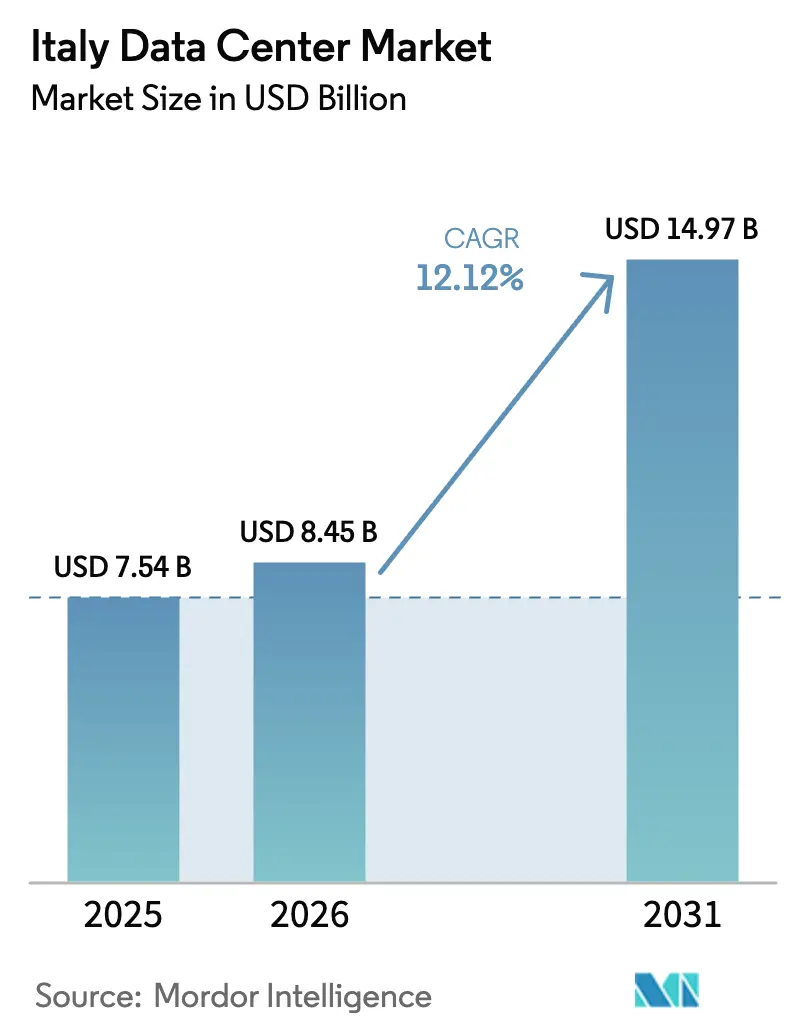
| Base Year Market Size (2025) | USD 7.54 Billion |
| Market Size (2026) | USD 8.45 Billion |
| Market Size (2031) | USD 14.97 Billion |
| Growth Rate (2026 - 2031) | 12.12% CAGR |
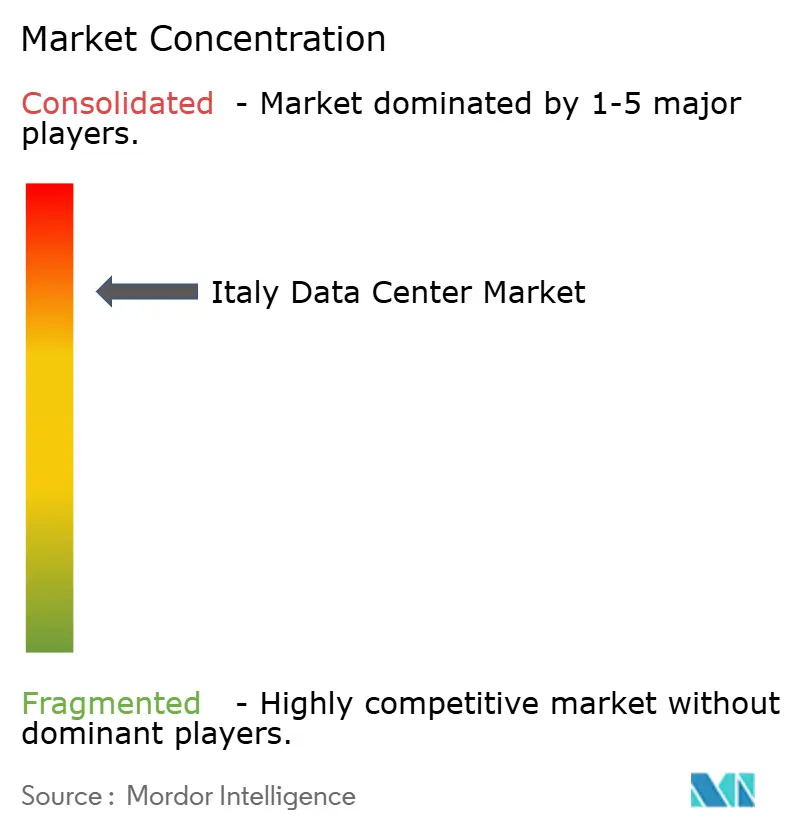
| Market Concentration | High |
Major Players*Disclaimer: Major Players sorted in no particular order Image © Mordor Intelligence. Reuse requires attribution under CC BY 4.0. | |
Italy Data Center Market Analysis by Mordor Intelligence
The Italy Data Center market size is expected to grow from USD 7.54 billion in 2025 to USD 8.45 billion in 2026 and is forecast to reach USD 14.97 billion by 2031 at 12.12% CAGR over 2026-2031. In terms of IT load capacity, the market is expected to grow from 1.08 thousand megawatt in 2025 to 4.09 thousand megawatt by 2030, at a CAGR of 30.49% during the forecast period (2025-2030). The market segment shares and estimates are calculated and reported in terms of MW. Hyperscale cloud expansion, aggressive public sector digitalization programs, and rising AI-driven computing needs fuel demand. Milan’s proximity to trans-European fiber routes, improvements in power procurement, and a growing pipeline of submarine cables keep the country attractive for high-density builds. International investors also favor Italy because land and power are still easier to secure than in Frankfurt, London, Amsterdam, Paris and Dublin. Heightened merger activity suggests the market could enter a consolidation phase as scale economies become decisive.
Key Report Takeaways
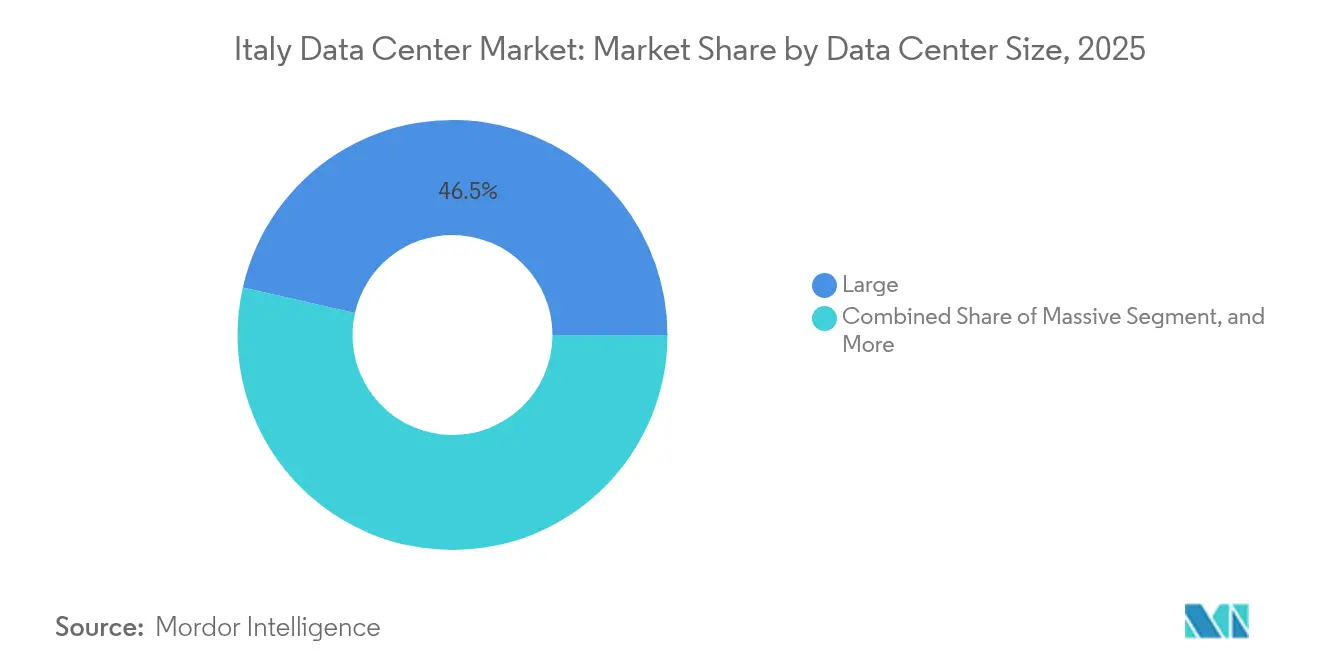
- By data center size, large facilities led with 46.45% revenue share in 2025, while massive sites are poised for a 29.10% CAGR through 2031.
- By tier, Tier 4 facilities accounted for 55.05% of the Italy data center market share in 2025 and are projected to expand at a 30.20% CAGR to 2031.
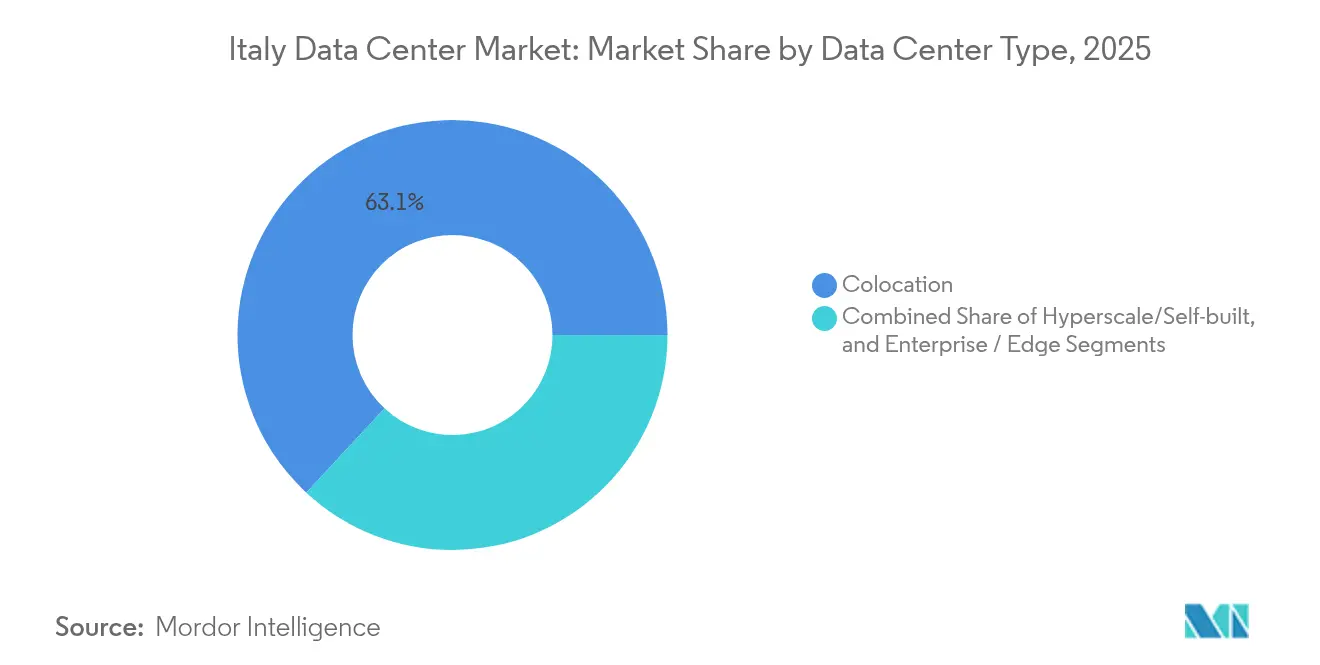
- By facility type, colocation captured 63.10% of the Italy data center market size in 2025, whereas hyperscale self-builds will register the fastest 34.10% CAGR to 2031.
- By end user, IT and telecom controlled 55.10% revenue in 2025; BFSI is expected to grow at a 29.92% CAGR through 2031.
- By hotspot, Milan controlled 54.05% revenue in 2025, while the Rest of Italy segment is projected to rise at a 26.40% CAGR to 2031.
Note: Market size and forecast figures in this report are generated using Mordor Intelligence’s proprietary estimation framework, updated with the latest available data and insights as of 2026.
Italy Data Center Market Trends and Insights
Drivers Impact Analysis*
| Driver | (~) % Impact on CAGR Forecast | Geographic Relevance | Impact Timeline |
|---|---|---|---|
| Accelerated hyperscaler cloud expansion | +8.5% | Milan and Lombardy | Medium term (2-4 years) |
| Public sector cloud migration under PNRR | +6.2% | Nationwide | Medium term (2-4 years) |
| AI-driven high-density compute demand | +7.8% | Milan, Turin, Rome | Short term (≤ 2 years) |
| Strategic submarine and terrestrial connectivity upgrades | +4.3% | Coastal regions, Sicily, Genoa | Long term (≥ 4 years) |
| District heating waste-heat recovery adoption | +2.1% | Northern Italy | Long term (≥ 4 years) |
| Brownfield and underground site repurposing | +1.6% | Industrial zones | Medium term (2-4 years) |
| Source: Mordor Intelligence | |||
Accelerated Hyperscaler Cloud Expansion
Italy is now a top-tier destination for global cloud providers that need capacity relief from congested Northern European hubs. Microsoft earmarked EUR 4.3 billion (USD 4.6 billion) for new Lombardy facilities that will bring multiple availability zones online by 2027. Google Cloud opened twin regions in Milan and Turin, spanning six buildings to meet local data-residency requirements. [1]power2Cloud, “Two new Google Cloud Regions in Italy, in Milan and Turin,” power2cloud.com Amazon Web Services is evaluating former Enel power-plant sites such as Montalto di Castro to condense permitting timelines and leverage existing transmission links. The influx of foreign capital lifts construction standards, accelerates adoption of liquid cooling, and pushes bulk-power engagement with Terna, the national grid operator.
Public Sector Cloud Migration Under PNRR
Italy’s EUR 191.5 billion Recovery and Resilience Plan accelerated nationwide digital transformation. The National Strategic Hub (Polo Strategico Nazionale) awarded contracts worth EUR 520 million in 2024, representing a 73% year-over-year increase, to migrate ministerial workloads to sovereign clouds. The initiative obliges data to remain on domestic soil, favoring Tier 4 sites with quantum-safe encryption and 99.995% uptime. TIM committed EUR 130 million (USD 141 million) for a 25 MW facility near Rome, scheduled for completion in late 2026, specifically designed for GPU clusters. As municipalities seek compliance, demand is emerging for smaller edge nodes across public hospitals and schools.
AI-Driven High-Density Compute Demand
Italy hosts Europe’s third-largest supercomputer, Leonardo, at CINECA in Bologna. GPU-rich clusters for generative AI now require 40-50 kW per rack, a fivefold jump over legacy deployments. NTT DATA’s 128 MW Milan project and Equinix’s EUR 15 billion global joint venture both earmark Italian capacity specifically for AI training workloads. Liquid-immersion and direct-to-chip cooling are advancing from pilot to production, while operators negotiate long-duration power purchase agreements for renewable energy to stabilize operating costs.
Strategic Submarine and Terrestrial Connectivity Upgrades
Four new cable systems, Blue-Raman, BlueMed, Medusa, and Unitirreno, are landing before 2027, adding more than 1 Pbps of design capacity. Blue-Raman bypasses Egypt’s bottleneck by routing through Israel, Jordan, and Saudi Arabia, lowering latency by up to 30 milliseconds on Asia-Europe paths. Genoa and Sicily serve as open landing stations, giving Milan operators diverse backhaul and improved resilience. Terrestrial expansions such as RETELIT’s Avalon campus create dense interconnection fabrics that enable hyperscalers to deploy multi-region architectures within the Italy data center market.
Restraints Impact Analysis*
| Restraints | (~) % Impact on CAGR Forecast | Geographic Relevance | Impact Timeline |
|---|---|---|---|
| High electricity costs and grid constraints | -4.2% | Nationwide, South | Short term (≤ 2 years) |
| Regulatory uncertainty and permitting delays | -3.8% | Nationwide | Medium term (2-4 years) |
| Water availability and cooling restrictions | -2.1% | Southern regions | Medium term (2-4 years) |
| Limited domestic capital for large-scale builds | -1.4% | Nationwide | Long term (≥ 4 years) |
| Source: Mordor Intelligence | |||
High Electricity Costs and Grid Constraints
Italian wholesale power averaged EUR 133/MWh (USD 144/MWh) in 2024, 30% higher than France and 40% above Spain, eroding operating margins. Terna received 42 GW of connection requests by March 2025, dwarfing current generation reserves and exposing capacity shortfalls. Renewable approvals are sluggish: regions cleared only 1% of solar applications filed in 2022. [2]ANSA, “Italy’s regions approved just 1% of solar power projects in 2022,” ansa.it For the Italy data center market, operators must therefore sign multi-year renewable PPAs, invest in on-site batteries, and phase construction to match sub-station upgrades.
Regulatory Uncertainty and Permitting Delays
Italy lacks a formal legal definition for data centers. Municipalities adapt industrial zoning rules, causing permit times to vary from one year in Lombardy to five years in Rome. Draft national guidelines are in Parliament, but may not clear the backlog of cases until 2026. Foreign investors often hire local engineering firms to navigate heritage protections and environmental studies, which can add 5%-7% to build costs. Despite recent incentives, such as the 2024 Renewable Sources Act, which halves approval times in acceleration zones, unpredictability still deters mid-sized entrants and slows greenfield megaprojects. [3]DLA Piper, “What’s New in the Renewable Sources Act,” dlapiper.com
*Our forecasts treat driver/restraint impacts as directional, not additive. The impact forecasts reflect baseline growth, mix effects, and variable interactions.
Segment Analysis
By Data Center Size: Scale Economics Reshape Deployment Choices
The large-facility tier led the Italy data center market with 46.45% revenue in 2025. Operators such as Digital Realty and Aruba use these sites to cluster wholesale colocation suites and multi-tenant cloud nodes. Meanwhile, massive campuses above 60 MW are set to post a 29.10% CAGR through 2031 as hyperscale clouds migrate AI training workloads in-house. The resulting construction swing is visible around Milan’s eastern ring road, where three projects totaling 350 MW broke ground in 2025. Utility-scale footprints justify private 150 kV grid connections and on-site substations that mitigate volatile transmission tariffs. Small facilities decline steadily because edge use cases can be served from modular annexes attached to factories or telecom central offices.
Acceleration toward larger footprints compresses the total cost of ownership. Spreading power infrastructure over more racks lowers capex per kW by up to 25% and improves PUE through centralized heat-recovery loops that feed district heating in towns like Bergamo. At the same time, local municipalities favor consolidated zoning to minimize land-use conflicts. The momentum toward massive campuses, therefore, reinforces long-term land banking strategies, especially in Lombardy and Piedmont, where motorway access and dark fiber routes already exist. Within this context, the Italy data center market size for massive projects is positioned to expand almost fourfold over five years, eclipsing medium-tier deployments in new-build capex.


By Tier Type: Reliability Premium Drives Tier 4 Acceleration
Tier 4 facilities held 55.05% of 2025 revenue and are forecast for a 30.20% CAGR, reflecting enterprise appetite for concurrent-maintainable infrastructure. Financial institutions, telecom operators, and public-sector entities all specify 2N+1 architectures with dual 132 kV feeds, diesel day-tanks sized for 72 hours, and fully fault-tolerant cooling loops. Tier 3 sites, though cheaper by 15% in build cost, remain relegated to disaster-recovery roles or third-party hosting of non-critical workloads. Tier 1–2 installations fill niche edge scenarios such as local content caches or factory data dumps.
Regulatory reforms anticipated for 2026 may codify uptime requirements for public cloud providers serving government contracts, effectively mandating Tier 4 certification. This prospect further tilts investment toward the highest tier and is expected to push the Italy data center market share of Tier 4 to approximately 60% by 2027. Demand elasticity is low because most mission-critical applications cannot tolerate more than five minutes of annual downtime. Accordingly, vendors focusing on Tier 4 builds gain pricing power, while Tier 3 operators need to add revenue streams such as managed security services to stay competitive.
By Data Center Type: Hyperscale In-House Builds Challenge Colocation Dominance
Colocation captured 63.10% of the Italy data center market size in 2025, anchored by carrier-neutral hubs where more than 165 networks and clouds exchange traffic. Retail colocation still wins over midmarket customers who prefer OpEx over CapEx. However, self-built hyperscale facilities exhibit the steepest 34.10% CAGR, as Microsoft, Google, and AWS pursue full control over power density, security, and custom silicon deployment. Wholesale colocation serves as an interim model; several operators pre-lease entire data halls of 6 MW each to clouds that later exercise purchase options once regional demand becomes more established.
The pivot to hyperscale self-builds alters supply-chain dynamics. Contractors must commit to multiple 100 MW phases, correlated with GPU rollouts and liquid cooling retrofits. Meanwhile, colocation incumbents double down on differentiated interconnection fabrics and multi-cloud gateways to retain enterprise clients. Looking ahead, hybrid campus designs, where a wholesale provider co-locates with a hyperscale anchor, are expected to emerge as the dominant form factor in the Italy data center market by 2028, balancing control with ecosystem depth.
By End User: BFSI Outpaces Traditional Tech Verticals
IT and telecom users remain the backbone, accounting for 55.10% of 2025 demand, while BFSI workloads are scaling faster at a 29.92% CAGR. Italian banking groups are deploying private clouds to comply with European Banking Authority guidelines on data sovereignty, while also experimenting with real-time payments and AI-based fraud detection that require sub-2 ms latency. Insurers run catastrophe-risk models that require petaflop-scale computing and thus gravitate toward GPU-ready halls. Government demand is propelled by the PNRR mandate to shift 75% of public workloads to certified domestic clouds by 2026. Manufacturing and automotive firms in Emilia-Romagna are adopting micro-modular units near their factories for Industry 4.0, but they still archive data in Milan or Turin for analytics.
Cross-vertical synergies emerge as BFSI and e-commerce players increasingly co-locate on the same campuses to shorten trading round-trip times and facilitate cart-checkout validation. This convergence drives higher cabinet densities, prompting facility owners to equip every new hall with liquid-cooling manifolds. The Italy data center market continues to diversify its end-user base, insulating operators from cyclical downturns in any single vertical.
Geography Analysis
Northern Italy remains the epicenter for large-scale server farms. Lombardy alone hosts more than 70% of live hyperscale capacity because it provides dual 220 kV grid connections, proximity to Switzerland’s hydro assets and streamlined one-year permit cycles. In 2025, multiple foreign operators secured greenfield plots near Lodi and Melegnano, seeking low seismic risk and quick motorway access. Authorities encourage these clusters by earmarking acceleration zones where grid reinforcements and fiber cross-connects receive priority funding. Consequently, the Italy data center market keeps gravitating to the north for first-wave megaprojects.
Central regions, anchored by Rome and Bologna, are catching up. The Lazio government recently simplified heritage-site consultations for data center builds, trimming approval time by four months. TIM’s 25 MW project in Pomezia targets sovereign-cloud contracts, while Digital Realty’s 35.2 MW plan stresses open-meet-me rooms to lure content providers transiting the Tyrrhenian corridor. The presence of CINECA’s Leonardo supercomputer in Bologna attracts AI research and high-performance computing tenants who require nearby colocation for data staging. While grid congestion persists, new high-voltage lines from Terna are scheduled for commissioning in 2028, unlocking additional headroom.
Southern Italy and the islands move from fringe to opportunity. Sicily’s role as a submarine-cable gateway supports content caching and gaming services for North Africa and the Middle East. Real estate prices run 40% below Milan, and solar irradiance allows operators to blend on-site photovoltaic farms with battery storage, mitigating grid costs. Brindisi’s decommissioned coal plant is under study for conversion into a 180 MW campus. Although local enterprise demand is modest, the national move toward distributed edge nodes and data-sovereignty obligations attracts interest. Over the next five years, secondary metros are expected to claim a larger slice of the Italy data center market, balancing national load distribution and reducing latency for underserved communities.
Competitive Landscape
Competition sits at a medium level of concentration. Five top operators control just under 60% of active MW, corresponding to a market concentration score of 6. Domestic carrier TIM integrates Noovle cloud services with Sparkle’s international backbones, offering a vertically unified proposition from edge node to trans-oceanic route. Digital Realty extends its global footprint with a Milan regional hub and a Rome greenfield site pending power interconnection. VIRTUS Data Centres, backed by ST Telemedia, broke ground on a 70 MW campus due for first phase completion in 2027, leveraging its London operational playbook to target wholesale tenants.
Strategic maneuvers revolve around capital intensity and regulatory positioning. TIM sold a 70% stake in Sparkle to the Italian government, de-leveraging its balance sheet while maintaining operational control of subsea cables critical for cloud interconnectivity. Swisscom acquired Vodafone Italy for EUR 8 billion (USD 8.7 billion), creating a second national telecom champion with integrated mobile, fixed and data center assets. Foreign hyperscalers sign build-operate-transfer agreements to lock in power allocations without owning land outright, mitigating political risk. Technology differentiation intensifies as players pilot two-phase immersion cooling, hydrogen fuel cells and waste-heat reuse partnerships with district-heating firms in Emilia-Romagna.
Ecosystem effects drive partnership strategies. Colocation providers emphasize carrier neutrality, establishing meet-me rooms with up to 400 cross-connects per tenant. Hyperscalers meanwhile court renewable-energy developers to secure hourly matched solar and wind contracts, essential for satisfying upcoming European carbon-disclosure regulations. Edge specialists partner with telecom operators to host micro-datacenters inside 5G towers across Piedmont and Veneto, lowering front-haul latency for autonomous-vehicle testbeds. The competitive dynamics thus depend on both economies of scale and the ability to orchestrate vertically integrated value chains within the Italy data center market.
Italy Data Center Industry Leaders
Aruba SpA
Equinix, Inc.
Irideos SpA
Vantage Data Centers LLC
Data4 Group S.A.S.
- *Disclaimer: Major Players sorted in no particular order

Recent Industry Developments
- March 2025: Italy selected for USD 32.6 billion data center project by a single consortium, with power connection requests reaching 42 GW by end-March 2025.
- February 2025: Italian government secured 70% strategic stake in Sparkle, TIM’s subsea cable arm operating 600,000 km of fiber.
- January 2025: VIRTUS Data Centres announced a 70 MW Milan campus breaking ground in Q2 2025.
- December 2024: Legislative Decree 190 streamlined renewable permitting, halving approval timelines in acceleration zones.


Italy Data Center Market Report Scope
Greater Milan are covered as segments by Hotspot. Large, Massive, Medium, Mega, Small are covered as segments by Data Center Size. Tier 1 and 2, Tier 3, Tier 4 are covered as segments by Tier Type. Non-Utilized, Utilized are covered as segments by Absorption.| Large |
| Massive |
| Medium |
| Mega |
| Small |
| Tier 1 and 2 |
| Tier 3 |
| Tier 4 |
| Hyperscale / Self-built | ||
| Enterprise / Edge | ||
| Colocation | Non-Utilized | |
| Utilized | Retail Colocation | |
| Wholesale Colocation | ||
| BFSI |
| IT and ITES |
| E-Commerce |
| Government |
| Manufacturing |
| Media and Entertainment |
| Telecom |
| Other End Users |
| Milan |
| Genova |
| Rest of Italy |
| By Data Center Size | Large | ||
| Massive | |||
| Medium | |||
| Mega | |||
| Small | |||
| By Tier Type | Tier 1 and 2 | ||
| Tier 3 | |||
| Tier 4 | |||
| By Data Center Type | Hyperscale / Self-built | ||
| Enterprise / Edge | |||
| Colocation | Non-Utilized | ||
| Utilized | Retail Colocation | ||
| Wholesale Colocation | |||
| By End User | BFSI | ||
| IT and ITES | |||
| E-Commerce | |||
| Government | |||
| Manufacturing | |||
| Media and Entertainment | |||
| Telecom | |||
| Other End Users | |||
| By Hotspot | Milan | ||
| Genova | |||
| Rest of Italy | |||


Market Definition
- IT LOAD CAPACITY - The IT load capacity or installed capacity, refers to the amount of energy consumed by servers and network equipments placed in a rack installed. It is measured in megawatt (MW).
- ABSORPTION RATE - It denotes the extend to which the data center capacity has been leased out. For instance, a 100 MW DC has leased out 75 MW, then absorption rate would be 75%. It is also referred as utilization rate and leased-out capacity.
- RAISED FLOOR SPACE - It is an elevated space build over the floor. This gap between the original floor and the elevated floor is used to accommodate wiring, cooling, and other data center equipment. This arrangement assist in having proper wiring and cooling infrastructure. It is measured in square feet (ft^2).
- DATA CENTER SIZE - Data Center Size is segmented based on the raised floor space allocated to the data center facilities. Mega DC - # of Racks must be more than 9000 or RFS (raised floor space) must be more than 225001 Sq. ft; Massive DC - # of Racks must be in between 9000 and 3001 or RFS must be in between 225000 Sq. ft and 75001 Sq. ft; Large DC - # of Racks must be in between 3000 and 801 or RFS must be in between 75000 Sq. ft and 20001 Sq. ft; Medium DC # of Racks must be in between 800 and 201 or RFS must be in between 20000 Sq. ft and 5001 Sq. ft; Small DC - # of Racks must be less than 200 or RFS must be less than 5000 Sq. ft.
- TIER TYPE - According to Uptime Institute the data centers are classified into four tiers based on the proficiencies of redundant equipment of the data center infrastructure. In this segment the data center are segmented as Tier 1,Tier 2, Tier 3 and Tier 4.
- COLOCATION TYPE - The segment is segregated into 3 categories namely Retail, Wholesale and Hyperscale Colocation service. The categorization is done based on the amount of IT load leased out to potential customers. Retail colocation service has leased capacity less than 250 kW; Wholesale colocation services has leased capacity between 251 kW and 4 MW and Hyperscale colocation services has leased capacity more than 4 MW.
- END CONSUMERS - The Data Center Market operates on a B2B basis. BFSI, Government, Cloud Operators, Media and Entertainment, E-Commerce, Telecom and Manufacturing are the major end-consumers in the market studied. The scope only includes colocation service operators catering to the increasing digitalization of the end-user industries.
| Keyword | Definition |
|---|---|
| Rack Unit | Generally referred as U or RU, it is the unit of measurement for the server unit housed in the racks in the data center. 1U is equal to 1.75 inches. |
| Rack Density | It defines the amount of power consumed by the equipment and server housed in a rack. It is measured in kilowatt (kW). This factor plays a critical role in data center design and, cooling and power planning. |
| IT Load Capacity | The IT load capacity or installed capacity, refers to the amount of energy consumed by servers and network equipment placed in a rack installed. It is measured in megawatt (MW). |
| Absorption Rate | It denotes how much of the data center capacity has been leased out. For instance, if a 100 MW DC has leased out 75 MW, then the absorption rate would be 75%. It is also referred to as utilization rate and leased-out capacity. |
| Raised Floor Space | It is an elevated space built over the floor. This gap between the original floor and the elevated floor is used to accommodate wiring, cooling, and other data center equipment. This arrangement assists in having proper wiring and cooling infrastructure. It is measured in square feet/meter. |
| Computer Room Air Conditioner (CRAC) | It is a device used to monitor and maintain the temperature, air circulation, and humidity inside the server room in the data center. |
| Aisle | It is the open space between the rows of racks. This open space is critical for maintaining the optimal temperature (20-25 °C) in the server room. There are primarily two aisles inside the server room, a hot aisle and a cold aisle. |
| Cold Aisle | It is the aisle wherein the front of the rack faces the aisle. Here, chilled air is directed into the aisle so that it can enter the front of the racks and maintain the temperature. |
| Hot Aisle | It is the aisle where the back of the racks faces the aisle. Here, the heat dissipated from the equipment’s in the rack is directed to the outlet vent of the CRAC. |
| Critical Load | It includes the servers and other computer equipment whose uptime is critical for data center operation. |
| Power Usage Effectiveness (PUE) | It is a metric which defines the efficiency of a data center. It is calculated by: (𝑇𝑜𝑡𝑎𝑙 𝐷𝑎𝑡𝑎 𝐶𝑒𝑛𝑡𝑒𝑟 𝐸𝑛𝑒𝑟𝑔𝑦 𝐶𝑜𝑛𝑠𝑢𝑚𝑝𝑡𝑖𝑜𝑛)/(𝑇𝑜𝑡𝑎𝑙 𝐼𝑇 𝐸𝑞𝑢𝑖𝑝𝑚𝑒𝑛𝑡 𝐸𝑛𝑒𝑟𝑔𝑦 𝐶𝑜𝑛𝑠𝑢𝑚𝑝𝑡𝑖𝑜𝑛). Further, a data center with a PUE of 1.2-1.5 is considered highly efficient, whereas, a data center with a PUE >2 is considered highly inefficient. |
| Redundancy | It is defined as a system design wherein additional component (UPS, generators, CRAC) is added so that in case of power outage, equipment failure, the IT equipment should not be affected. |
| Uninterruptible Power Supply (UPS) | It is a device that is connected in series with the utility power supply, storing energy in batteries such that the supply from UPS is continuous to IT equipment even during utility power is snapped. The UPS primarily supports the IT equipment only. |
| Generators | Just like UPS, generators are placed in the data center to ensure an uninterrupted power supply, avoiding downtime. Data center facilities have diesel generators and commonly, 48-hour diesel is stored in the facility to prevent disruption. |
| N | It denotes the tools and equipment required for a data center to function at full load. Only "N" indicates that there is no backup to the equipment in the event of any failure. |
| N+1 | Referred to as 'Need plus one', it denotes the additional equipment setup available to avoid downtime in case of failure. A data center is considered N+1 when there is one additional unit for every 4 components. For instance, if a data center has 4 UPS systems, then for to achieve N+1, an additional UPS system would be required. |
| 2N | It refers to fully redundant design wherein two independent power distribution system is deployed. Therefore, in the event of a complete failure of one distribution system, the other system will still supply power to the data center. |
| In-Row Cooling | It is the cooling design system installed between racks in a row where it draws warm air from the hot aisle and supplies cool air to the cold aisle, thereby maintaining the temperature. |
| Tier 1 | Tier classification determines the preparedness of a data center facility to sustain data center operation. A data center is classified as Tier 1 data center when it has a non-redundant (N) power component (UPS, generators), cooling components, and power distribution system (from utility power grids). The Tier 1 data center has an uptime of 99.67% and an annual downtime of <28.8 hours. |
| Tier 2 | A data center is classified as Tier 2 data center when it has a redundant power and cooling components (N+1) and a single non-redundant distribution system. Redundant components include extra generators, UPS, chillers, heat rejection equipment, and fuel tanks. The Tier 2 data center has an uptime of 99.74% and an annual downtime of <22 hours. |
| Tier 3 | A data center having redundant power and cooling components and multiple power distribution systems is referred to as a Tier 3 data center. The facility is resistant to planned (facility maintenance) and unplanned (power outage, cooling failure) disruption. The Tier 3 data center has an uptime of 99.98% and an annual downtime of <1.6 hours. |
| Tier 4 | It is the most tolerant type of data center. A Tier 4 data center has multiple, independent redundant power and cooling components and multiple power distribution paths. All IT equipment are dual powered, making them fault tolerant in case of any disruption, thereby ensuring interrupted operation. The Tier 4 data center has an uptime of 99.74% and an annual downtime of <26.3 minutes. |
| Small Data Center | Data center that has floor space area of ≤ 5,000 Sq. ft or the number of racks that can be installed is ≤ 200 is classified as a small data center. |
| Medium Data Center | Data center which has floor space area between 5,001-20,000 Sq. ft, or the number of racks that can be installed is between 201-800, is classified as a medium data center. |
| Large Data Center | Data center which has floor space area between 20,001-75,000 Sq. ft, or the number of racks that can be installed is between 801-3,000, is classified as a large data center. |
| Massive Data Center | Data center which has floor space area between 75,001-225,000 Sq. ft, or the number of racks that can be installed is between 3001-9,000, is classified as a massive data center. |
| Mega Data Center | Data center that has a floor space area of ≥ 225,001 Sq. ft or the number of racks that can be installed is ≥ 9001 is classified as a mega data center. |
| Retail Colocation | It refers to those customers who have a capacity requirement of 250 kW or less. These services are majorly opted by small and medium enterprises (SMEs). |
| Wholesale Colocation | It refers to those customers who have a capacity requirement between 250 kW to 4 MW. These services are majorly opted by medium to large enterprises. |
| Hyperscale Colocation | It refers to those customers who have a capacity requirement greater than 4 MW. The hyperscale demand primarily originates from large-scale cloud players, IT companies, BFSI, and OTT players (like Netflix, Hulu, and HBO+). |
| Mobile Data Speed | It is the mobile internet speed a user experiences via their smartphones. This speed is primarily dependent on the carrier technology being used in the smartphone. The carrier technologies available in the market are 2G, 3G, 4G, and 5G, where 2G provides the slowest speed while 5G is the fastest. |
| Fiber Connectivity Network | It is a network of optical fiber cables deployed across the country, connecting rural and urban regions with high-speed internet connection. It is measured in kilometer (km). |
| Data Traffic per Smartphone | It is a measure of average data consumption by a smartphone user in a month. It is measured in gigabyte (GB). |
| Broadband Data Speed | It is the internet speed that is supplied over the fixed cable connection. Commonly, copper cable and optic fiber cable are used in both residential and commercial use. Here, optic cable fiber provides faster internet speed than copper cable. |
| Submarine Cable | A submarine cable is a fiber optic cable laid down at two or more landing points. Through this cable, communication and internet connectivity between countries across the globe is established. These cables can transmit 100-200 terabits per second (Tbps) from one point to another. |
| Carbon Footprint | It is the measure of carbon dioxide generated during the regular operation of a data center. Since, coal, and oil & gas are the primary source of power generation, consumption of this power contributes to carbon emissions. Data center operators are incorporating renewable energy sources to curb the carbon footprint emerging in their facilities. |


Research Methodology
Mordor Intelligence follows a four-step methodology in all our reports.
- Step-1: Identify Key Variables: In order to build a robust forecasting methodology, the variables and factors identified in Step-1 are tested against available historical market numbers. Through an iterative process, the variables required for market forecast are set and the model is built on the basis of these variables.
- Step-2: Build a Market Model: Market-size estimations for the forecast years are in nominal terms. Inflation is not a part of the pricing, and the average selling price (ASP) is kept constant throughout the forecast period for each country.
- Step-3: Validate and Finalize: In this important step, all market numbers, variables and analyst calls are validated through an extensive network of primary research experts from the market studied. The respondents are selected across levels and functions to generate a holistic picture of the market studied.
- Step-4: Research Outputs: Syndicated Reports, Custom Consulting Assignments, Databases & Subscription Platforms


