
Technology, Media and Telecom
5th MayAccelerating Additive Manufacturing Adoption in India
3 Min Read
Italy Data Center Physical Security Market is Segmented by Component (Solution, Services), Data Center Tier (Tier I and II, Tier III, Tier IV), Data Center Type (Hyperscaler/Cloud Service Providers, Colocation Providers, Enterprise and Edge Data Center). The Market Forecasts are Provided in Terms of Value (USD).
Market Overview
| Study Period | 2020 - 2031 |
|---|---|
| Base Year For Estimation | 2025 |
| Forecast Data Period | 2026 - 2031 |
| Market Size (2026) | USD 21.27 Million |
| Market Size (2031) | USD 41.79 Million |
| Growth Rate (2026 - 2031) | 14.46 % CAGR |
| Market Concentration | Medium |
Major Players *Disclaimer: Major Players sorted in no particular order. Image © Mordor Intelligence. Reuse requires attribution under CC BY 4.0. |
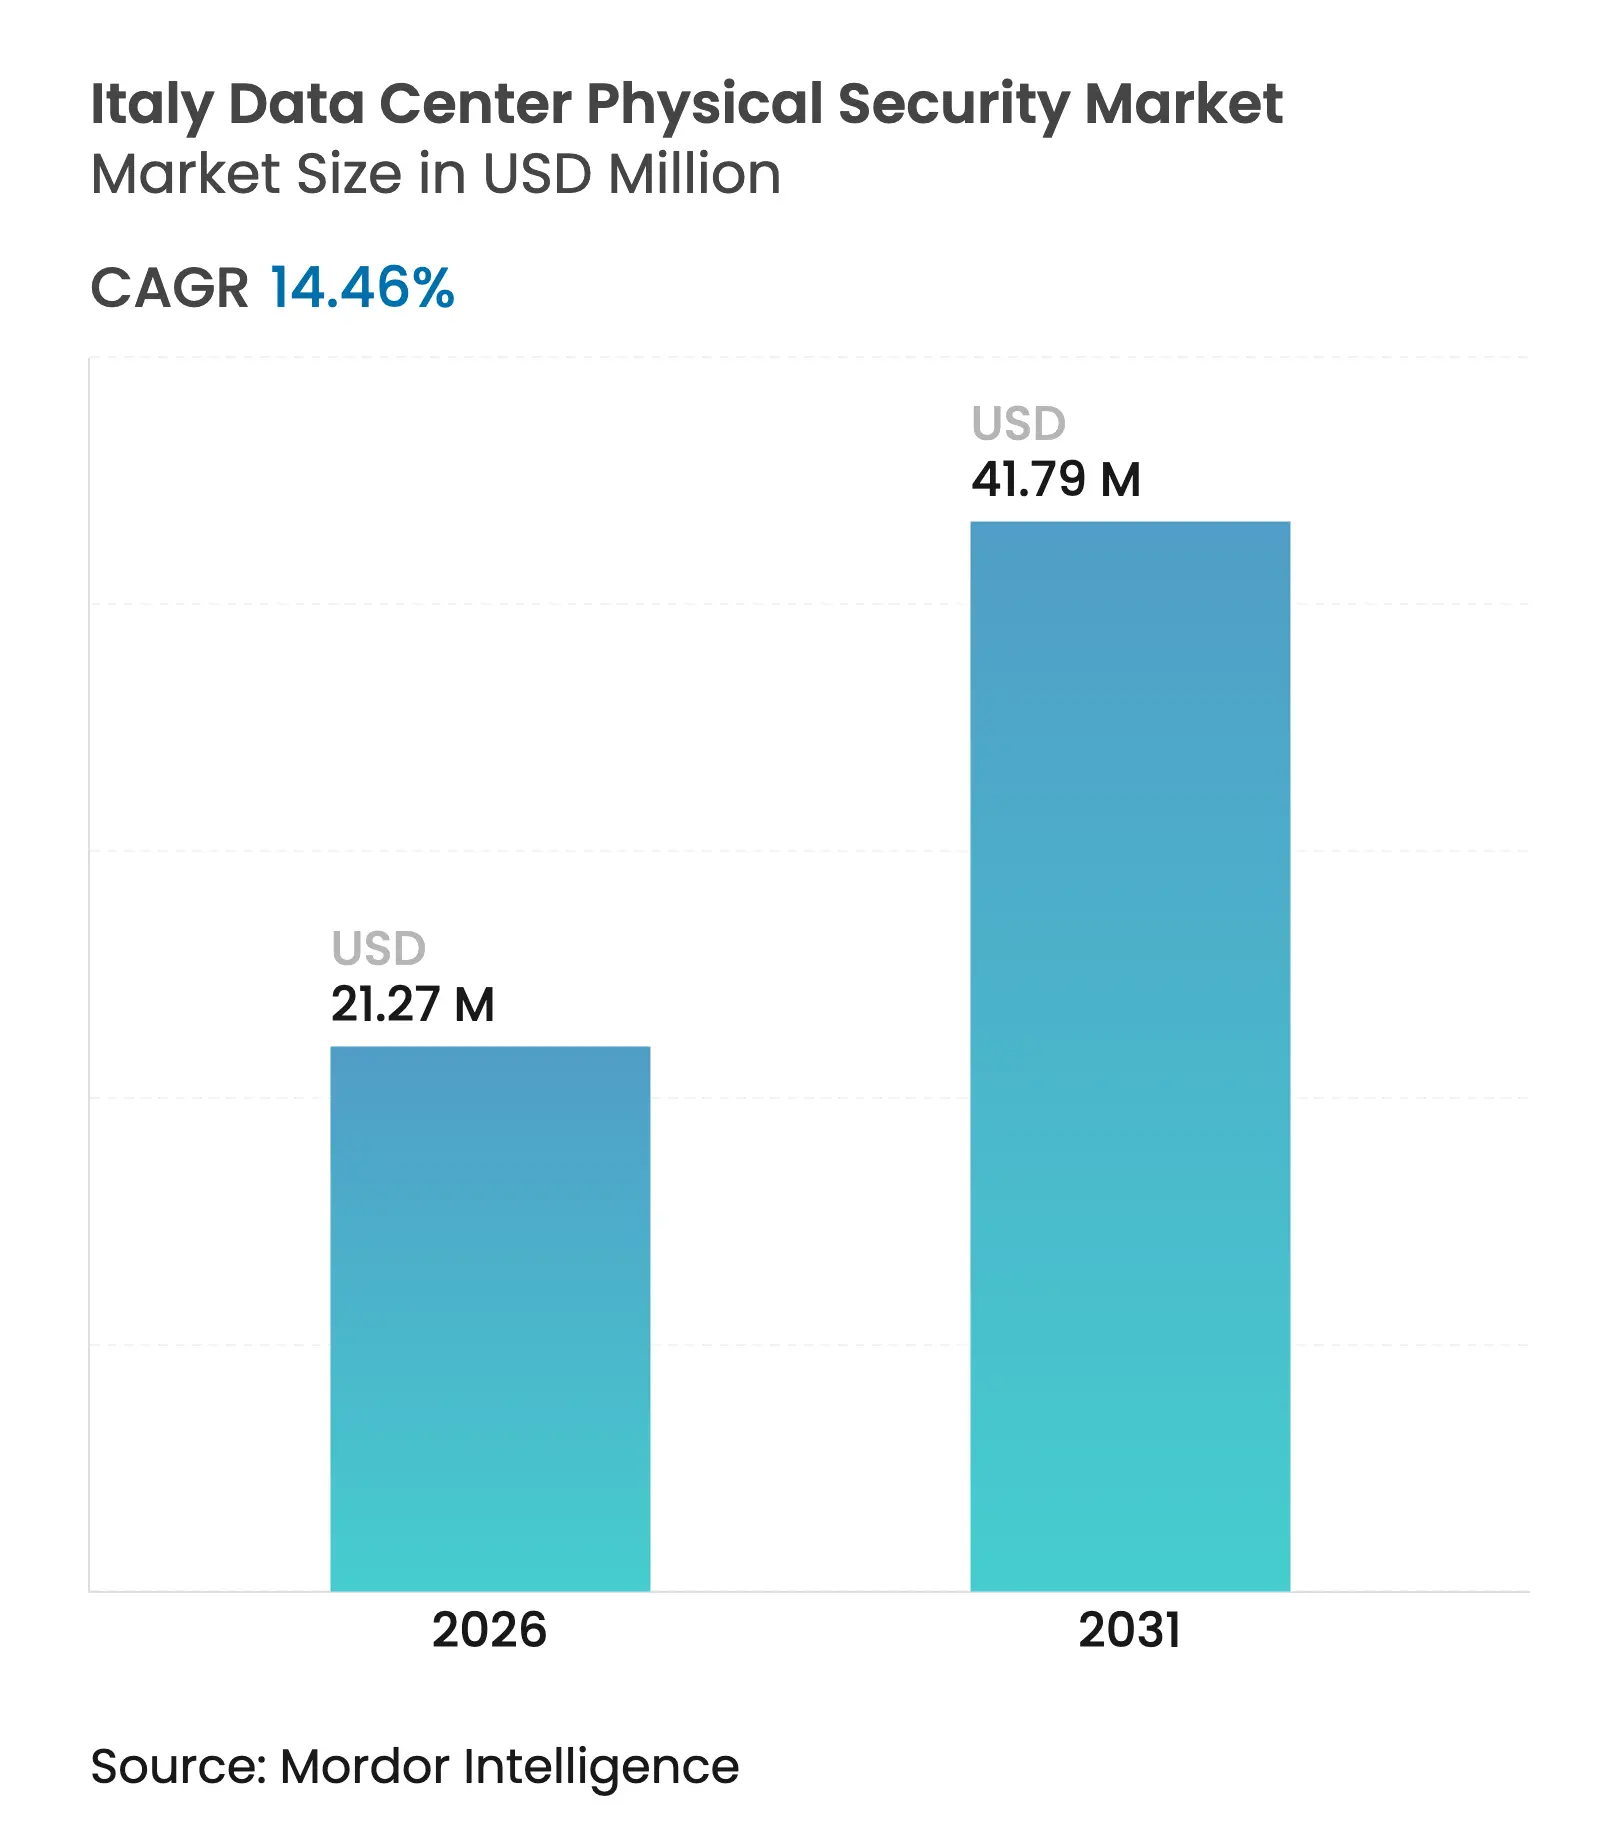
Italy data center physical security market size in 2026 is estimated at USD 21.27 million, growing from 2025 value of USD 18.58 million with 2031 projections showing USD 41.79 million, growing at 14.46% CAGR over 2026-2031. Growth is propelled by the dual compliance burden created by the National Cybersecurity Perimeter law and the EU NIS2 directive, which jointly oblige operators to harden physical infrastructure as much as logical defences. Italy’s EUR 47 billion Recovery and Resilience Plan earmarks sizeable funds for digital sovereignty projects, amplifying demand for secure, audit-ready facilities. In parallel, hyperscalers and colocation providers accelerate campus expansions around Milan, Rome and Turin, embedding multilayer security by design to satisfy public-sector and regulated-industry contracts. Persistent equipment lead-times linked to semiconductor shortages further elevate vendor selection toward firms with diversified manufacturing footprints.
Key Report Takeaways
Note: Market size and forecast figures in this report are generated using Mordor Intelligence's proprietary estimation framework, updated with the latest available data and insights as of 2026.
Drivers Impact Analysis
| Driver | (~)% Impact on CAGR Forecast | Geographic Relevance | Impact Timeline | |||
|---|---|---|---|---|---|---|
Rising cloud-computing and digital-transformation
investments
Rising cloud-computing and digital-transformation
investments
| +3.2% | National, concentrated in Milan, Rome, Turin corridors | Medium term (2-4 years) | (~)% Impact on CAGR Forecast:
+3.2%
|
Geographic Relevance
:
National, concentrated in Milan, Rome, Turin corridors
|
Impact Timeline
:
Medium term (2-4 years)
|
Increasing security-breach exposure & GDPR / NIS2
compliance pressure
Increasing security-breach exposure & GDPR / NIS2
compliance pressure
| +2.8% | National, with heightened focus on essential service operators | Short term (≤ 2 years) | |||
Hyperscale & colocation build-outs in Milan, Rome
and Turin corridors
Hyperscale & colocation build-outs in Milan, Rome
and Turin corridors
| +2.1% | Regional, Milan-Rome-Turin triangle | Medium term (2-4 years) | |||
Edge data-center rollout for Industry 4.0 clusters in
Lombardy & Emilia-Romagna
Edge data-center rollout for Industry 4.0 clusters in
Lombardy & Emilia-Romagna
| +1.9% | Regional, Northern Italy industrial clusters | Long term (≥ 4 years) | |||
National Cybersecurity Perimeter law mandates
physical-security audits
National Cybersecurity Perimeter law mandates
physical-security audits
| +2.4% | National, essential service operators | Short term (≤ 2 years) | |||
EU energy-efficiency funds enabling retrofit of
security-device infrastructure
EU energy-efficiency funds enabling retrofit of
security-device infrastructure
| +1.3% | National, aligned with EU Green Deal initiatives | Long term (≥ 4 years) | |||
| Source: Mordor Intelligence | ||||||
Rising Cloud-Computing and Digital-Transformation Investments
The EUR 47 billion Recovery and Resilience Plan pours capital into sovereign-cloud and e-government projects, pushing private operators to embed advanced surveillance, biometrics and continuous monitoring into every new hall.[1]International Trade Administration, “Italy – Digital Economy Overview,” trade.gov Public-sector tenders such as the Polo Strategico Nazionale require suppliers to certify that physical-security controls equal or exceed cybersecurity mechanisms, reshaping procurement checklists across the Italy data center physical security market. Hyperscalers testing Italian build-outs cite regulatory stability as a decisive factor, and their entrance raises the baseline for multi-layer protection. Hybrid-cloud architectures proliferate, so operators must secure both central campuses and far-edge nodes without diluting audit visibility. As capital spend widens, vendors with cloud-native security-management platforms capture long-tail demand from SMEs aiming to avoid heavy on-premises outlays.
Increasing Security-Breach Exposure & GDPR / NIS2 Compliance Pressure
GDPR fines for physical-layer negligence—such as the EUR 25,000 sanction levied on an Italian university hospital—clarify that data protection laws extend beyond firewalls to gates, mantraps and camera logs. NIS2 broadens this compliance perimeter to some 300,000 EU entities, compelling essential service operators to demonstrate “appropriate and proportional” technical and organisational safeguards that explicitly list physical controls. Incident volumes in European finance rose to 46% of all reported cyber events during 2024, making board-level risk agendas prioritise biometric access, redundant surveillance rings and tamper-evident logging.[2]ENISA, “Threat Landscape 2024 – Finance Sector,” enisa.europa.eu The Italian National Cybersecurity Agency can fine non-conforming entities up to EUR 1.5 million, shortening investment-decision cycles
Hyperscale & Colocation Build-Outs in Milan, Rome and Turin Corridors
Data4’s EUR 1 billion Mil02 campus—the largest single investment in Italy—adopts concentric layers of physical defence, including dual-factor biometrics and AI-enabled perimeter analytics, setting a new benchmark other operators emulate. Aruba’s 30 MW Rome site follows suit with ANSI/TIA-942-C Rating 4 certification that mandates continuous surveillance and multiple authentication zones. Dense fibre routes, proximity to IXPs and government incentive schemes funnel further builds into the Milan-Rome-Turin triangle, concentrating demand for advanced sensors and software-defined incident response across the Italy data center physical security market. Colocation firms differentiate by packaging security SLAs—ranging from escorted access to on-prem SOC desks—around carrier-neutral footprints. The scale effect also attracts global OEMs to localise assembly, relieving semiconductor-led lead-time pressure.
Edge Data-Center Rollout for Industry 4.0 Clusters in Lombardy & Emilia-Romagna
Manufacturers integrating real-time analytics deploy micro-data-centres on factory campuses, each requiring remotely managed, tamper-resistant enclosures that operate without on-site guards. VSIX’s Padova Internet Exchange underscores how network-dense industrial belts now necessitate redundant mini-hubs, each hard-secured despite space and power constraints.[3]Vertiv, “VSIX Edge Deployment Case Study,” vertiv.comThese edge sites blend operational-technology networks with IT assets, so access-control logic must authorise both maintenance engineers and robotic-cell technicians while logging every interaction. The Italy data center physical security market therefore shifts toward modular containment, ruggedised cameras and cloud-hosted credential services capable of scaling across hundreds of micro-locations. Long-term (≥ 4 years) forecast models attribute 1.9% of CAGR uplift to this distributed build-out wave.
Restraint Impact Analysis
| Restraint | (~)% Impact on CAGR Forecast | Geographic Relevance | Impact Timeline | |||
|---|---|---|---|---|---|---|
High CAPEX & OPEX for multi-layer physical-security
architecture
High CAPEX & OPEX for multi-layer physical-security
architecture
| -1.8% | National, particularly affecting SME data center operators | Medium term (2-4 years) | (~)% Impact on CAGR Forecast:
-1.8%
|
Geographic Relevance
:
National, particularly affecting SME data center operators
|
Impact Timeline
:
Medium term (2-4 years)
|
Legacy-system interoperability & integration
complexity
Legacy-system interoperability & integration
complexity
| -1.4% | National, concentrated in established facilities | Short term (≤ 2 years) | |||
Shortage of certified physical-security technicians in
Italy
Shortage of certified physical-security technicians in
Italy
| -1.1% | National, acute in Northern industrial regions | Long term (≥ 4 years) | |||
Power-budget limits driven by new sustainability
regulations (PUE/WUE caps)
Power-budget limits driven by new sustainability
regulations (PUE/WUE caps)
| -0.9% | National, aligned with EU energy efficiency mandates | Medium term (2-4 years) | |||
| Source: Mordor Intelligence | ||||||
High CAPEX & OPEX for Multi-Layer Physical-Security Architecture
Installing perimeter fences, multi-factor biometrics, redundant camera networks and 24/7 SOC coverage can push construction budgets to EUR 38 million per IT megawatt, a level only hyperscalers comfortably absorb. Smaller colocation and enterprise facilities must justify these costs against price-sensitive customers, often delaying upgrades until the next major tenant comes on board. Operating expenses add further strain: continuous manned-guard presence, annual penetration testing and certification audits erode margins. Vendors answer with SaaS-based video-management and pay-per-use credential platforms that shift spending from capex to opex, yet the affordability gap remains a 1.8%. Consolidation is accelerating as under-capitalised sites sell to larger operators able to amortise compliance overheads across bigger portfolios.
Legacy-System Interoperability & Integration Complexity
Many Italian data centers commissioned before 2020 rely on disparate badge systems, analogue CCTV and proprietary alarm loops that lack modern API hooks. Upgrading to unified command layers requires costly rip-and-replace interventions or custom middleware, both of which risk downtime. The challenge intensifies as operators converge cyber and physical dashboards, necessitating real-time event federation without introducing new attack surfaces. Even with guidelines such as EN 50600, site teams face prolonged testing cycles to validate fail-over logic across power, cooling and security realms. These barriers subtract 1.4% from projected CAGR until retrofit toolkits mature and integrator skill shortages ease.
By Component: Solutions Dominate Through Regulatory Mandates
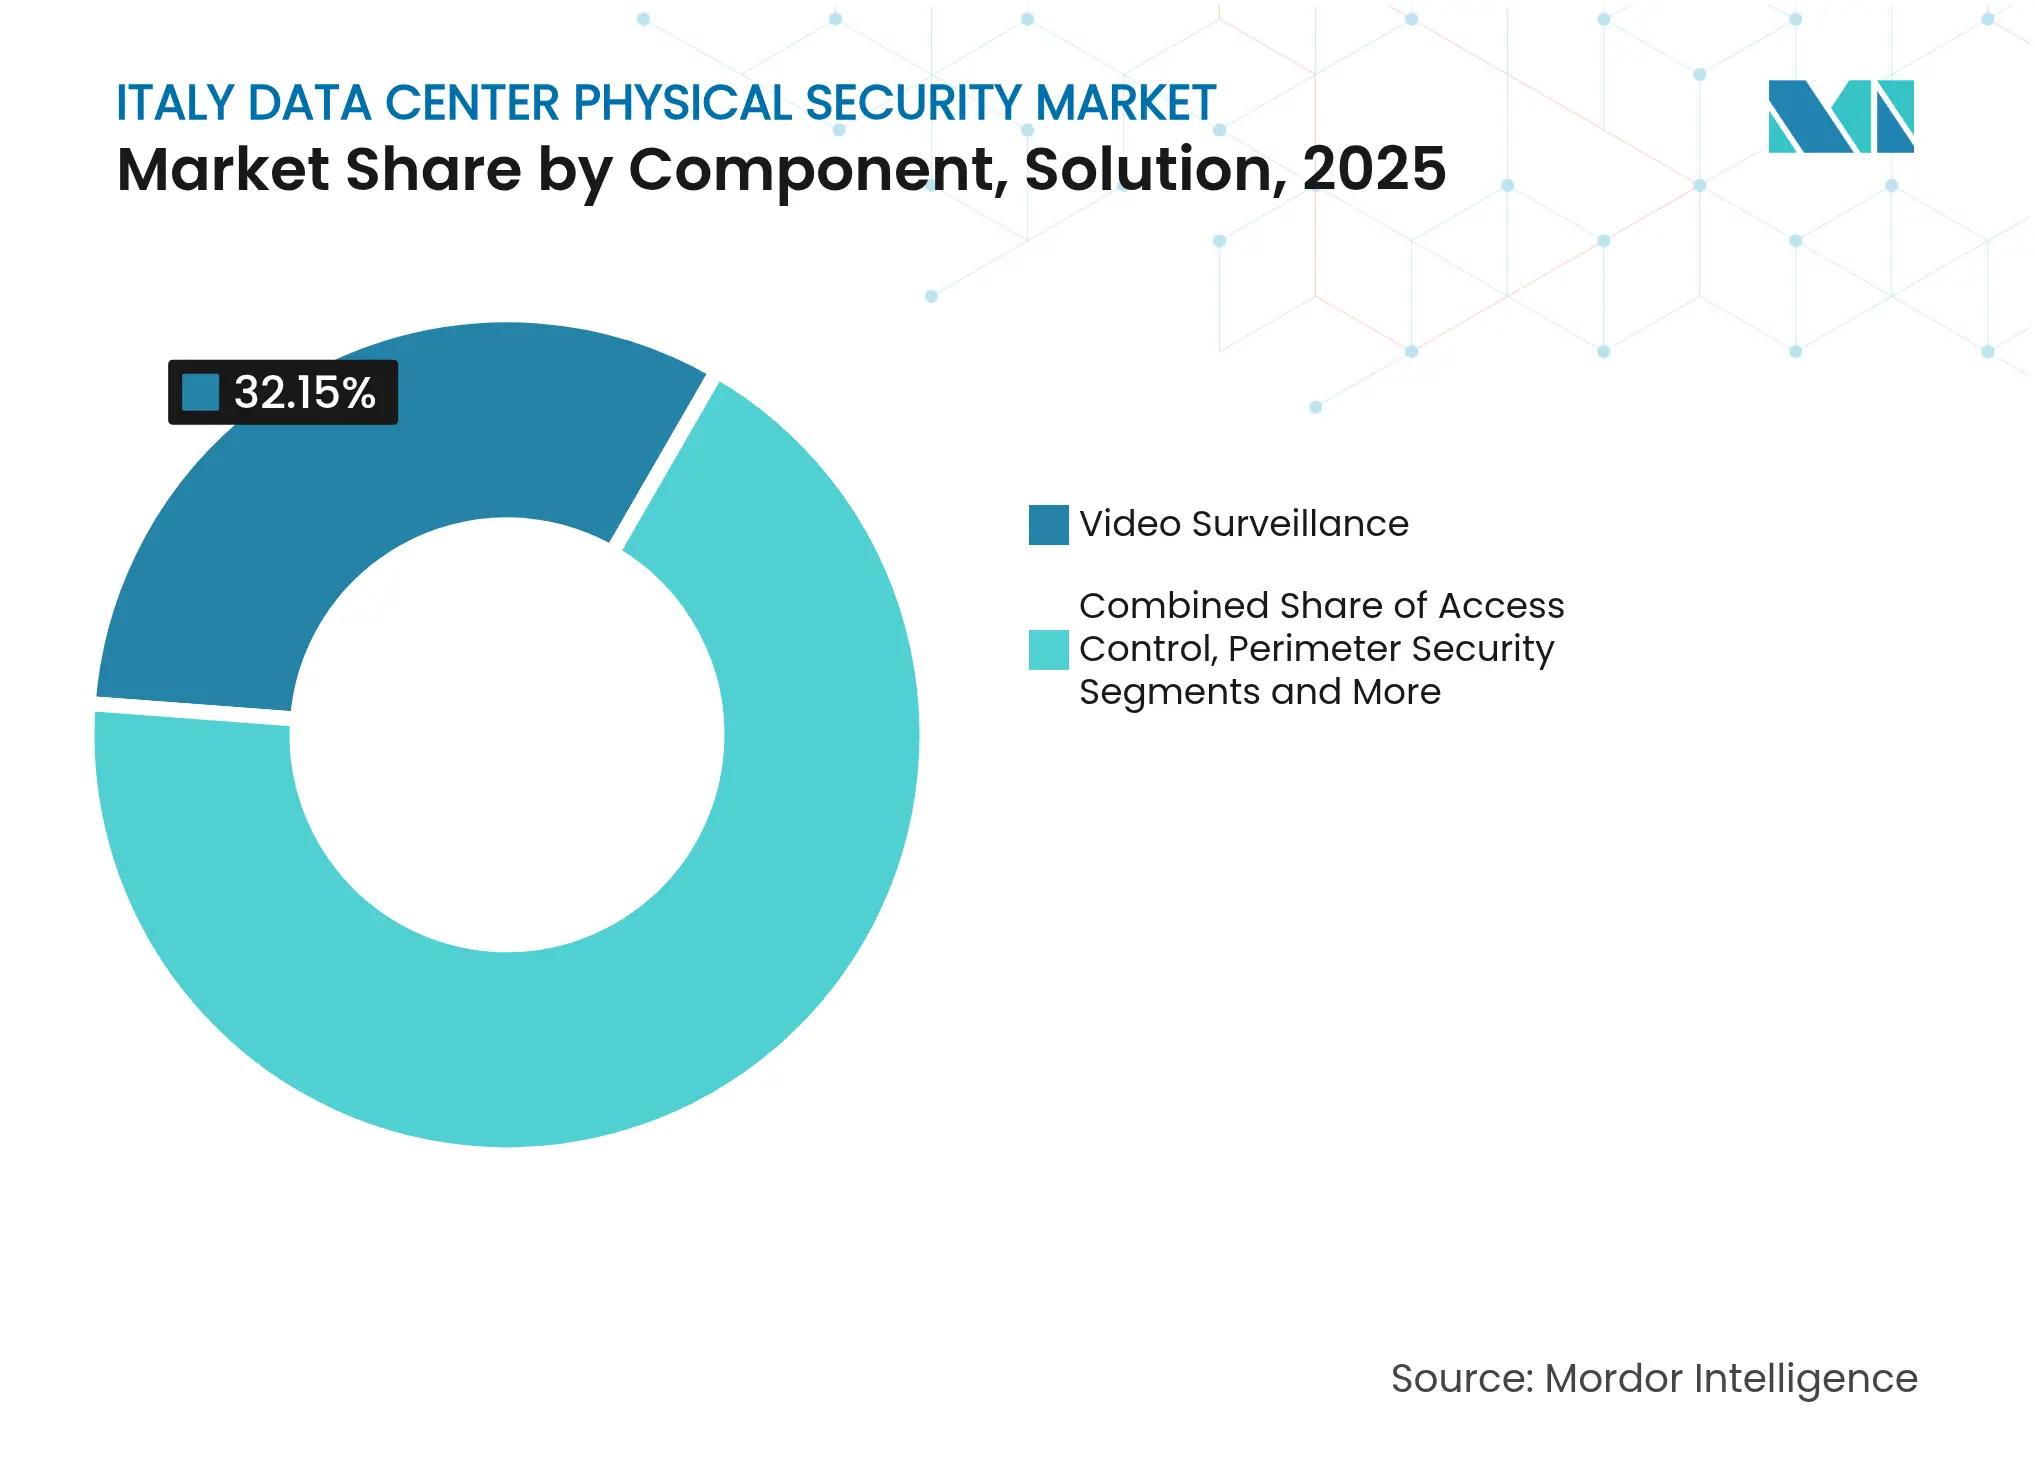
Video-surveillance platforms held 32.15% of 2025 revenue, reinforcing the Italy data center physical security market narrative that visual evidence is indispensable for NIS2 audits. Integration of AI analytics reduces false alarms and lowers guard staffing, so operators upgrade from legacy DVR arrays to cloud-native VMS suites capable of edge inference at the camera level. Access-control hardware follows with the sharpest 15.78% CAGR because financial institutions and healthcare tenants insist on biometrics and adaptive risk scoring at every portal. Perimeter-security packages comprising fences, bollards, and dual-technology detectors sustain steady orders as hyperscaler campuses demand spatial zoning and vehicle mitigation. Intrusion detection gains traction through microwave-radar overlays integrated into the same PSIM dashboards that unify badging, cameras and cyber-SIEM alerts. Environmental and fire-safety subsystems round out deployments, with premium on integrated gas suppression and thermal imaging in battery rooms. Service revenue accelerates as operators outsource compliance mapping, commissioning, and lifecycle support, reinforcing a shift from product equity to annuity contracts across the Italian data center physical security market.
Note: Segment shares of all individual segments available upon report purchase
By Data-Center Tier: Tier III Facilities Lead Market Share
Tier III halls accounted for 62.90% of the italy data center physical security market size in 2025, reflecting colocation operators’ preference for N+1 redundancy that balances uptime with capital efficiency. These facilities embed dual-path surveillance backbones and redundant access-control controllers so that maintenance windows do not weaken defences. Tier IV footprints are comparatively small yet exhibit a 16.62% CAGR as hyperscalers and BFSI stacks insist on fault-tolerant power and concurrent maintainability from cage to campus. Here, physical-security gear is duplicated across separate feeds, and even visitor-management kiosks sit behind dual UPS chains. Tier I and II rooms linger in edge and enterprise closets, often retrofitted with cloud-managed cameras and badge readers because budget priorities sit elsewhere. Over the forecast horizon, rising energy-efficiency legislation will push operators to re-architect older tiers, indirectly lifting demand for modular security pods that meet EN 50600 alignment without full-scale rebuilds, thus expanding the italy data center physical security market.
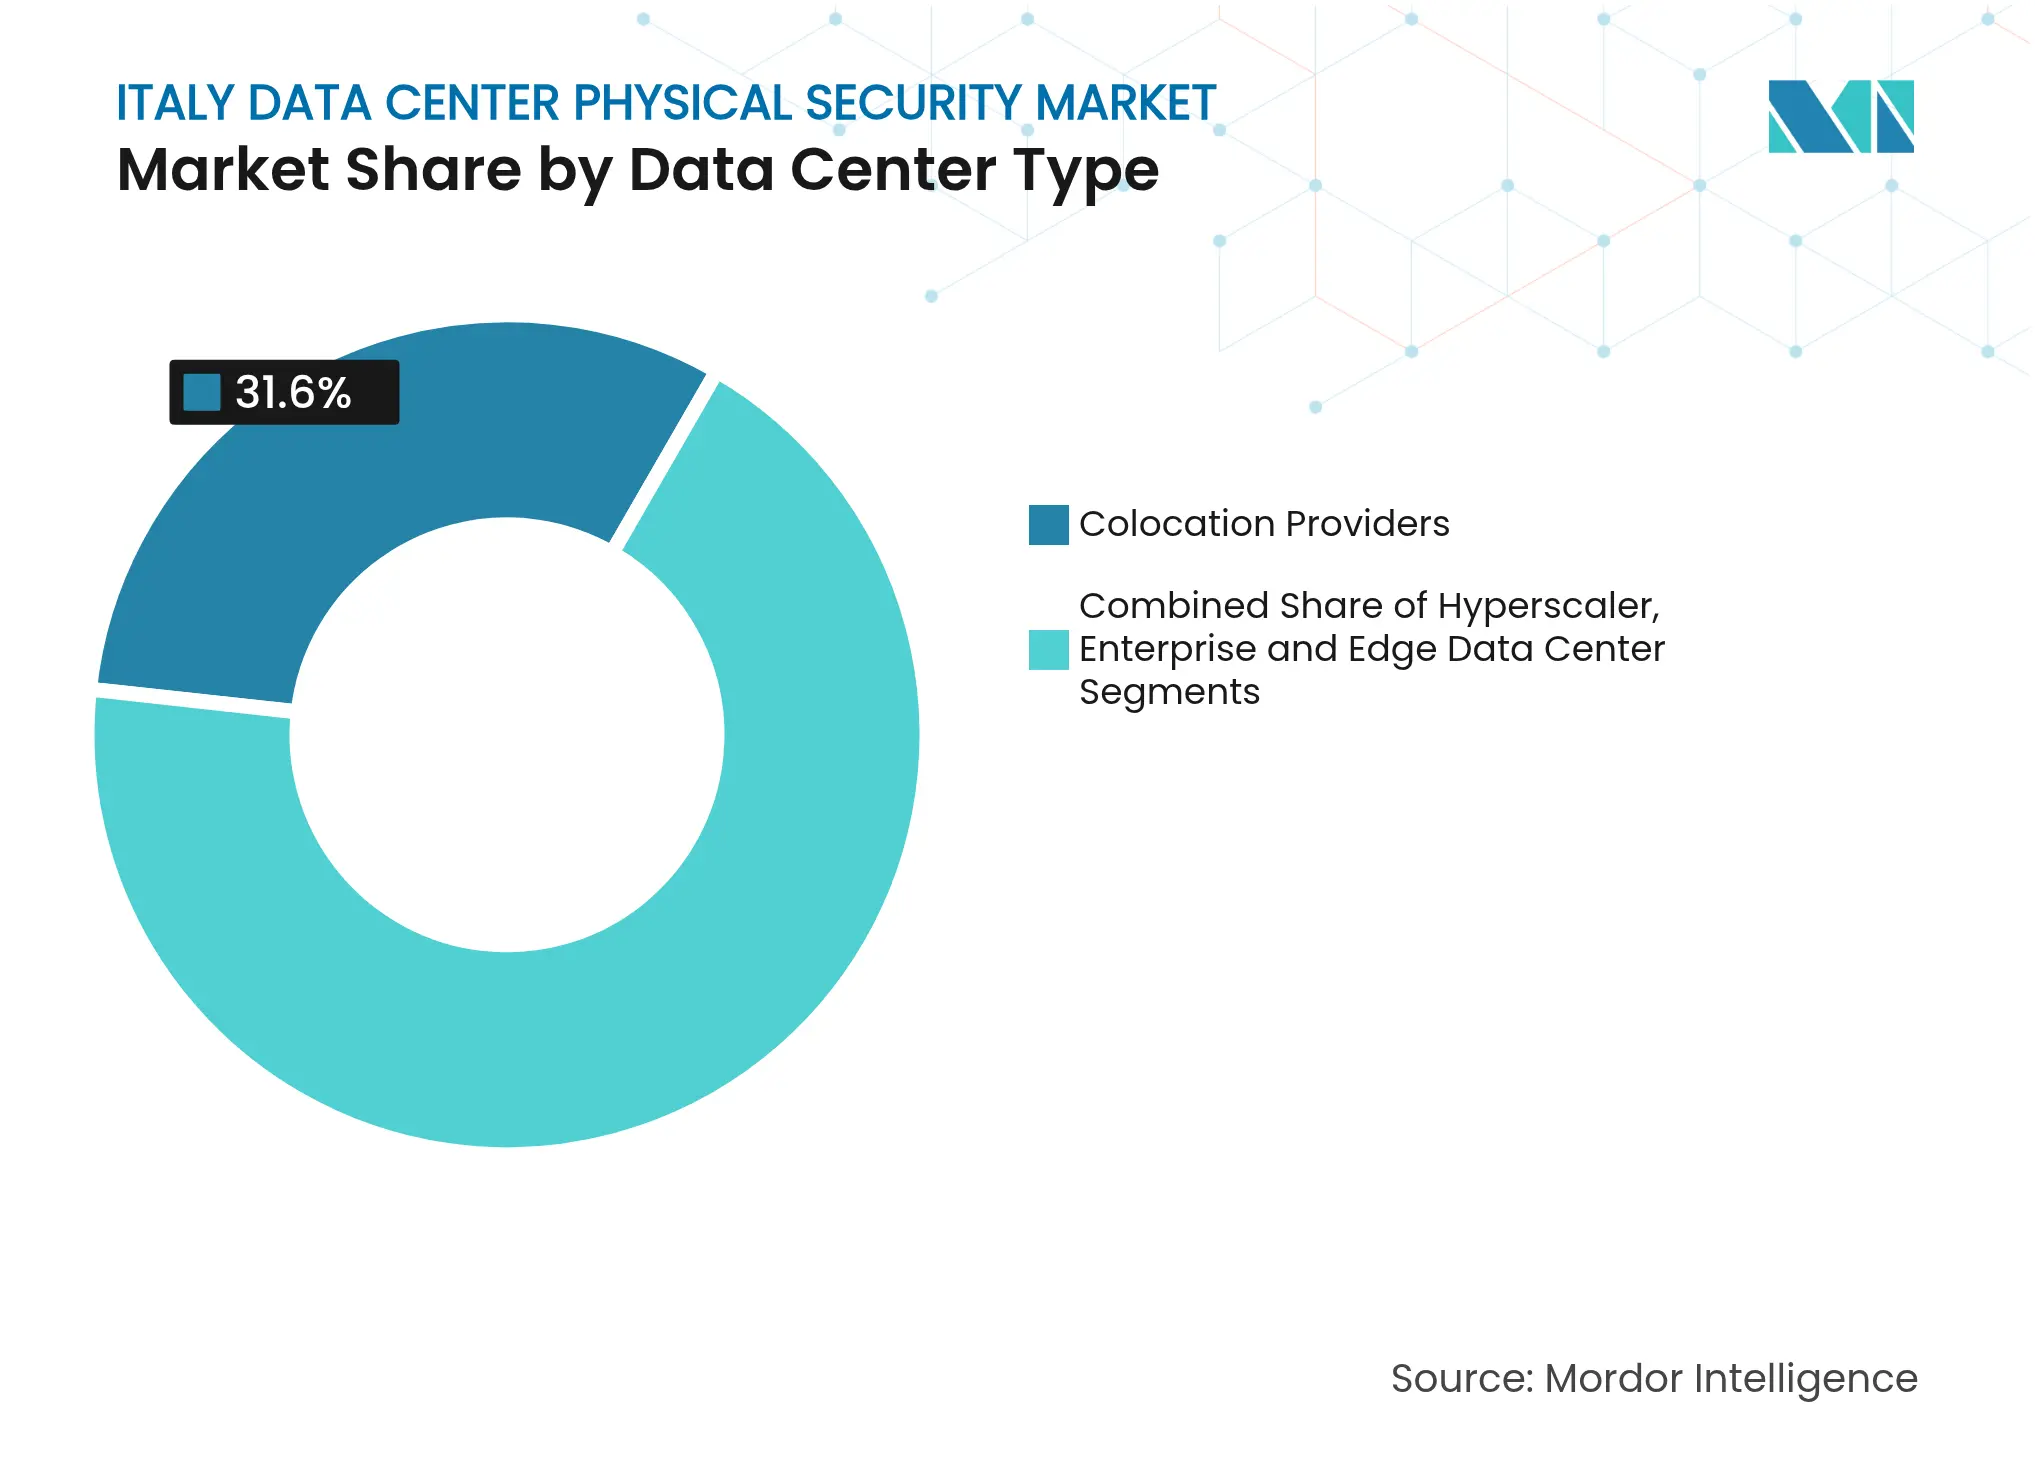
By Data Center Type: Colocation Providers Navigate Competitive Pressures
Colocation operators controlled 31.60% revenue in 2025, anchoring the italy data center physical security market through volume of secured racks rented to multi-tenant clients. Their business model depends on proving segregation effectiveness, so investment concentrates on mantraps, interlock cages and SOC-as-a-Service offerings bundled into SLAs. Hyperscale and cloud facilities, though fewer in number, grow fastest at 16.41% CAGR, propelled by the AWS European Sovereign Cloud programme that must satisfy strict localisation and physical-governance criteria aws. Enterprise and on-prem data centers shrink in relative terms yet display niche vitality where data-sovereignty or low-latency imperatives justify private infrastructure. Edge nodes attached to factories or 5G towers emerge as a fresh sub-segment, requiring ruggedised, remote-managed locks and tamper sensors. Vendors responding with integrated hardware-plus-subscription bundles will capture a bigger slice of the italy data center physical security market size during this edge inflection.
Note: Segment shares of all individual segments available upon report purchase
Northern Italy dominates spending: Milan alone captures an estimated 41.35% of 2025 deployments as its dense fibre mesh and IXPs attract hyperscale anchor tenants, lifting the italy data center physical security market share for Lombardy above all other regions Rome follows, propelled by public-sector hosting mandates and the newly launched 30 MW Hyper Cloud campus, whose Rating 4 certification requires round-the-clock manned protection and dual-factor authentication at every layer. Turin rounds out the golden triangle by coupling automotive Industry 4.0 plants with edge mini-data-centres, each equipped with ruggedised camera domes and vibration-tolerant locking mechanisms.
Lombardy and Emilia-Romagna manufacturing belts drive distributed deployments, where factory-attached micro-hubs must comply with WS-02 edge-security guidelines yet operate in high-vibration, dust-prone environments. Here, remote-managed access control lowers technician travel cost while closing audit gaps. Veneto’s VSIX node illustrates how regional IXPs incentivise local caching centres that mimic large-campus security but right-size it to 1-3 MW footprints. Meanwhile, Piedmont invests EU Green Deal grants into retrofitting older halls, replacing halon gas with inert clean-agent suppression tied into the same PSIM panel that orchestrates cameras and physical-intrusion alarms.
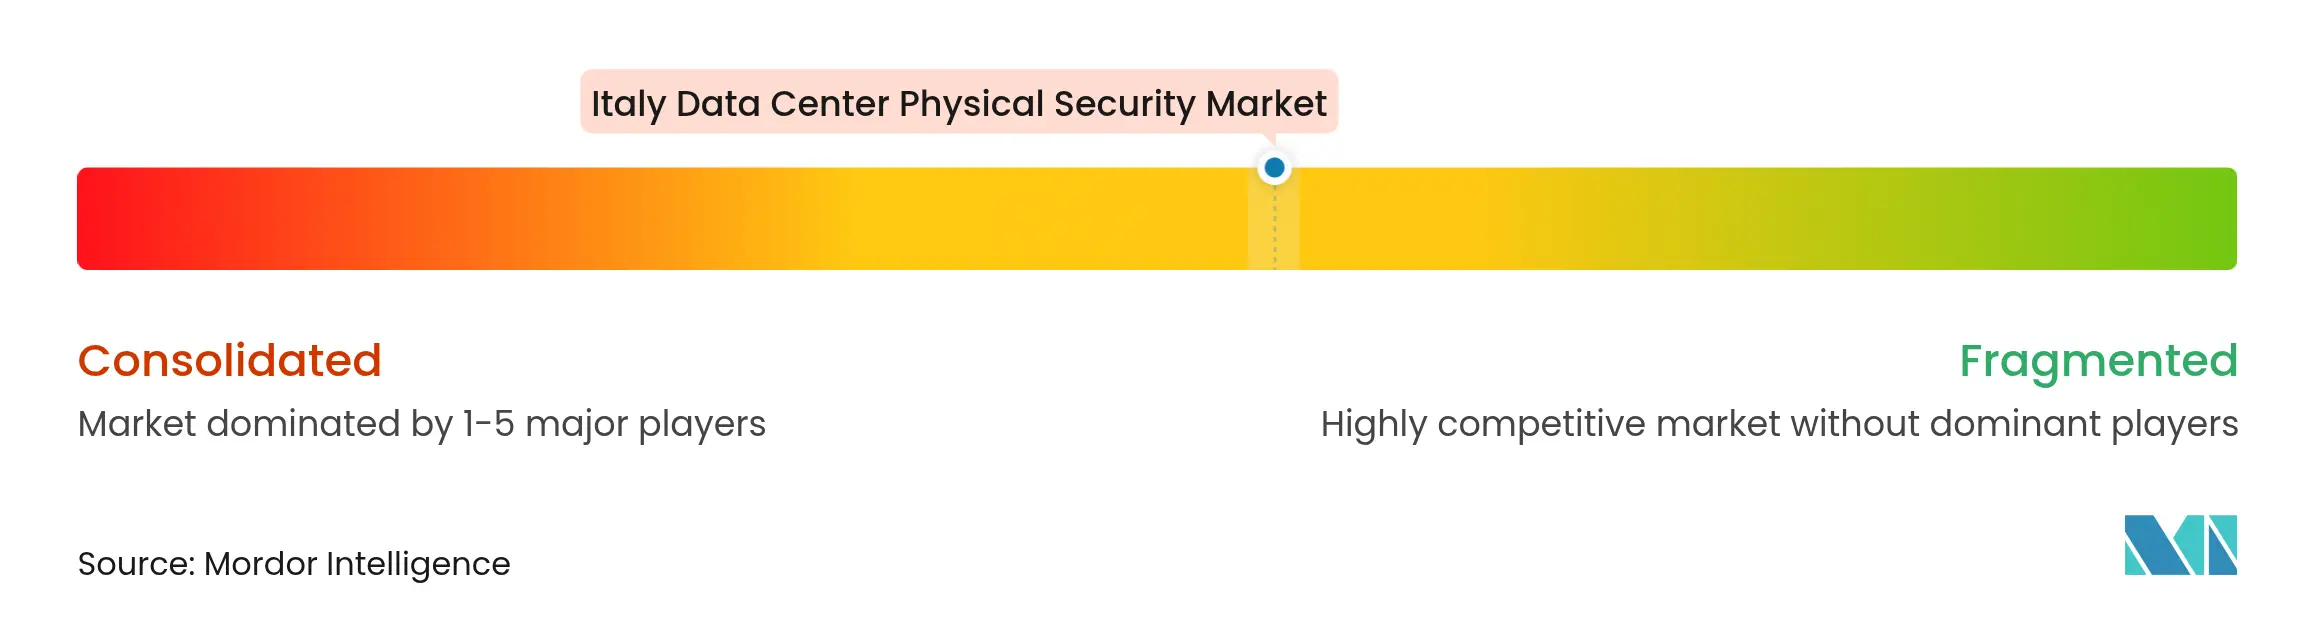
Market Concentration
Market structure remains moderately fragmented, though compliance economics are nudging providers toward consolidation. Energy-services heavyweights ABB, Schneider Electric and Siemens bundle switchgear, controls and surveillance into integrated design-build contracts, leveraging scale to absorb certification costs. Axis Communications, Bosch and Hikvision dominate camera endpoints by volume, racing to embed edge AI analytics that lessen downstream storage and bandwidth. Honeywell, LenelS2 and ASSA ABLOY lead access-control ecosystems, each aligning roadmaps to open API frameworks so clients can merge badge events with SIEM toolsets.
Software-oriented challengers such as Genetec push platform unification, offering cloud-hosted PSIM dashboards that normalise camera, intrusion and cyber logs in a single console genetec. Nozomi Networks, buoyed by a USD 100 million round backed by industrial majors, extends OT-focused anomaly detection into physical-sensor telemetry, blurring lines between cyber and perimeter domains nozominetworks. At the edge, Vertiv packages micro-modular enclosures with built-in smart-lock kits and environmental probes, targeting Industry 4.0 roll-outs that cannot justify full SOC staffing.

*Disclaimer: Major Players sorted in no particular order
1. INTRODUCTION
2. RESEARCH METHODOLOGY
3. EXECUTIVE SUMMARY
4. MARKET LANDSCAPE
5. MARKET SIZE AND GROWTH FORECASTS (VALUE)
6. COMPETITIVE LANDSCAPE
7. MARKET OPPORTUNITIES AND FUTURE OUTLOOK
Market Definitions and Key Coverage
Segmentation Overview
Detailed Research Methodology and Data Validation
Primary Research
Desk Research
Market-Sizing & Forecasting
Data Validation & Update Cycle
Why Mordor's Italy Data Center Physical Security Baseline Is Trusted
Benchmark comparison
| Market Size | Anonymized source | Primary gap driver | ||
|---|---|---|---|---|
USD 18.58 M (2025) | Mordor Intelligence | - | Anonymized source:Mordor Intelligence | Primary gap driver:- |
USD 68.00 M (2024) | Regional Consultancy A | Includes building-wide guarding and facility hardening; relies on national ICT capex ratio, annual update | ||
USD 60.16 M (2023) | Industry Association B | Bundles server-room upgrades, uses static 2022 €:USD rate, five-year refresh cycle |
Accelerating Additive Manufacturing Adoption in India
3 Min Read
Pricing Strategy for Semiconductor Components
3 Min Read
Strategic Expansion in the Russia Laundry Appliances Market
3 Min Read
When decisions matter, industry leaders turn to our analysts. Let’s talk.