Italy Data Center Networking Market Size and Share
Market Overview
| Study Period | 2020 - 2031 |
|---|---|
| Forecast Data Period | 2026 - 2031 |
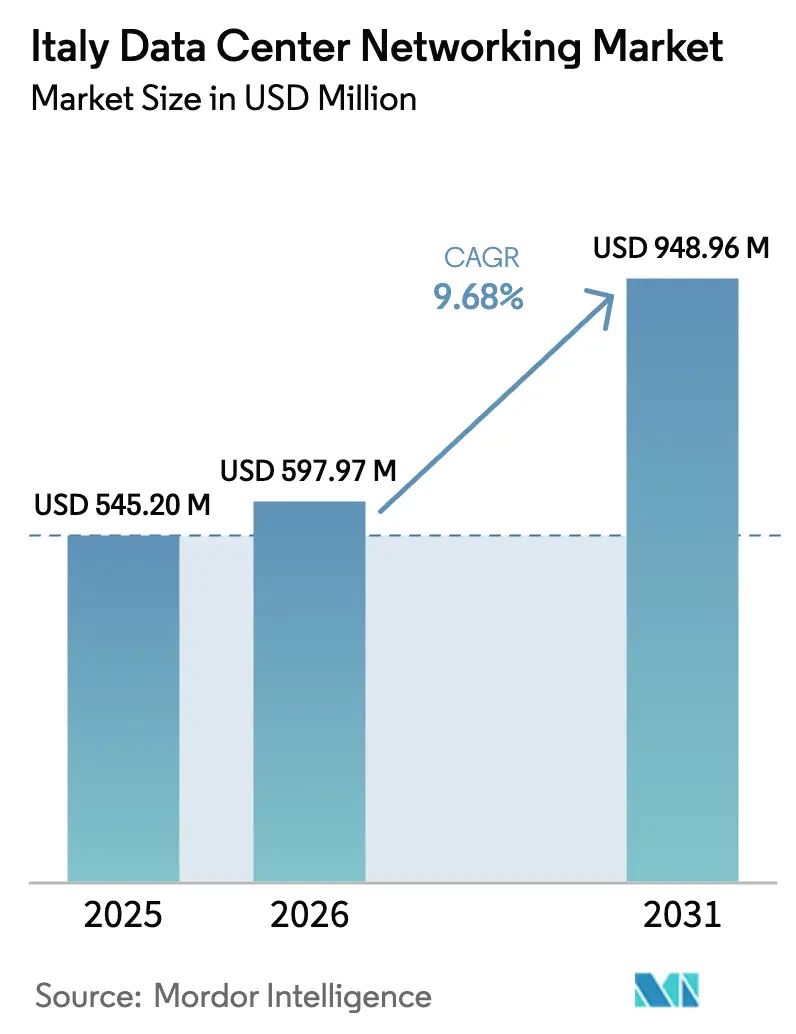
| Base Year Market Size (2025) | USD 545.20 Million |
| Market Size (2026) | USD 597.97 Million |
| Market Size (2031) | USD 948.96 Million |
| Growth Rate (2026 - 2031) | 9.68% CAGR |
| Market Concentration | Medium |
Major Players *Disclaimer: Major Players sorted in no particular order Image © Mordor Intelligence. Reuse requires attribution under CC BY 4.0. | |
Italy Data Center Networking Market Analysis by Mordor Intelligence
The Italy Data Center Networking Market size is expected to grow from USD 545.20 million in 2025 to USD 597.97 million in 2026 and is forecast to reach USD 948.96 million by 2031 at 9.68% CAGR over 2026-2031.
The Italy data center networking market stands at USD 545.2 million in 2025 and is projected to reach USD 870.4 million by 2030, advancing at a 9.81% CAGR. The Italy data center networking market benefits from the country’s role as a digital bridge linking Europe with the Middle East and Africa, a position reinforced by the EUR 194.4 billion National Recovery and Resilience Plan, which channels 25.6% of spending into digital objectives. Investments in large-scale cloud regions by Microsoft, AWS and Google, combined with submarine-cable landings along the Tyrrhenian coast, accelerate demand for hyperscale fabrics and high-capacity optical backbones. At the same time, the number of Italian data-center interconnections has expanded 40-fold since 2021, underscoring a structural shift toward low-latency, cloud-first workflows. Edge facilities in industrial districts, PNRR-funded public-sector digitalization, and a national cybersecurity strategy that mandates segmented, monitored networks further propel the Italy data center networking market. Competitive dynamics remain moderate as entrenched vendors protect share while open-networking specialists challenge proprietary stacks.
Key Report Takeaways
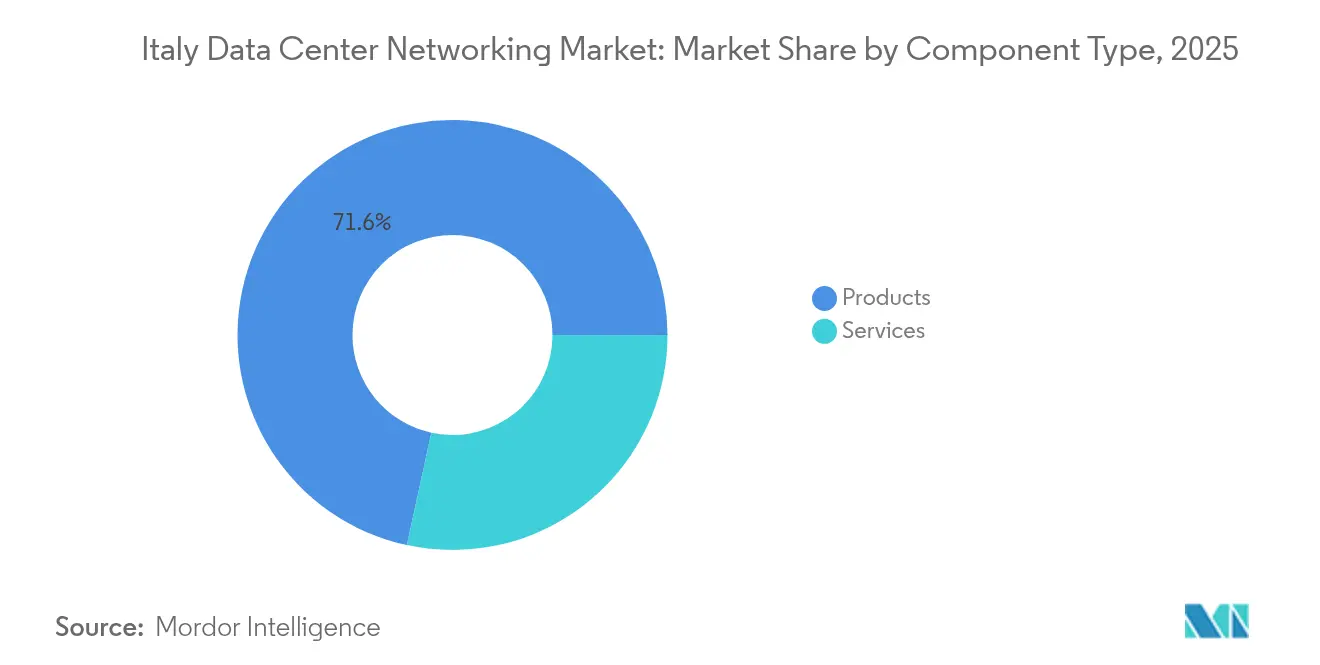
- By component, products led with 71.60% of the Italy data center networking market share in 2025, whereas services are forecast to expand at 12.02% CAGR to 2031.
- By end-user, IT & Telecommunications held 31.85% revenue share in 2025, while healthcare and life sciences advance at a 13.12% CAGR through 2031.
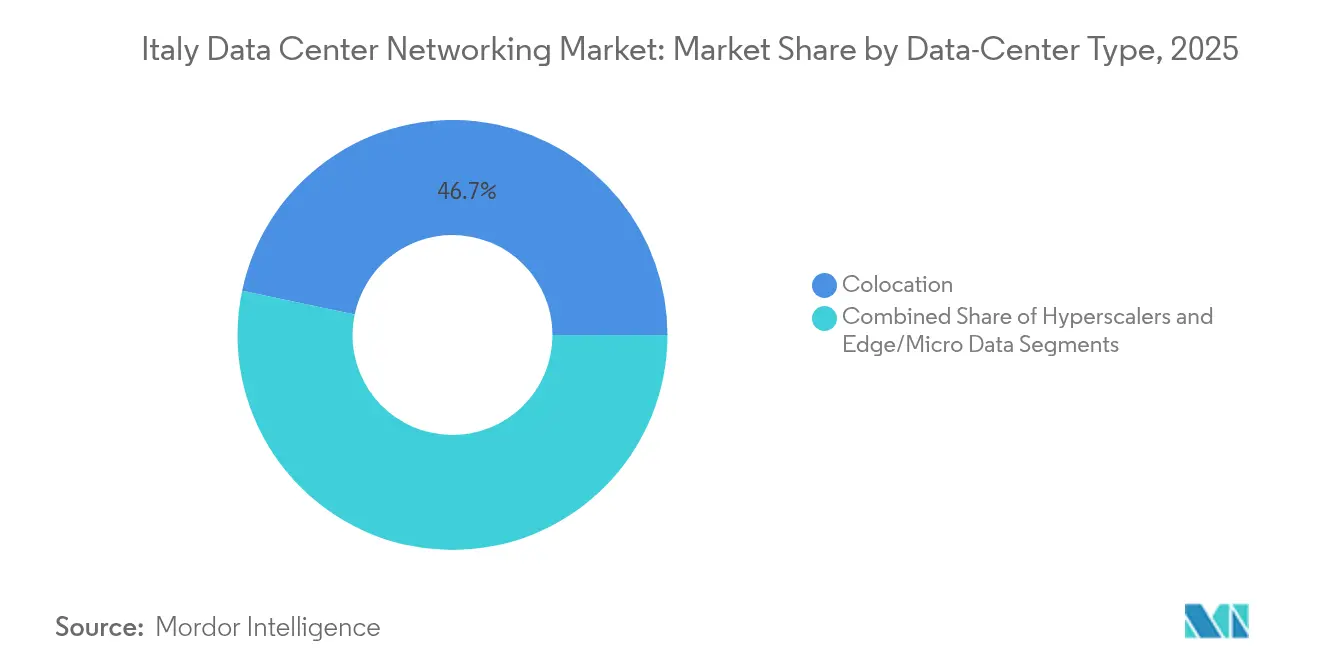
- By data-center type, colocation facilities accounted for 46.70% of the Italy data center networking market size in 2025, yet hyperscalers/cloud service providers record the highest projected CAGR at 14.07% to 2031.
- By bandwidth, the 50–100 GbE segment captured 35.95% share of the Italy data center networking market size in 2025; >100 GbE is growing fastest at 13.96% CAGR on rising AI workloads
Note: Market size and forecast figures in this report are generated using Mordor Intelligence’s proprietary estimation framework, updated with the latest available data and insights as of 2026.
Figures recorded within Italy feed into a worldwide estimate while studying the global industry. Mordor Intelligence's data center networking market size captures this aggregation.
Italy Data Center Networking Market Trends and Insights
Drivers Impact Analysis*
| Driver | (~) % Impact on CAGR Forecast | Geographic Relevance | Impact Timeline |
|---|---|---|---|
| Increasing utilization of cloud storage and hyperscale build-outs | +2.1% | National (Milan, Rome hubs) | Medium term (2–4 years) |
| Rising need for data backup and GDPR-driven retention | +1.8% | National; regulated verticals | Long term (≥ 4 years) |
| Edge computing & IoT traffic explosion | +1.5% | Industrial North | Short term (≤ 2 years) |
| Open networking (white-box, SONiC) adoption | +1.2% | Hyperscaler clusters | Medium term (2–4 years) |
| PNRR funding for public-sector digital infra | +1.7% | Underserved regions | Short term (≤ 2 years) |
| Liquid-cooling-ready high-bandwidth fabrics | +0.9% | Large campuses | Long term (≥ 4 years) |
| Source: Mordor Intelligence | |||
Increasing utilization of cloud storage and hyperscale build-outs
Global cloud providers are racing to establish sovereign cloud regions in Milan and Rome to serve both Italian and pan-European workloads. Google’s partnership with TIM, Microsoft’s forthcoming Azure region, and AWS’s footprint expansion all require 100 G/400 G Ethernet leaf-spine fabrics, optical cross-connects, and software-defined overlay controllers capable of orchestrating multi-tenant traffic at scale. Apto’s USD 3.4 billion, five-building campus south of Milan highlights the depth of hyperscale capital flowing into the Italy data center networking market. The national cloud initiative, funded at EUR 950 million, further boosts demand for sovereign, secure interconnects as public-sector datasets migrate off-prem to accredited facilities.
Edge computing & IoT traffic explosion
Industry 4.0 incentives helped Italian manufacturers spend EUR 7.1 billion on advanced digital machinery in 2022.[1]International Trade Administration, “Italy – Advanced Manufacturing,” trade.gov Real-time control loops—enabled by Time-Sensitive Networking, Gigabit Ethernet field buses, and micro-modular data centers—generate a surge of east-west traffic that never reaches hyperscale cores. Cellnex’s partnership with Everynet to deploy national LoRaWAN coverage and Open Fiber’s edge-pop strategy delivers last-mile links that must be secured, segmented, and monitored via compact 100 G switch-routers. These deployments underscore how edge computing keeps the Italy data center networking market anchored to regional industrial clusters.
PNRR funding for public-sector digital infra
More than EUR 5.3 billion of PNRR money is earmarked for very high-capacity fixed and mobile networks. Projects range from connecting 23,300 schools to FTTH to equipping municipal hospitals with 10 G WAN links. FibreConnect’s EUR 50 million EIB loan extends dark-fiber rings into industrial parks where less than 20% enjoyed carrier-grade coverage. The funding compresses digital-divide timelines and commits public entities to enterprise-grade routers, next-generation firewalls and network-access-control platforms that align with the ACN’s zero-trust guidelines.
Open networking (white-box, SONiC) adoption
Italian cloud operators are pivoting toward disaggregated switches running the open-source Software for Open Networking in the Cloud (SONiC), attracted by vendor independence and a faster ASIC refresh cadence. Dell Technologies has certified its Enterprise SONiC distribution on the latest 25.6 T switches, offering micro-burst control tailored to AI clusters.[2]Dell Technologies, “Enterprise SONiC Distribution for modern workloads,” dell.com Hyperscalers cite lower capex, simplified automation, and the ability to innovate at the NOS layer as reasons for bypassing proprietary stacks. This trend rewards ODM-style hardware suppliers and drives uptake of intent-based controllers that inventory and program multi-vendor fabrics across the Italy data center networking market.
Restraints Impact Analysis*
| Restraint | (~) % Impact on CAGR Forecast | Geographic Relevance | Impact Timeline |
|---|---|---|---|
| Shortage of skilled networking professionals | −1.4% | Northern industrial hubs | Long term (≥ 4 years) |
| High capex for 100 G/400 G migration | −1.1% | Major campuses | Medium term (2–4 years) |
| Energy-price volatility impacting TCO | −0.8% | Large facilities | Short term (≤ 2 years) |
| ASIC supply-chain disruptions | −0.7% | Global sourcing | Medium term (2–4 years) |
| Source: Mordor Intelligence | |||
Shortage of skilled networking professionals
Only 46% of Italians possess basic digital skills, well below the EU average, creating a perennial talent deficit. Roughly 184,000 ICT vacancies were posted between January 2023 and August 2024, yet many roles—network automation engineers, penetration testers, SREs—remain unfilled. The Piano Nuove Competenze forecasts that up to 3.6 million workers will require digital upskilling by 2028. For data-center operators, the scarcity inflates salaries, extends deployment timelines, and increases reliance on managed services, tempering the pace at which the Italy data center networking market can adopt bleeding-edge architectures.
High capex for 100 G/400 G migration
Migrating from 10 G/40 G to 100 G or 400 G mandates new optics, higher-density leaf-spine topologies, and facility upgrades for power and cooling. Cisco’s 8111-32EH 25.6 T switch promises 77% power savings per bit, yet requires redesigned racks and fiber plant to realize those economics. Rising equipment tariffs on Chinese ODM gear further inflate acquisition prices. Public-sector buyers and mid-market enterprises often phase their optics rollouts over multiple budget cycles, slowing the addressable revenue curve for the Italy data center networking market.
*Our forecasts treat driver/restraint impacts as directional, not additive. The impact forecasts reflect baseline growth, mix effects, and variable interactions.
Segment Analysis
By Component: Products Lead While Services Accelerate
Products account for 71.60% of 2025 spending, anchored by Ethernet switches, routers and next-generation firewalls that form the physical backbone of Italy’s colocation and cloud campuses. The Italy data center networking market size for switching hardware alone approaches USD 292.7 million in 2025, buoyed by hyperscaler demand for 100 G ToR platforms and by the roll-out of compact 1 U edge switches with redundant AC/DC feeds. Security appliances also expand as the ACN mandates inline inspection at every demarcation point.
Services, though smaller, are growing at 12.02% CAGR because the talent shortage compels operators to outsource design, deployment, and 24×7 NOC management. Managed SD-WAN, NaaS and lifecycle-optimization contracts bundle consulting, staff augmentation and AI-driven monitoring. Colocation tenants increasingly request white-glove cross-connect provisioning and micro-segmentation audits, elevating services revenue faster than hardware in the Italy data center networking market.


By End-User: Healthcare Disrupts IT Dominance
IT & Telecommunications held 31.85% share of the Italy data center networking market size in 2025, supported by carrier core upgrades and 5G backhaul densification. Nevertheless, healthcare and life sciences will outpace every other vertical at 13.12% CAGR through 2031, propelled by telemedicine, PACS image archiving and medical IoT gateways that demand deterministic, low-latency interconnects. GenAI-driven diagnostic tools push traffic toward GPU clusters, further lifting switch port counts.
Banks and insurers sustain mid-single-digit growth as PSD2 and DORA rules compel transaction-level logging and active-active DR topologies. Manufacturing follows closely, integrating TSN-enabled robots with 25 G industrial Ethernet and deploying fog nodes inside plants. Each vertical’s security obligations converge on zero-trust network access, helping the Italy data center networking industry embed deep-packet inspection and continuous-assurance frameworks across multiple customer segments.
By Data-Center Type: Hyperscalers Challenge Colocation Leadership
Colocation operators commanded 46.70% of revenue in 2025, leveraging carrier-neutral meet-me rooms and economies of scale in power procurement. Several have pre-sold entire halls to cloud service providers looking for quick market entry. Yet hyperscalers will log a 14.07% CAGR, shifting the Italy data center networking market share landscape as sovereign cloud regions come online. Their preference for spine-leaves running SONiC and 400 G ZR+ optics reshapes vendor scorecards.
Edge and micro facilities multiply near logistics hubs and university cities, bringing single-rack PODs with integrated liquid-cooling manifolds. This topology forces orchestration platforms to manage thousands of miniature LANs while maintaining deterministic latency ceilings. Vendors that bundle asset discovery, fabric automation and energy analytics are gaining traction with operators that lack on-site staff and require remote remedial controls.
By Bandwidth: Greater than 100 GbE Gains Momentum
The 50–100 GbE tier remains the workhorse, yet >100 GbE will post the fastest gains at 13.96% CAGR as AI inferencing pipelines and HPC clusters overwhelm older backbones. Fastweb’s NeXXt AI Factory, featuring an NVIDIA DGX SuperPOD, links each node with 400 G interfaces, underscoring the pace of bandwidth inflation ilsole24ore.com. National research networks such as GARR are already testing 800 G wavelengths, demonstrating that optical plant is scaling in lockstep garr.it.
The ≤10 GbE cohort lingers inside edge enclosures, SMB server rooms and brownfield metro PoPs where budget constraints or legacy copper still dominate. Meanwhile, 25–40 GbE continues serving mid-tier aggregation layers but will peak before 2027 as operators leapfrog directly to 100 G optics once price parity approaches. Optics vendors that can supply QSFP112 and QSFP-DD modules in volume without supply-chain hiccups stand to capture disproportionate wallet share in the Italy data center networking market.
Geography Analysis
Northern Italy, led by Lombardy and its capital Milan, hosts roughly 26% of national data-center white-space and remains the nexus for cross-border backbones entering via Marseille and Barcelona. Milan’s data-center density fuels local peering, drawing hyperscalers that prefer proximity to IXPs and fintech clusters. Rome follows as a sovereign cloud locus, serving ministries and defense-grade tenants; its metro area benefits from PNRR grants that underwrite dark-fiber extensions to government campuses.
Central regions such as Tuscany and Emilia-Romagna are cultivating sustainable campuses tapping geothermal and hydro-electric reservoirs. A geothermal-powered facility in Larderello exemplifies how green energy profiles differentiate site selection in the Italy data center networking market. GenAI research consortia linked to the Istituto Nazionale di Fisica Nucleare and regional universities further require multi-terabit research-and-education backbones.
The South remains less banked and less industrialized, yet PNRR allocations prioritize bridging the digital divide by 2026. FTTH deployments in Puglia and Campania, as well as submarine cable landings in Sicily, improve latency toward North-African and Middle-Eastern markets. Nine Italian metropolitan areas—from Bari to Trieste—were selected for the EU’s 100 climate-neutral cities program, spurring edge facilities that support smart-mobility platforms, surveillance networks and real-time environmental sensors. Each rollout extends the Italy data center networking market into provinces previously underserved by carrier-grade infrastructure.
Mordor Intelligence evaluates the data center networking market across all key regional markets, including Europe, Middle East, and Asia, with deeper country-level insights covering Norway, Netherlands, Saudi Arabia, Taiwan, Poland, and Switzerland.
Competitive Landscape
The Italy data center networking market balances traditional full-stack vendors against open-networking challengers. Cisco, Dell Technologies, and Hewlett-Packard Enterprise protect incumbent turf by bundling hardware, software, and lifecycle services; Cisco alone staffs more than 600 people locally and operates a Milan co-innovation hub focused on quantum-secure networking. Dell leverages its SONiC distribution to court cloud builders seeking white-box flexibility, while HPE’s 2025 acquisition of Juniper Networks positions the merged entity as a credible AI-fabric alternative to Cisco.
Juniper’s intent-based Apstra platform appeals to multivendor colocation operators needing uniform telemetry across Arista, Cisco and Broadcom-based boxes. Extreme Networks differentiates through a cloud-managed fabric that integrates Wi-Fi, switching and analytics, reporting USD 1.1 billion in FY 2024 revenue and ranking second worldwide in cloud networking ARR. Smaller Italian integrators such as Unidata emphasize Network-as-a-Service and IoT wholesale, aiming for double-digit growth by offloading capex from digitally underserved SMEs.
Open-source adoption tempers incumbent pricing power. ODM suppliers from Taiwan ship bare-metal boxes that run SONiC, Cumulus or in-house NOS images, shrinking procurement cycles. Simultaneously, ASIC shortages and tariff pressures push operators to multi-sourcing, amplifying demand for optical-component vendors capable of second-source guarantees. Cyberattack volumes that surged 65% in 2024 keep next-gen firewall and zero-trust gateway vendors relevant in every RFP, reinforcing a balanced yet intensely contested Italy data center networking market.
Italy Data Center Networking Industry Leaders
Cisco Systems Inc.
Juniper Networks Inc.
Arista Networks Inc.
Hewlett Packard Enterprise Company
Dell Technologies Inc.
- *Disclaimer: Major Players sorted in no particular order


Recent Industry Developments
- March 2025: Unidata posted 9% FY 2024 revenue growth to EUR 101.3 million and outlined a 12% CAGR plan through 2027, hinging on NaaS and IoT adoption
- January 2025: HPE finalized its USD 14 billion acquisition of Juniper Networks, combining Aruba, GreenLake and Mist AI portfolios
- November 2024: Telecom Italia accepted an EUR 18.8 billion bid for its NetCo fixed-line division, separating service and infrastructure arms
- October 2024: Italy’s National Cybersecurity Agency hosted Cybertech Europe 2024, spotlighting secure-by-design mandates for cloud infrastructure
- August 2024: Extreme Networks declared USD 1.1 billion FY 2024 sales, achieving 29% growth in SaaS recurring revenue


Research Methodology Framework and Report Scope
Market Definitions and Key Coverage
Our study defines the Italy data center networking market as the annual revenue generated from switches, routers, storage-area-network directors, security appliances, optical interconnects, software-defined networking controllers, and associated professional and managed services installed inside purpose-built commercial, colocation, hyperscale, and edge data centers operating within Italian territory.
Scope exclusion: equipment deployed in enterprise campus LANs, telecom service-provider core or access networks, and home routers is kept outside the remit.
Segmentation Overview
- By Component
- Products
- Ethernet Switches
- Routers
- Storage Area Network (SAN)
- Application Delivery Controllers (ADC)
- Network Security Appliances
- Software-Defined Networking (SDN) Controllers
- Optical Interconnects
- Services
- Installation and Integration
- Training and Consulting
- Support and Maintenance
- Managed Network Services
- Products
- By End-User
- IT and Telecommunications
- Banking, Financial Services and Insurance (BFSI)
- Government and Defense
- Media and Entertainment
- Healthcare and Life Sciences
- Manufacturing and Industrial
- Other End-Users
- By Data-Center Type
- Colocation
- Hyperscalers/Cloud Service Providers
- Edge/Micro Data Centers
- By Bandwidth
- Less Than equals to 10 GbE
- 25–40 GbE
- 50–100 GbE
- Greater than 100 GbE
Detailed Research Methodology and Data Validation
Primary Research
Conversations were held with hyperscale cloud operators, colocation builders around Milan and Rome, optical-fiber wholesalers, and independent network-design consultants. These discussions clarified live 100 G migration rates, average selling prices, and the timing of PNRR-funded new halls, allowing us to fine-tune assumed refresh intervals and services attachment rates.
Desk Research
We first mapped the total addressable installation base using freely available sources such as ISTAT's ICT usage surveys, Eurostat's data center floor-space series, AGCOM's network-traffic bulletins, the GSE renewable-power registry, and tender notices published on Tenders Info. Vendor 10-Ks, investor presentations, patent abstracts from Questel, and technical papers in IEEE Xplore then helped us benchmark typical port densities, spend ratios, and upgrade cycles. A cross-check with customs import codes (Volza) validated inbound shipments of 25 G, 100 G, and 400 G switches. The list above is illustrative, not exhaustive.
Market-Sizing & Forecasting
Top-down modeling begins with Italy's commissioned white-space inventory and average rack counts, which are then matched to port-per-rack norms and weighted ASPs to derive 2024 spending. Select bottom-up checks, supplier revenue roll-ups and channel surveys, are used to sense-check totals. Key variables tracked each year include: 1) newly delivered IT load (MW), 2) average east-west traffic per server, 3) 25 G/100 G port share, 4) edge facility count, 5) managed-service penetration. A multivariate regression on these drivers produces the 2025-2030 forecast; scenario analysis captures upside from AI fabrics or downside from deferred capex. Data gaps in supplier roll-ups are bridged through median ASP imputation based on disclosed contract values.
Data Validation & Update Cycle
Outputs pass three-layer analyst review, variance flags trigger re-verification with at least one source, and unusual deltas above +/-5 % prompt a call-back to respondents. Models refresh each year, with interim amendments after material events; a last-minute sense check is completed before publication.
Credibility Anchor: Why Mordor's Italy Data Center Networking Baseline Stands Out
Published estimates seldom align because publishers mix scopes, currencies, and refresh cadences.
Component coverage, inclusion of electrical gear, and the choice of traffic multipliers are the usual gap drivers.
Benchmark comparison
| Market Size | Anonymized source | Primary gap driver |
|---|---|---|
| USD 545.2 M (2025) | Mordor Intelligence | |
| EUR 750 M (2023) | Global Consultancy A | combines switching, cabling, and DC software; EUR basis without FX normalization |
| USD 3.13 B (2024) | Trade Journal B | values entire data-center investment, not just networking, inflating base figure |
The comparison shows that once like-for-like scope and currency are enforced, Mordor Intelligence delivers a balanced, traceable baseline rooted in clearly defined variables and an annual refresh discipline that decision-makers can rely upon.


Key Questions Answered in the Report
What is the current size of the Italy data center networking market?
The market is valued at USD 597.97 million in 2026 and is forecast to reach USD 948.96 million by 2031, reflecting a 9.68% CAGR.
Which component segment is growing fastest?
Services, including design, integration and managed NOC contracts, are projected to rise at 12.02% CAGR through 2031 as enterprises outsource scarce networking expertise.
Why is healthcare the fastest-expanding end-user vertical?
Telemedicine, PACS imaging and medical IoT projects funded under Italy’s National Recovery Plan require low-latency, high-bandwidth connections, driving a 13.12% CAGR for healthcare and life sciences.
How will >100 GbE adoption progress?
Bandwidths above 100 GbE are expected to grow at 13.96% CAGR, fueled by AI clusters such as Fastweb’s DGX SuperPOD and research networks upgrading to 400 G/800 G optics.
What regions within Italy attract the most data-center investment?
Lombardy (Milan), Lazio (Rome) and emerging green-energy zones in Tuscany are the front-runners, while Southern provinces gain momentum through PNRR-backed digital-divide programs.
Which factors could restrain market growth?
A persistent skills shortage, high capex for 400 G rollouts and energy-price volatility could shave more than 3% off compound growth if unaddressed.
Page last updated on:


