Croatia Container Glass Market Size and Share
Market Overview
| Study Period | 2020 - 2031 |
|---|---|
| Forecast Data Period | 2026 - 2031 |
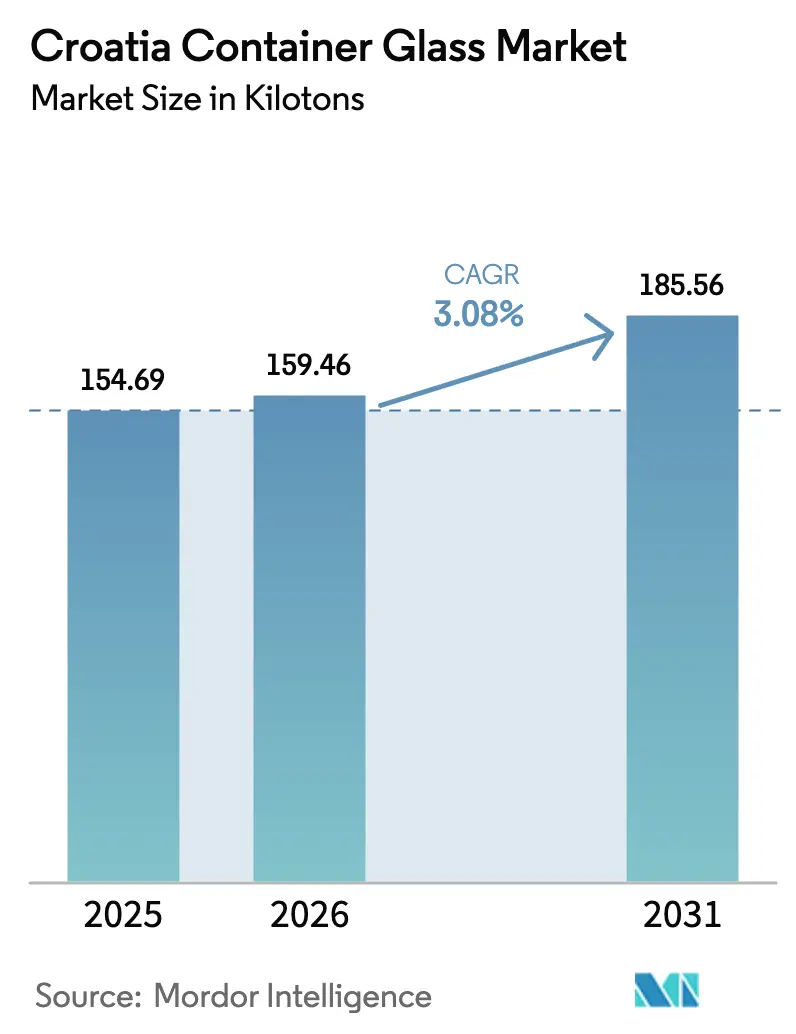
| Base Year Market Size (2025) | 154.69 kilotons |
| Market Volume (2026) | 159.46 kilotons |
| Market Volume (2031) | 185.56 kilotons |
| Growth Rate (2026 - 2031) | 3.08% CAGR |
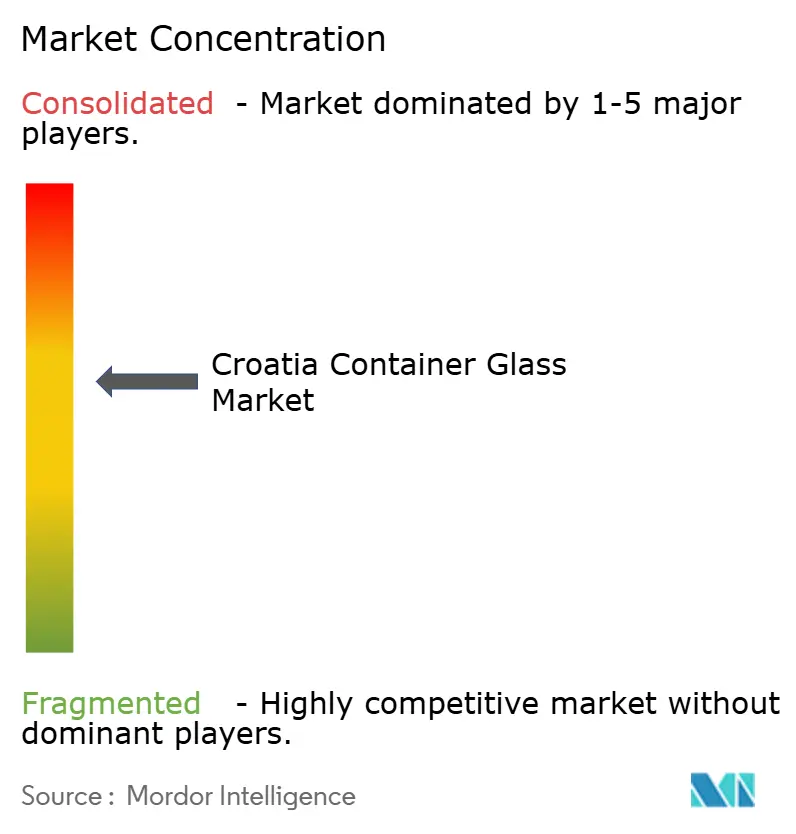
| Market Concentration | Medium |
Major Players.webp) *Disclaimer: Major Players sorted in no particular order Image © Mordor Intelligence. Reuse requires attribution under CC BY 4.0. | |
Croatia Container Glass Market Analysis by Mordor Intelligence
The Croatia container glass market size was valued at 154.69 kilotons in 2025 and estimated to grow from 159.46 kilotons in 2026 to reach 185.56 kilotons by 2031, at a CAGR of 3.08% during the forecast period (2026-2031). Croatia’s alignment with the European Union’s circular-economy rules, its deposit-refund system, and steadily rising tourism demand underpin the expansion. Producers are taking advantage of up to 90% cullet use in furnaces to lower their energy bills and carbon costs.[1]Vetropack, “Glass production,” vetropack.com Tourism accounts for approximately 25% of national output, resulting in strong seasonal sales peaks for beverage containers. The premiumization of local craft beverages, combined with growing consumer preference for eco-friendly packaging, is steering demand toward higher-value glass formats. Meanwhile, Croatia’s effective carbon price of EUR 59.81 per ton CO₂ (USD 65.79 per ton) is accelerating investment in energy-efficient melting technologies.
Key Report Takeaways
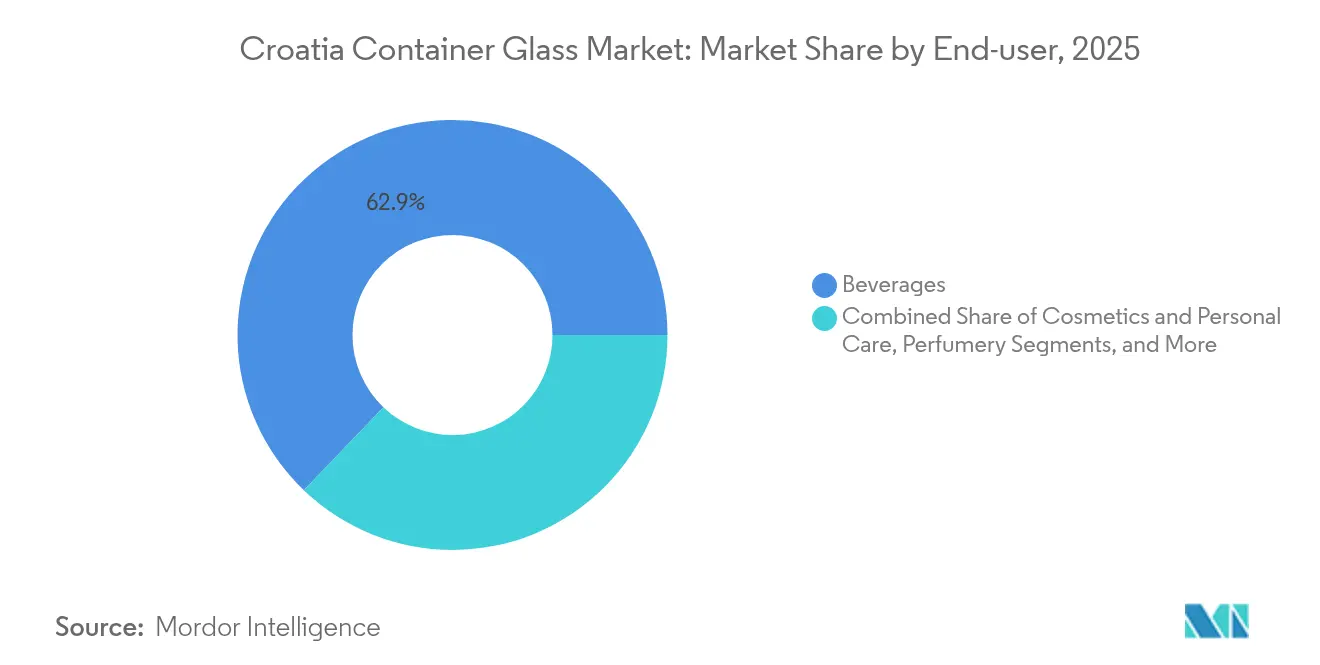
- By end user, beverages captured 62.85% of the Croatian container glass market share in 2025.
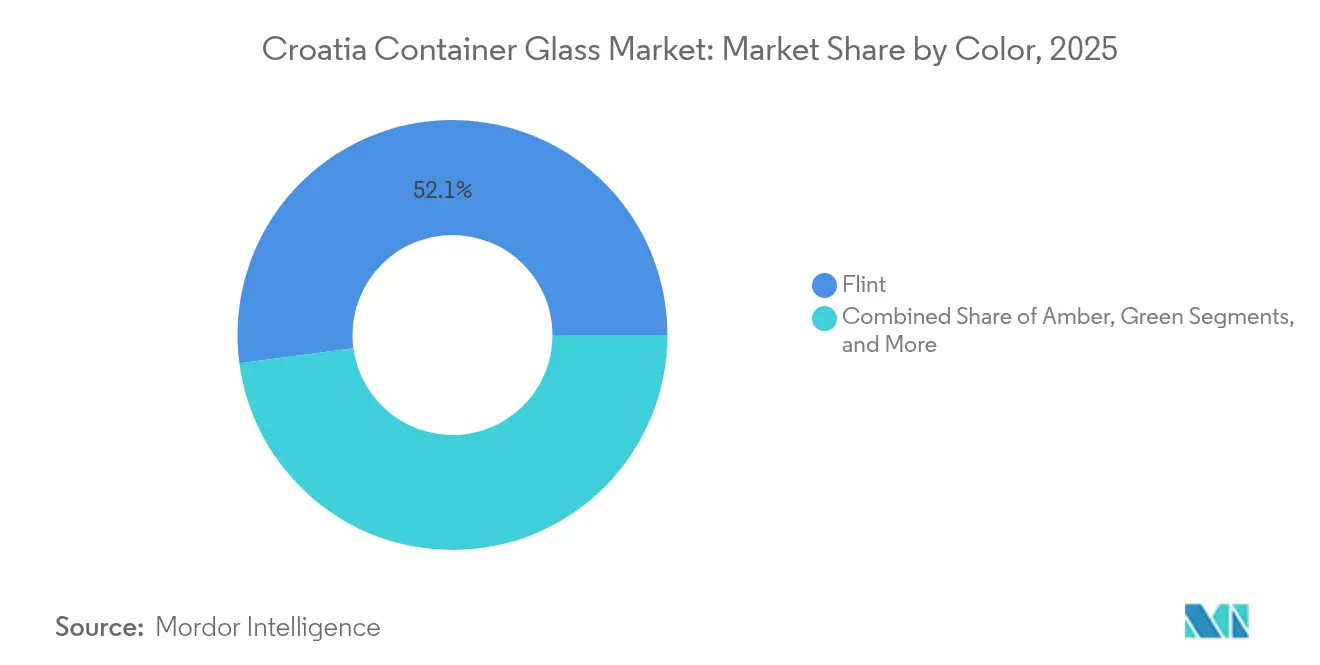
- By color, the Croatian container glass market size for the amber segment is projected to grow at a 4.02% CAGR between 2026-2031.
Note: Market size and forecast figures in this report are generated using Mordor Intelligence’s proprietary estimation framework, updated with the latest available data and insights as of 2026.
Croatia Container Glass Market Trends and Insights
Drivers Impact Analysis*
| Driver | (~) % Impact on CAGR Forecast | Geographic Relevance | Impact Timeline |
|---|---|---|---|
| Growing demand for eco-friendly products | +0.8% | National and wider EU | Medium term (2-4 years) |
| Surging demand from the food and beverage market | +0.9% | Coastal tourism hubs | Short term (≤ 2 years) |
| EU Single-Use Plastics Directive accelerating substitution | +0.6% | EU-wide | Long term (≥ 4 years) |
| Premiumization trend in craft beverages | +0.4% | Split-Dalmatia and Istria | Medium term (2-4 years) |
| Emerging cannabis-infused beverages packaging demand | +0.1% | EU regulatory-dependent | Long term (≥ 4 years) |
| Croatia tourism expansion is boosting on-premise glass packaging | +0.5% | Coastal regions | Short term (≤ 2 years) |
| Source: Mordor Intelligence | |||
Growing Demand for Eco-Friendly Products
Croatia’s deposit-refund fee rose to EUR 0.10 (USD 0.11) in January 2025, strengthening incentives to return bottles and boosting cullet supply.[2]Mark Thomas, “Croatia’s Bottle Refund Remains Lowest in EU Despite Increase,” thedubrovniktimes.com The system already achieves one of Europe’s highest return rates, enabling glassmakers to utilize up to 90% recycled feedstock and reduce furnace energy use by approximately 2-3% for every 10% increase in cullet, as demonstrated in VETROPACK. Environmental groups are pressing for even higher deposit fees, indicating that policy momentum will continue to favor glass. The Croatian container glass market benefits because glass is infinitely recyclable without quality loss, which aligns neatly with EU waste reduction goals. Producers that maximize cullet ratios also lower exposure to Croatia’s effective carbon tariff, improving cost competitiveness in export sales.
Surging Demand from the Food and Beverage Market
Wine output of 765,000 hectoliters per year, plus a lively craft-beer scene, drives 63.41% of container glass demand. Split-Dalmatia County alone lists 3,749 licensed family wineries, requiring small, premium bottle runs. Tourism receipts are rising back to pre-pandemic highs, prompting summer spikes that push producers to stockpile inventory well ahead of the peak season. Flexible manufacturing that can switch between bottle shapes and colors helps glass companies meet this volatile order pattern. The Croatian container glass market also gains volume from artisanal food products, such as olive oil and seafood preserves, which rely on transparent flint containers for their shelf appeal.
EU Single-Use Plastics Directive Accelerating Substitution
Croatia has fully transposed Directive 2019/904, banning many single-use plastic formats while exempting glass from the ban. The regulation mandates a 90% separate collection of beverage containers by 2029, aligning with Croatia’s deposit-refund network. Glass is exempt from the directive’s tethered-cap rules, thereby reducing compliance costs compared to plastic. Producers that maintain ISO 14001 certification can more easily satisfy new reporting obligations on recycled content, giving glass an additional credibility edge with brand owners. Planned EU reviews in 2027 could widen this advantage if additional caps-and-lids rules favor integrated glass solutions.
Premiumization Trend in Craft Beverages
Research shows that indigenous grape varieties in Istria can yield sparkling wines with pressures of 4.3-5.2 bar, requiring bottles with thicker walls. Craft breweries and distillers likewise seek distinctive shapes and embossing to differentiate on crowded tourist shelves. Social media marketing heightens the importance of package aesthetics, driving demand for colored glass and smaller, bespoke runs. Suppliers offering design support and low minimum orders are gaining market share in Croatia's container glass market. Because tourist demand peaks in summer, producers with agile warehousing and quick changeovers win repeat contracts from artisanal clients.
Restraints Impact Analysis*
| Restraint | (~) % Impact on CAGR Forecast | Geographic Relevance | Impact Timeline |
|---|---|---|---|
| Increasing adoption of glass alternatives | -0.7% | National | Medium term (2-4 years) |
| High energy costs and carbon taxes on furnace operations | -0.5% | Nationwide | Short term (≤ 2 years) |
| Limited domestic cullet supply stresses circularity targets | -0.3% | National | Medium term (2-4 years) |
| Skilled labor shortages in furnace maintenance | -0.4% | Manufacturing hubs | Long term (≥ 4 years) |
| Source: Mordor Intelligence | |||
High Energy Costs and Carbon Taxes on Furnace Operations
Natural-gas furnaces run at roughly 1,580 °C and account for up to 85% of a plant’s energy bill. Croatia’s EUR 59.81 (USD 65.79) per-ton effective carbon price raises operating costs, eroding margins compared to lower-priced imports.[3]Organisation for Economic Co-operation and Development, “Pricing Greenhouse Gas Emissions: Croatia,” oecd.org Full electrification would draw 3,026 kWh per ton, and current power tariffs make that option capital-intensive. Hybrid furnaces and oxy-fuel trials are underway but require fresh investment at a time when global glass supply is expanding.
Skilled Labor Shortages in Furnace Maintenance
Croatia has at least 30,000 unfilled industrial jobs, and technical furnace know-how is scarce. Continuous glass melting operations require seasoned operators; however, the average monthly pay of EUR 950 (USD 1,028) prompts migration to Austria and Germany. Employers must either pay higher wages or import skilled staff under the government’s annual foreign-worker quota. Training a new operator can take up to 12 months, creating a talent bottleneck that limits capacity growth in the Croatia container glass market.
*Our forecasts treat driver/restraint impacts as directional, not additive. The impact forecasts reflect baseline growth, mix effects, and variable interactions.
Segment Analysis
By End User: Beverage Dominance with Cosmetics Upside
The beverage segment accounts for 62.85% of Croatia's container glass market share, driven by 765,000 hectoliters of annual wine production and robust on-premise demand during the tourist season. Craft brewers and family wineries prefer small, premium bottle batches, helped by multi-gob lines that switch formats quickly. Cosmetics and personal care, although smaller in tonnage, are projected to grow at a 4.29% CAGR to 2031, adding value as Croatia integrates deeper into European luxury supply chains. Family-owned olive oil brands and gourmet spreads keep food applications resilient, while pharmaceutical demand benefits from Nipro’s 24,000 m² Zagreb facility certified under ISO 15378.
Tourist spending surges each summer, ballooning accommodation and food-service employment by 64% and lifting glass orders for beverages and condiments. Small producers, some making only 10,000 liters of wine annually, rely on suppliers that can hit minimum orders of roughly 13,300 bottles. That flexibility is shaping procurement strategies across the Croatia container glass market for beverage packaging. Meanwhile, cosmetics brands are launching limited-edition lines to test designs before scaling, so quick-turnaround bottle molds are in high demand.


By Color: Flint Prevalence and Amber Momentum
Flint maintained a 52.10% share of the Croatian container glass market in 2025, as transparency enhances shelf appeal for sauces, seafood, and high-end spirits. Pharmaceutical vials also specify flint for visual inspection of contents. Amber, however, is expected to log a 4.02% CAGR to 2031 as more craft brewers and distillers seek light-blocking protection for premium SKUs. Pharmaceutical lines at Piramida and Nipro need amber for UV-sensitive formulations, reinforcing growth. Green glass is primarily used for still-wine bottling, especially indigenous whites from Istria, whereas sparkling-wine producers often shift to heavier flint bottles to withstand 5 bar internal pressure.
Color choice is also a brand-identity lever. Craft producers experiment with limited-run hues to stand out in tourist gift shops, driving small but profitable orders for specialty colors. Standardized cullet streams favor flint; however, amber glass’s growth indicates a rising willingness to pay for added product protection. This trend highlights the premiumization pathway that is shaping demand in the Croatian container glass market.
Geography Analysis
Domestic glass capacity is concentrated around Vetropack’s Hum na Sutli plant in northern Croatia, providing efficient access to inland raw materials and proximity to nearby EU customers. The facility’s multi-gob lines enable the parallel production of varied shapes, supporting fragmented local demand while also exporting to Slovenia and Hungary. Zagreb hosts specialized pharmaceutical production at Nipro’s ISO 15378 plant, anchoring a small but high-margin niche.
Along the Adriatic coast, tourism drives seasonal hot spots. Accommodation and food-service employment rises 64% in summer, triggering sudden spikes in container demand that test haulage capacity from inland plants. Import flows backfill shortfalls; Croatia recorded EUR 60.66 million (USD 65.64 million) in non-metallic mineral imports in January 2025, representing a 2.4% year-over-year increase. The Croatia container glass market, therefore, depends on synchronized logistics that can reposition inventory from inland warehouses to coastal distributors within tight lead times.
Future manufacturing expansion could move eastward toward Slavonia, where lower labor costs and proximity to sand deposits offer savings. Government blue-economy plans also promote coastal value-added packaging for seafood and olive oil, suggesting that small satellite plants with modular furnaces may emerge near ports. EU single-market access ensures common standards, allowing Croatian producers to serve nearby Italy and Slovenia without tariff barriers, thereby supporting export diversification for the Croatian container glass market.
Competitive Landscape
The market shows moderate concentration. Vetropack’s Croatian site meets both domestic needs and regional exports, utilizing up to 90% cullet to reduce melt energy. Its Echovai lightweight returnable bottles cut weight by 30%, appealing to beverage clients seeking carbon reduction. Pharmaceutical specialists Piramida and Nipro focus on vials and ampoules under stringent ISO 15378 guidelines, carving out high-margin niches. Together, the top five players control roughly 65% of national output, with the remainder held by importers and small decorators.
Technology investment differentiates leaders. Vetropack is trialling hybrid furnaces, while Western European rivals, such as Verallia, commissioned a 100% electric furnace in France in 2024. Croatian firms must weigh similar upgrades to offset carbon taxes. Niche suppliers gain market share by offering design services and low minimum orders, which aligns with Croatia’s fragmented craft segment. Consolidation is limited, but cross-border deals, such as Verallia’s acquisition of an Italian company for EUR 230 million (USD 253 million), alter regional supply patterns.
Cullet procurement and skilled labor remain common pain points. Companies that secure steady streams of recycled glass and invest in staff retention preserve uptime advantages. Logistical agility, particularly the ability to pre-stage inventory for coastal peaks, strengthens customer loyalty. These dynamics collectively shape competitive positioning within the Croatia container glass market.
Croatia Container Glass Industry Leaders
Vetropack Holding Ltd
Nipro Europe Group Companies
Colorlites Limited
GRO-PROM d.o.o
DWK Life Sciences GmbH
- *Disclaimer: Major Players sorted in no particular order

Recent Industry Developments
- August 2025: Ciner Glass secured EUR 504 million (USD 554.4 million) in funding to build a 1,300 tons-per-day plant in Belgium, thereby enlarging the European supply.
- January 2025: Croatia increased the bottle-deposit refund to EUR 0.10 (USD 0.11), still the EU’s lowest, but a step toward higher collection targets.
- October 2024: O-I Glass announced plans to close at least 7% of global capacity by mid-2025 under its cost-saving program.
- October 2024: FEVE called for faster access to low-carbon energy in the container glass sector.


Croatia Container Glass Market Report Scope
Glass containers are vessels made from glass used to store and protect products such as food, beverages, pharmaceuticals, cosmetics, and chemicals. Available in diverse shapes and sizes, such as bottles, jars, and vials, these containers provide airtight seals and protect contents from external contaminants. Glass packaging is valued for its non-reactive nature, preservation of product quality, and high recyclability. These attributes make glass containers a preferred choice for packaging across multiple industries.
The Croatia container glass market is segmented by end-user vertical (beverages [alcoholic beverages (beer, wine, spirits, and other alcoholic beverages {cider and other fermented drinks}), non-alcoholic beverages (juices, carbonated drinks (CSDs), dairy product-based drinks, other non-alcoholic beverages)], food [jam, jelly, marmalades, honey, sausages and condiments, oil, pickles], cosmetics and personal care, pharmaceuticals (excluding vials and ampoules), and perfumery, and by color (green, amber, flint and other colors). The report offers market forecasts and size in volume (kilotons) for all the above segments.
| Beverages | Alcoholic | Beer |
| Wine | ||
| Spirits | ||
| Other Alcoholic Beverages (Cider and Other Fermented Drinks) | ||
| Non-Alcoholic | Juices | |
| Carbonated Drinks (CSDs) | ||
| Dairy Product Based Drinks | ||
| Other Non-Alcoholic Beverages | ||
| Food (Jam, Jelly, Marmalades, Honey, Sausages and Condiments, Oil, Pickles) | ||
| Cosmetics and Personal Care | ||
| Pharmaceuticals (excluding Vials and Ampoules) | ||
| Perfumery | ||
| Green |
| Amber |
| Flint |
| Other Colors |
| By End-user | Beverages | Alcoholic | Beer |
| Wine | |||
| Spirits | |||
| Other Alcoholic Beverages (Cider and Other Fermented Drinks) | |||
| Non-Alcoholic | Juices | ||
| Carbonated Drinks (CSDs) | |||
| Dairy Product Based Drinks | |||
| Other Non-Alcoholic Beverages | |||
| Food (Jam, Jelly, Marmalades, Honey, Sausages and Condiments, Oil, Pickles) | |||
| Cosmetics and Personal Care | |||
| Pharmaceuticals (excluding Vials and Ampoules) | |||
| Perfumery | |||
| By Color | Green | ||
| Amber | |||
| Flint | |||
| Other Colors | |||


Key Questions Answered in the Report
What is the size of the Croatian container glass market in 2026?
The market is expected to amount to 159.46 kilotons in 2026 and is projected to reach 185.56 kilotons by 2031.
Which end-user segment holds the biggest share?
Beverages lead with 62.85% share in 2025, thanks to tourism-driven consumption and strong wine output.
What is the fastest-growing application?
Cosmetics and personal care packaging are forecast to expand at a 4.29% CAGR through 2031.
Why is amber glass demand rising?
Craft beverage premiumization and pharmaceutical light-sensitivity requirements are driving demand for amber glass at a 4.02% CAGR.
How does Croatia’s deposit-refund system affect the market?
The EUR 0.10 (USD 0.10) refund promotes high return rates, supplying cullet that lowers furnace energy needs and supports EU recycling targets.
What challenges do local producers face?
High energy costs, carbon taxes, and skilled-labor shortages increase production expenses and limit capacity growth.
Page last updated on:


