Saudi Arabia Container Glass Market Size and Share
Market Overview
| Study Period | 2020 - 2031 |
|---|---|
| Forecast Data Period | 2026 - 2031 |
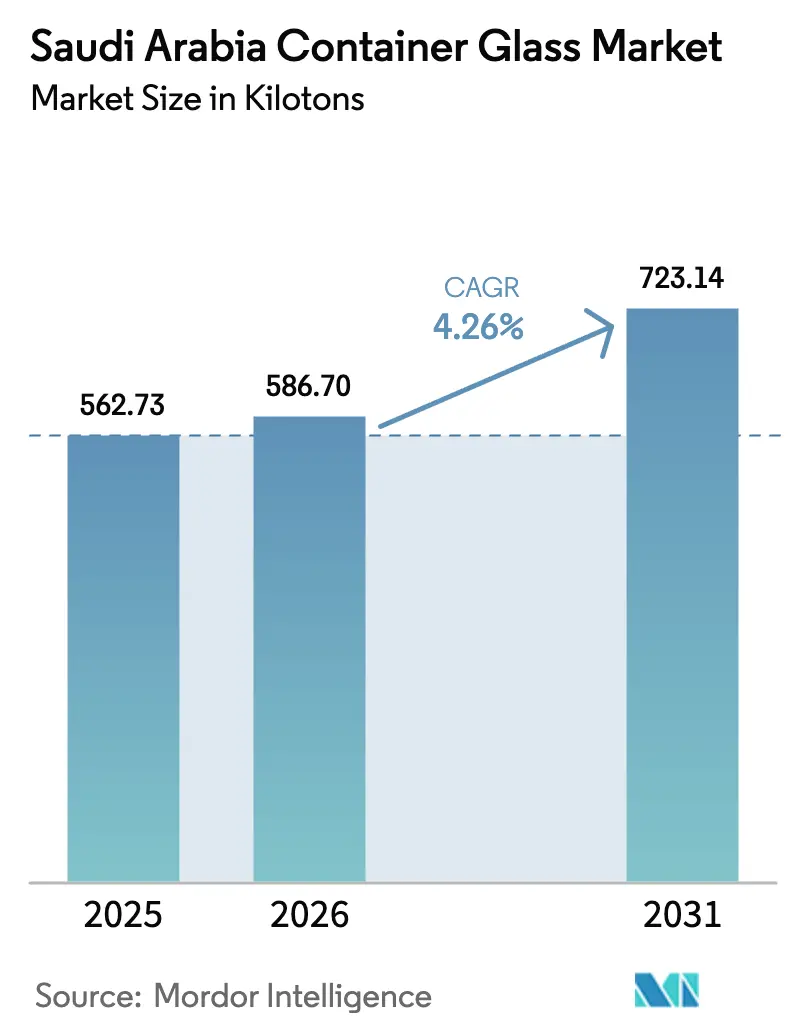
| Base Year Market Size (2025) | 562.73 kilotons |
| Market Volume (2026) | 586.7 kilotons |
| Market Volume (2031) | 723.14 kilotons |
| Growth Rate (2026 - 2031) | 4.26% CAGR |
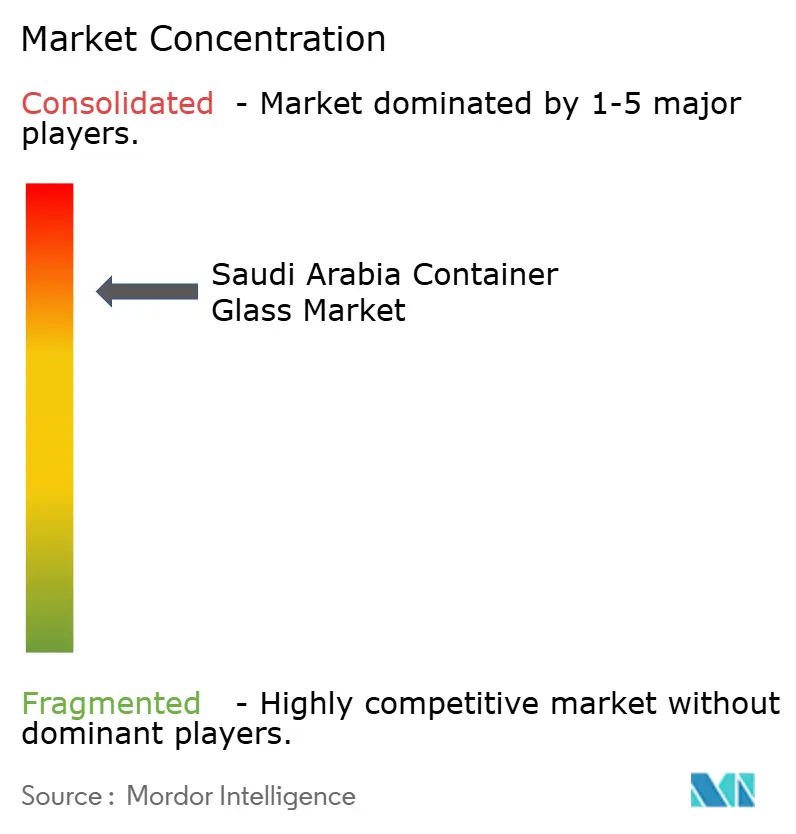
| Market Concentration | High |
Major Players *Disclaimer: Major Players sorted in no particular order Image © Mordor Intelligence. Reuse requires attribution under CC BY 4.0. | |
Saudi Arabia Container Glass Market Analysis by Mordor Intelligence
The Saudi Arabia container glass market size is expected to grow from 562.73 kilotons in 2025 to 586.7 kilotons in 2026 and is forecast to reach 723.14 kilotons by 2031 at 4.26% CAGR over 2026-2031. The expansion is anchored in Vision 2030 incentives that promote industrial localization, steady growth of food-and-beverage processing capacity, and rising consumer preference for premium, sustainable packaging.[1]Ministry of Industry and Mineral Resources, “Kingdom's industrial transformation driven by Vision 2030,” MIM.GOV.SA Domestic producers have responded with furnace upgrades and automation that offset higher dual-fuel tariffs introduced in 2024. Import substitution continues to accelerate because newly commissioned soda-ash capacity and improved logistics reduce exposure to international supply shocks. Although lightweight plastic containers remain a cost challenge, mounting circular economy targets and brand-driven premiumization keep glass volumes on an upward trajectory.
Key Report Takeaways
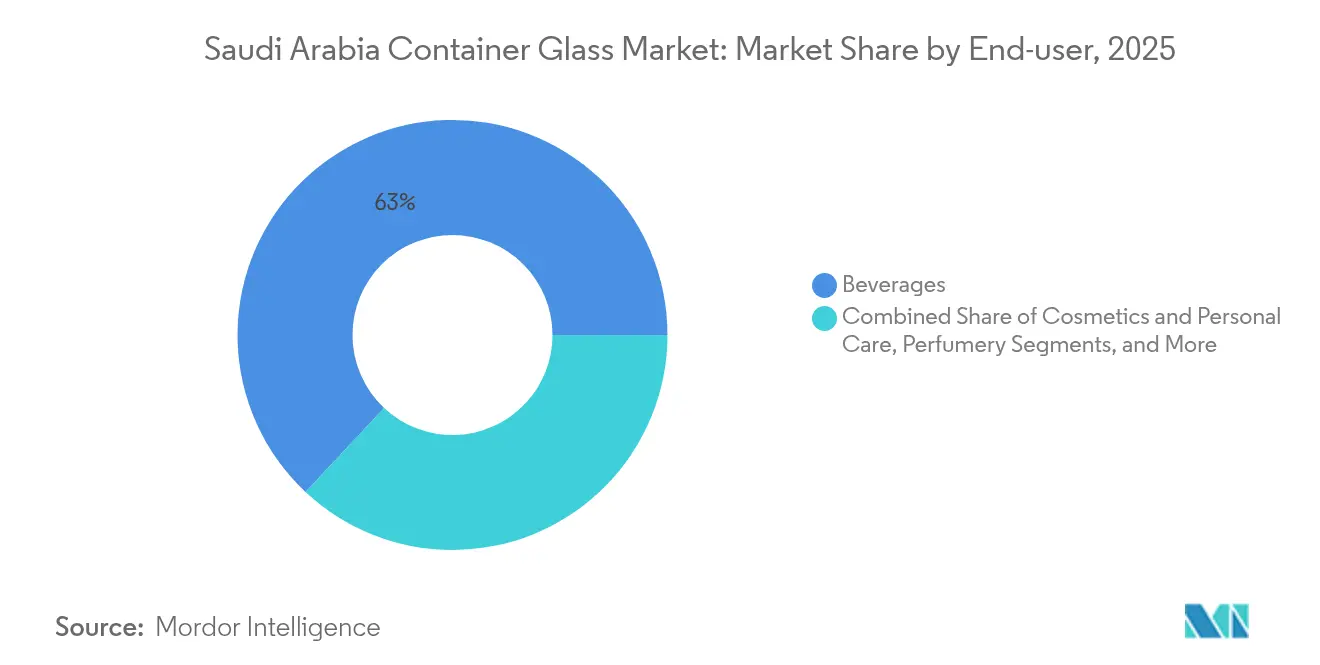
- By end-user, beverages captured 63.02% of the Saudi Arabia container glass market share in 2025.
- By color, the Saudi Arabia container glass market for amber glass is projected to grow at a 5.55% CAGR between 2026-2031.
Note: Market size and forecast figures in this report are generated using Mordor Intelligence’s proprietary estimation framework, updated with the latest available data and insights as of 2026.
Saudi Arabia Container Glass Market Trends and Insights
Drivers Impact Analysis*
| Driver | (~) % Impact on CAGR Forecast | Geographic Relevance | Impact Timeline |
|---|---|---|---|
| Robust growth of Saudi food and beverage processing | +1.2% | National, with concentration in Riyadh, Jeddah, Dammam industrial clusters | Medium term (2-4 years) |
| Product innovation and premiumisation in packaging | +0.8% | National, with premium segments in major urban centers | Long term (≥ 4 years) |
| Vision-2030 localisation incentives for glass makers | +1.0% | National, focused on industrial cities and free zones | Medium term (2-4 years) |
| Dual-fuel tariff reforms lowering furnace energy cost | +0.6% | National, benefiting existing glass manufacturing hubs | Short term (≤ 2 years) |
| Adoption of smart-packaging automation lines | +0.4% | National, concentrated in modern industrial facilities | Long term (≥ 4 years) |
| Circular-economy targets boosting cullet availability | +0.3% | National, with early implementation in major cities | Long term (≥ 4 years) |
| Source: Mordor Intelligence | |||
Robust Growth of Saudi Food and Beverage Processing
Saudi Arabia aims to target 36,000 factories by 2035, with food clusters, such as the Jeddah hub, already occupying 11 million square meters and hosting 75 plants. The Al-Kharj dairy cluster supplies 70% of national dairy output, ensuring year-round demand for glass bottles. Increased soft-drink exports to GCC neighbors require consistent packaging sourced locally to sidestep import delays. Every new plant under the National Industrial Strategy embeds long-term offtake agreements with container-glass producers. This multiplier effect sustains demand growth that exceeds overall GDP gains.
Product Innovation and Premiumisation in Packaging
Luxury and mass-premium brands specify glass for perceived quality, extended shelf life, and design flexibility. Digital printing, custom embossing, and smart packaging features, such as QR codes and RFID tags, enhance unit values and margins. Cosmetics’ 5.16% CAGR reflects this premium focus, particularly in Riyadh and Jeddah beauty retail corridors. Premiumization also spills into craft beverages, specialty condiments, and nutraceuticals, all of which rely on glass to reinforce brand positioning.
Vision 2030 Localization Incentives for Glass Makers
The Standard Incentives Program refunds up to 35% of qualifying capital outlays and caps support at SAR 50 million per project, sharply improving investment returns for furnace rebuilds and new color lines. Preferential procurement rules in megaprojects, such as NEOM, guarantee a baseline demand for locally produced containers. Technology transfer agreements, exemplified by the Sidel MoU in 2025, accelerate the adoption of energy-efficient forming machines and inspection systems. The combined effect is faster capacity expansion and lower reliance on imported packaging.[2]Packaging Insights, “Sidel and Saudi Arabia partner for local F&B packaging production,” PACKAGINGINSIGHTS.COM
Dual-Fuel Tariff Reforms Lowering Furnace Energy Cost
In January 2024, tariff adjustments lifted energy expenses by 9-10% for high-temperature industries. Container-glass plants equipped with dual-fuel burners can now switch between natural gas and refined fuels based on spot prices, buffering margin erosion. Domestic soda-ash output from InoChem trims raw-material import bills. These cost offsets, combined with rooftop solar and waste-heat recovery projects, position technologically advanced furnaces to capitalize on future demand.
Restraints Impact Analysis*
| Restraint | (~) % Impact on CAGR Forecast | Geographic Relevance | Impact Timeline |
|---|---|---|---|
| High production and logistic cost versus plastics/metal | -0.9% | National, with higher impact in remote regions | Short term (≤ 2 years) |
| Lightweight-packaging substitution threat | -0.7% | National, concentrated in beverage and food segments | Medium term (2-4 years) |
| Weak post-consumer glass-collection infrastructure | -0.5% | National, with acute challenges in smaller cities | Long term (≥ 4 years) |
| Shortage of skilled furnace technicians | -0.4% | National, particularly affecting expansion projects | Medium term (2-4 years) |
| Source: Mordor Intelligence | |||
High Production and Logistic Cost Versus Plastics/Metal
Furnaces operate at temperatures above 1,500 °C and account for the bulk of operating costs. Glass containers weigh three to five times more than plastic alternatives, thereby increasing freight bills in a country that spans 2.1 million square kilometers. January 2024 fuel-price increases amplified this disparity, prompting beverage fillers in remote regions to test lightweight PET solutions. Nevertheless, soda-ash localization, combined with higher cullet ratios, can reduce melting energy by up to 25%, thereby narrowing the gap over time.
Weak Post-Consumer Glass-Collection Infrastructure
Recycling rates remain below 15%, with most glass being sent to landfills. The Saudi Investment Recycling Company aims for an 81% diversion rate by 2035; however, material-recovery facilities and source-separation programs remain scarce outside major metropolitan areas. Contamination in mixed waste streams raises cullet rejection rates, forcing manufacturers to rely on virgin raw materials. Without reliable cullet flows, achieving energy and carbon-reduction targets becomes more challenging, thereby dampening cost competitiveness.
*Our forecasts treat driver/restraint impacts as directional, not additive. The impact forecasts reflect baseline growth, mix effects, and variable interactions.
Segment Analysis
By End-user: Beverages Retain Scale While Cosmetics Accelerate
In 2025, beverages accounted for 63.02% of the Saudi Arabian container glass market size, supported by soft drink plants that supply GCC wholesalers. Food applications hold second position, driven by fast-growing condiment and dairy lines under new industrial-city projects. Pharmaceuticals maintain a steady demand for chemically inert bottles. Perfumery remains a niche market in terms of volume yet delivers strong margins.
Cosmetics and personal care represent the fastest-growing segment, with a 4.98% CAGR through 2031. Rising disposable incomes and tourism sharpen the appetite for premium beauty brands, many of which mandate glass for product integrity and aesthetics. Smart closures that integrate RFID tags enhance anti-counterfeiting safeguards, creating higher unit-value opportunities for domestic converters. Saudi Food and Drug Authority guidelines also endorse glass for products requiring a long shelf life, adding regulatory momentum.


By Color: Flint Dominant, Amber Ascendant
Flint glass held a 58.66% market share in the Saudi Arabian container glass market in 2025, due to its clarity and versatility in applications such as carbonated beverages, sauces, and cosmetics. Green glass occupies smaller niches in premium beer and olive oil packaging. Amber glass is expected to grow at a 5.55% CAGR through 2031, driven by the need for robust UV protection in pharmaceuticals and premium beverages.
The rise of craft sodas and gourmet coffee concentrates further strengthens demand. Advances in coating and embossing technologies now enable amber containers to feature intricate branding without compromising their light-barrier properties. Saudi Standards Organization regulations that emphasize product protection promote the adoption of amber in health-sensitive applications.

Geography Analysis
Eastern Province factories near Jubail and Dammam benefit from abundant petrochemical feedstocks and port access, which streamline soda-ash and cullet imports, as well as bottle exports. Riyadh and Jeddah account for almost 35% of domestic demand due to dense consumer populations and clustered food-processing facilities.
Saudi Arabia exported USD 68 million of float glass in 2023, primarily to Jordan, the UAE, and Egypt, highlighting the established trade corridors that container-glass producers can leverage. The upcoming Land Bridge rail project will reduce cross-country transit times by 50%, resulting in lower backhaul costs for bottle shipments to western ports.
The Western Region around Yanbu offers Red Sea access to African markets, while NEOM’s construction schedule creates future premium packaging demand. Localization policies ensure that compliant domestic suppliers have priority in public procurement, shielding them from low-priced imports and enabling them to achieve economies of scale.
Competitive Landscape
Three domestic players dominate the market, producing an oligopolistic structure that still invites rivalry through technological and service differentiation. The National Company for Glass Industries (Zoujaj) operates plants in Riyadh and Dammam and is adding a sixth line with a capacity of 25,000 tpa, which is expected to start up in 2027. Saudi Arabian Glass Company (SAGCO) deploys Vertech digital controls in Jeddah to raise yield and lower defect rates. Obeikan Glass, while focused on flat glass, signed an MoU with Isoclima to explore container entries that could diversify its product mix.[3]MarkLines, “Al-Obeikan Glass and Isoclima sign MoU,” MARKLINES.COM
Technology upgrades dominate investment themes. Zoujaj’s furnace rebuild will increase the daily pull from 210 t to 280 t at a cost of SAR 58.5 million, delivering higher throughput with lower energy consumption per ton. Automation systems that integrate hot-end cameras and cold-end inspection improve efficiency and support the traceability demanded by export clients.
Potential new entrants include Xinyi Group, which is assessing a fully integrated Saudi complex. Government incentives and fast-track licensing make greenfield projects viable, yet compliance with SASO quality marks creates a non-price barrier that favors incumbents with established audit trails.
Saudi Arabia Container Glass Industry Leaders
Saudi Arabian Glass Company Ltd.
Feemio Group Co., Ltd.
National Company for Glass Industries SJSC
Al Obeikan Glass Company
Hotpack Packaging Industries LLC
- *Disclaimer: Major Players sorted in no particular order

Recent Industry Developments
- June 2025: National Company for Glass Industries confirmed a sixth container-glass line with 25,000 tpa capacity.
- April 2025: Zoujaj board approved a furnace rebuild in Riyadh, raising pull rate to 280 tpd with SAR 58.5 million investment, targeting Q1 2027 start-up.
- March 2025: Zoujaj reported SAR 96.8 million profit for 2024, up 102%, fueled by flat-glass affiliate dividends.
- January 2025: The Saudi government has launched the SAR 10 billion Standard Incentives Program, which covers the glass manufacturing sector.


Saudi Arabia Container Glass Market Report Scope
Container glass is designed for crafting glass containers, including bottles, jars, drinkware, and bowls. Its key attributes include chemical inertness, sterility, and non-permeability, rendering it especially sought after in the beverage, food, pharmaceutical, and cosmetic sectors. The research also examines underlying growth influencers and significant industry vendors, all of which help to support market estimates and growth rates throughout the anticipated period. The market estimates and projections are based on the base year factors and arrived at top-down and bottom-up approaches.
Saudi Arabia container glass market is segmented by end-user vertical (beverages [alcoholic beverages (beer, wine, spirits, and other alcoholic beverages {cider and other fermented drinks}), non-alcoholic beverages (juices, carbonated drinks (CSDs), dairy product-based drinks, other non-alcoholic beverages)], food [jam, jelly, marmalades, honey, sausages and condiments, oil, pickles], cosmetics and personal care, pharmaceuticals (excluding vials and ampoules), and perfumery), by color (green, amber, flint and other colors). The report offers market forecasts and size in volume (kilotons) for all the above segments.
| Beverages | Alcoholic | Beer |
| Wine | ||
| Spirits | ||
| Other Alcoholic Beverages (Cider and Other Fermented Drinks) | ||
| Non-Alcoholic | Juices | |
| Carbonated Drinks (CSDs) | ||
| Dairy Product Based Drinks | ||
| Other Non-Alcoholic Beverages | ||
| Food (Jam, Jelly, Marmalades, Honey, Sausages and Condiments, Oil, Pickles) | ||
| Cosmetics and Personal Care | ||
| Pharmaceuticals (excluding Vials and Ampoules) | ||
| Perfumery | ||
| Green |
| Amber |
| Flint |
| Other Colors |
| By End-user | Beverages | Alcoholic | Beer |
| Wine | |||
| Spirits | |||
| Other Alcoholic Beverages (Cider and Other Fermented Drinks) | |||
| Non-Alcoholic | Juices | ||
| Carbonated Drinks (CSDs) | |||
| Dairy Product Based Drinks | |||
| Other Non-Alcoholic Beverages | |||
| Food (Jam, Jelly, Marmalades, Honey, Sausages and Condiments, Oil, Pickles) | |||
| Cosmetics and Personal Care | |||
| Pharmaceuticals (excluding Vials and Ampoules) | |||
| Perfumery | |||
| By Color | Green | ||
| Amber | |||
| Flint | |||
| Other Colors | |||


Key Questions Answered in the Report
How large will container-glass demand in Saudi Arabia be by 2031?
Volumes are projected to reach 723.14 kilotons by 2031, up from 586.7 kilotons in 2026.
Which application captures the biggest share of glass packaging?
Carbonated and non-carbonated beverages account for 63.02% of demand and anchor long-term volume stability.
What segment is growing the fastest?
Cosmetics and personal-care containers are expanding at a 4.98% CAGR due to premium-product launches and brand differentiation.
Why is amber glass gaining popularity?
Pharmaceuticals and craft beverages need UV protection, driving amber’s 5.55% CAGR through 2031.
How is Vision 2030 shaping the glass supply chain?
Incentives covering up to 35% of capital spend, plus preferential procurement, push manufacturers to add capacity and localize inputs.
What challenges limit higher recycling rates?
Limited collection infrastructure and contaminated waste streams keep glass-recycling rates below 15%, restricting cullet availability.
Page last updated on:


