Ion Chromatography Market Size and Share
Market Overview
| Study Period | 2020 - 2031 |
|---|---|
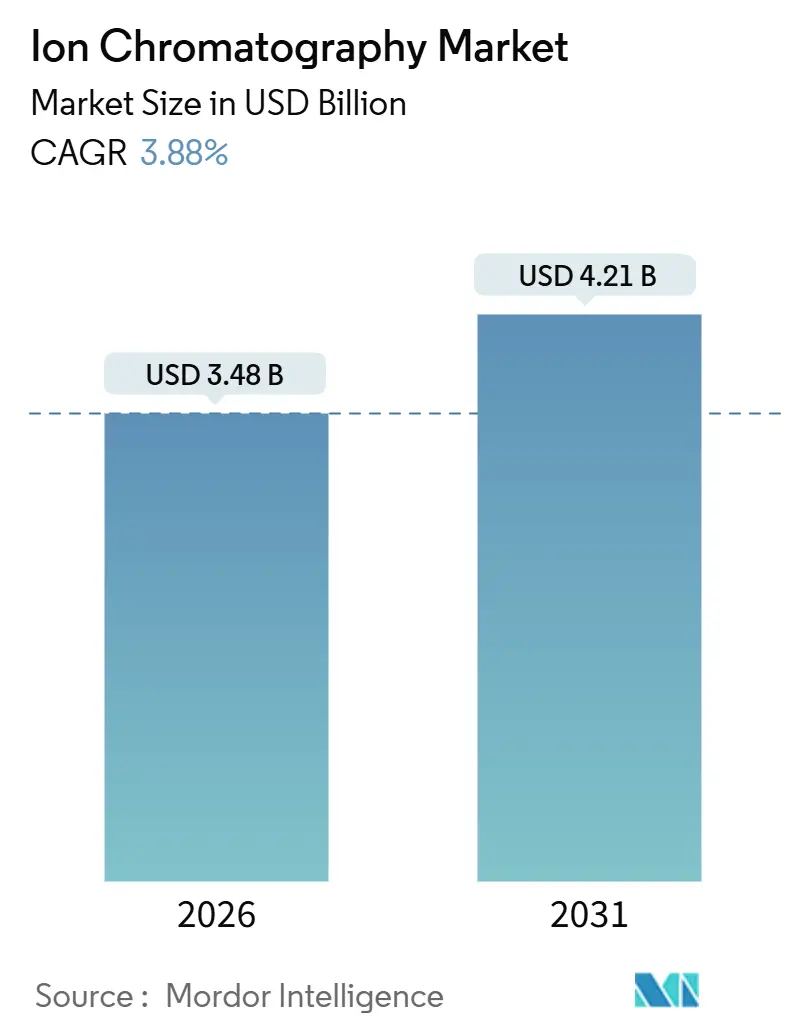
| Market Size (2026) | USD 3.48 Billion |
| Market Size (2031) | USD 4.21 Billion |
| Growth Rate (2026 - 2031) | 3.88% CAGR |
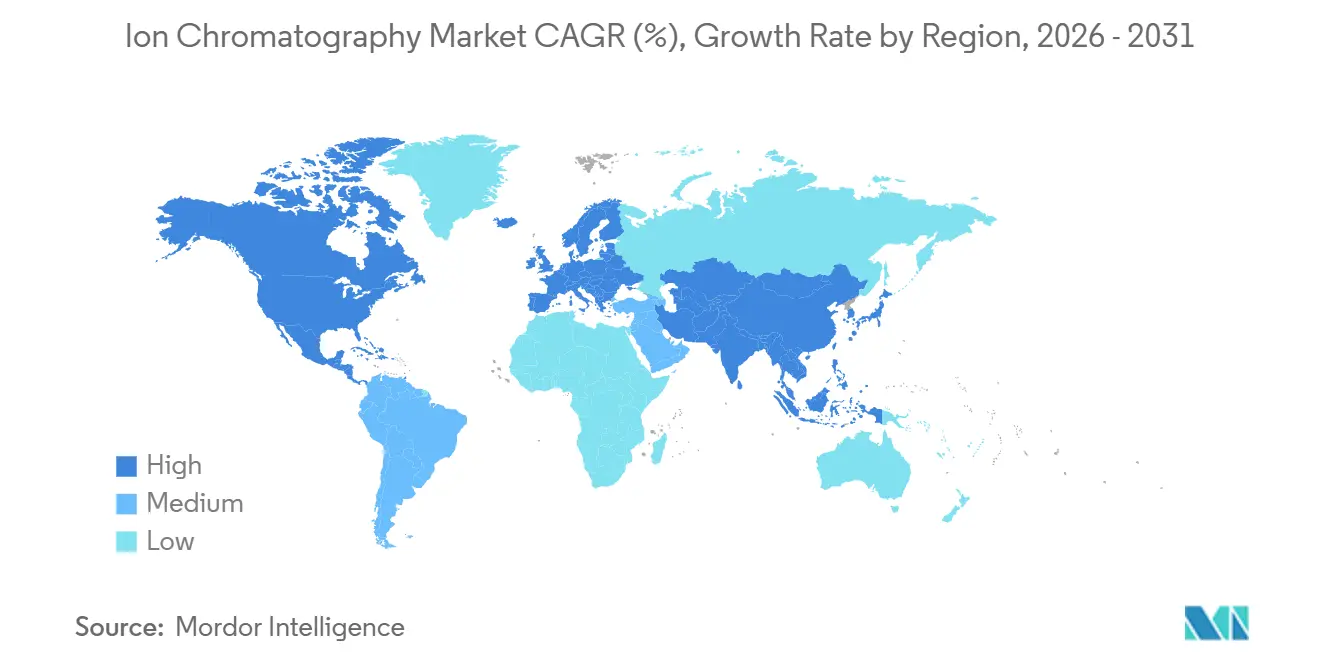
| Fastest Growing Market | Asia Pacific |
| Largest Market | North America |
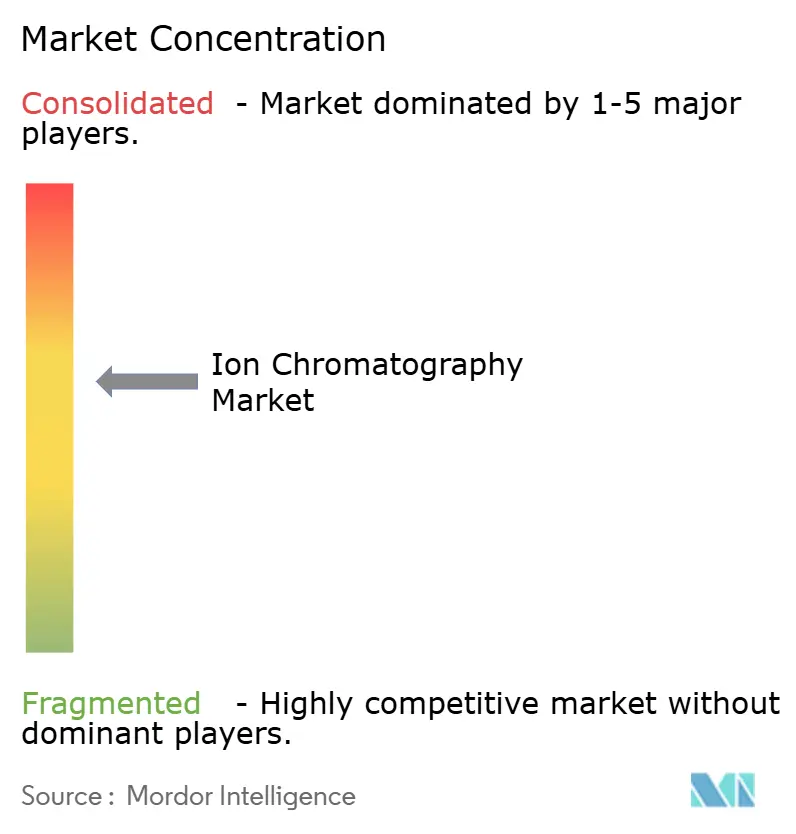
| Market Concentration | Medium |
Major Players *Disclaimer: Major Players sorted in no particular order Image © Mordor Intelligence. Reuse requires attribution under CC BY 4.0. | |
Ion Chromatography Market Analysis by Mordor Intelligence
The Ion Chromatography Market size is estimated at USD 3.48 billion in 2026, and is expected to reach USD 4.21 billion by 2031, at a CAGR of 3.88% during the forecast period (2026-2031).
Regulatory mandates on per- and polyfluoroalkyl substances (PFAS) in water, tighter pharmaceutical excipient limits, and battery-grade electrolyte quality protocols have shifted ion chromatography from an optional analytical method to a compliance requirement. At the same time, lithium-ion gigafactories rely on sub-parts-per-billion anion monitoring that inductively coupled plasma mass spectrometry cannot address, opening a profitable niche that supports premium pricing. Vendors are countering lengthening replacement cycles by bundling predictive-maintenance contracts, cloud software, and AI method optimization to stabilize cash flow and offset hardware price pressure.
Key Report Takeaways
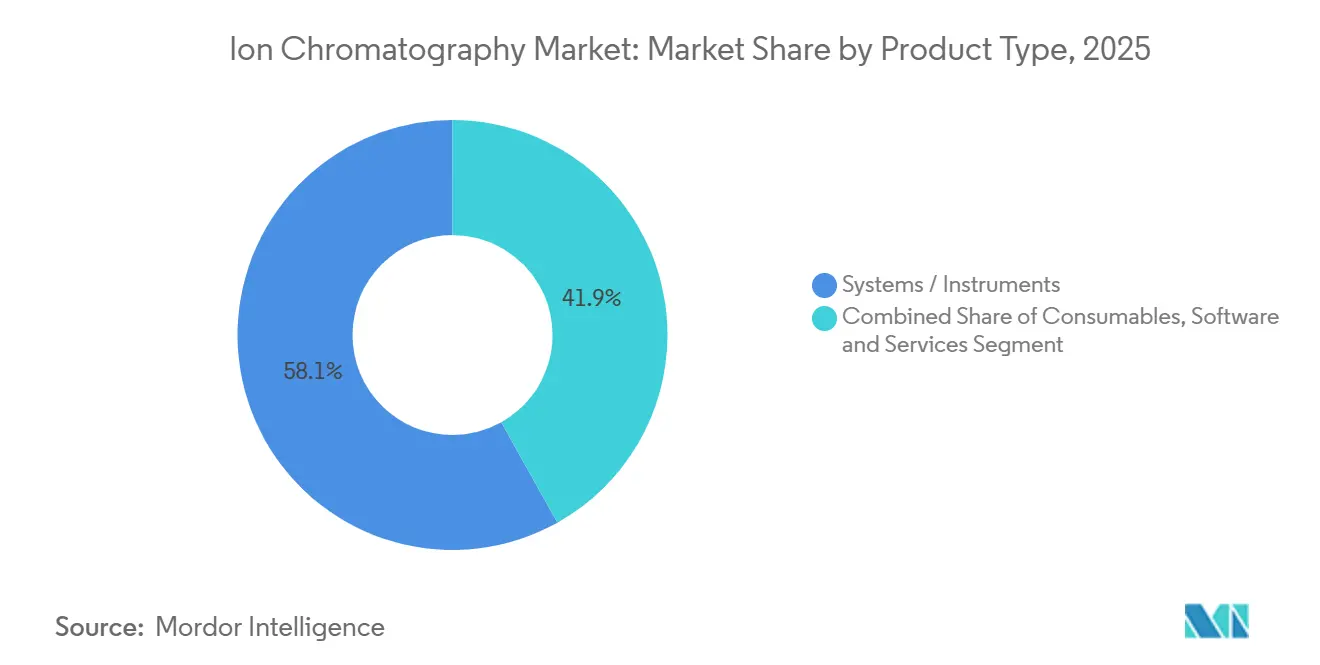
- By product type, systems and instruments led with 58.11% revenue share in 2025, while consumables are set to expand at a 5.81% CAGR through 2031.
- By chromatography technique, ion-exchange held 48.86% of the ion chromatography market share in 2025, whereas ion-pair methods are forecast to grow at a 6.19% CAGR to 2031.
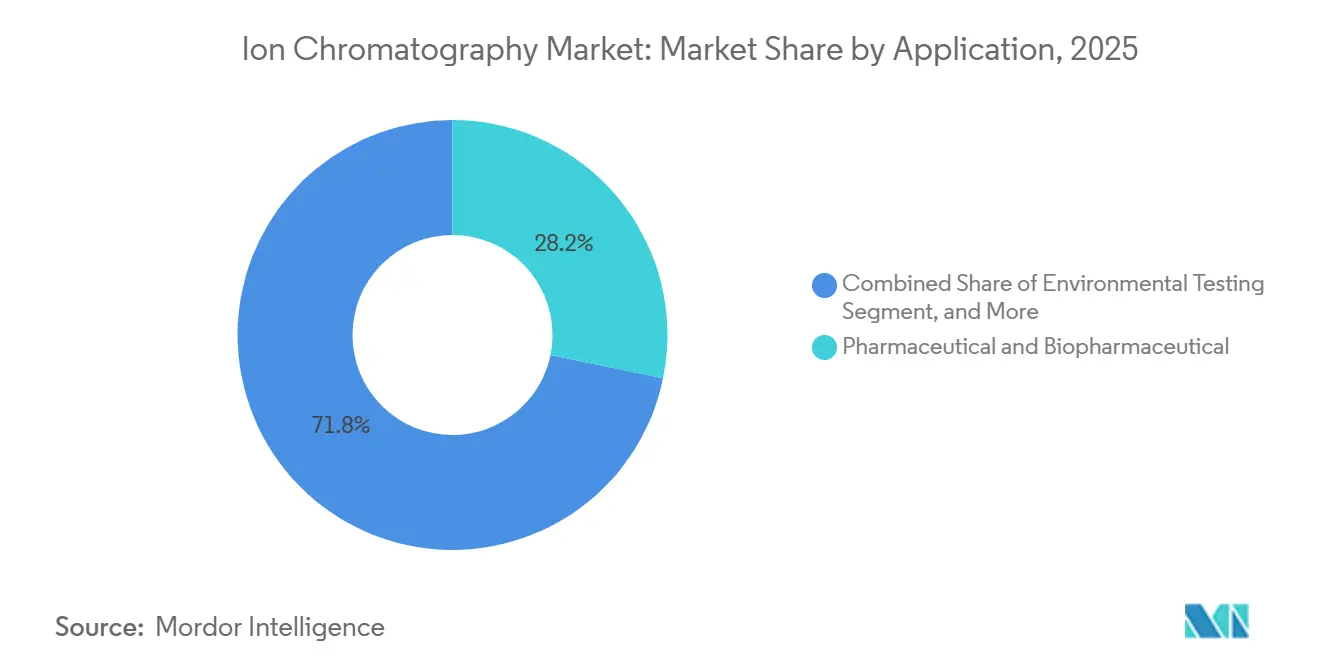
- By application, pharmaceutical and biopharmaceutical testing accounted for 28.22% of revenue in 2025; however, environmental testing is projected to advance at a 5.08% CAGR through 2031.
- By geography, North America commanded 39.64% of 2025 revenue, but Asia Pacific is projected to post the fastest 6.65% CAGR to 2031.
Note: Market size and forecast figures in this report are generated using Mordor Intelligence’s proprietary estimation framework, updated with the latest available data and insights as of January 2026.
Global Ion Chromatography Market Trends and Insights
Drivers Impact Analysis*
| Driver | (~) % Impact on CAGR Forecast | Geographic Relevance | Impact Timeline |
|---|---|---|---|
| Stricter environmental and water-quality regulations | +1.2% | Global, with North America and EU leading enforcement | Medium term (2-4 years) |
| Pharmaceutical and biopharma QC demand surge | +0.9% | North America, Europe, Asia Pacific (India, China) | Long term (≥ 4 years) |
| Food and beverage safety compliance expansion | +0.5% | Global, concentrated in EU and North America | Medium term (2-4 years) |
| Battery-grade electrolyte QC for Li-ion gigafactories | +0.7% | Asia Pacific core, spill-over to North America | Long term (≥ 4 years) |
| AI-driven method automation lowering OPEX | +0.4% | Global, early adoption in North America and EU | Short term (≤ 2 years) |
| Micro-chip IC for point-of-use water analysis | +0.3% | Global, pilot deployments in municipal utilities | Long term (≥ 4 years) |
| Source: Mordor Intelligence | |||
Stricter Environmental and Water-Quality Regulations
Municipal utilities are overhauling laboratories after the U.S. Environmental Protection Agency’s October 2024 interim health advisory set PFOA and PFOS limits at 4 parts per trillion, a sensitivity that legacy spectroscopy cannot achieve.[1]U.S. Environmental Protection Agency, “PFAS National Primary Drinking Water Regulation,” epa.gov Ion chromatography-tandem mass spectrometry has become the reference workflow, driving thousands of system upgrades across U.S. community water systems. The European Union’s revised Drinking Water Directive, effective January 2026, requires quarterly monitoring of 20 PFAS compounds, thereby expanding the addressable base for high-capacity anion columns. China’s draft wastewater standards, published in May 2025, require the reporting of anionic surfactants and hexavalent chromium, adding approximately 8,000 laboratories by 2028. Regulatory focus is widening to nanoplastics, where ion-exclusion chromatography separates polymer-degradation carboxylates more efficiently than optical spectroscopy, positioning the technique for broader adoption. Collectively, these mandates elevate the ion chromatography market by embedding the technology into routine regulatory compliance.
Pharmaceutical and Biopharma QC Demand Surge
Biologics manufacturing uses ion chromatography to quantify leachables from single-use bioreactors, residual host-cell proteins, and trace anions in buffers that can destabilize monoclonal antibodies.[2]U.S. Food and Drug Administration, “Guidance for Industry: Analytical Procedures and Methods Validation,” fda.gov In February 2025, the U.S. FDA updated its analytical validation guidance, explicitly listing ion chromatography as a preferred method for determining the purity of injectable excipients. Biosimilar developers are shifting to ion-pair workflows for charge-variant analysis, which improves resolution for charged metabolites. China’s regulator approved 47 biologic entities in 2025, each requiring multi-stage ion-chromatography testing that adds an estimated USD 120 million in annual consumable purchases.
Food and Beverage Safety Compliance Expansion
The full enforcement of the Food Safety Modernization Act's preventive controls rule in 2024 prompted meat processors, infant formula manufacturers, and craft brewers to adopt ion chromatography for monitoring nitrate, nitrite, sulfate, and chloride. The European Food Safety Authority lowered the tolerable daily intake of nitrite in March 2025, prompting food companies to validate methods for detecting sub-ppm levels. Beverage brands deploy portable modules to test source water for anions that affect fermentation, while inline sensors installed after infant formula recalls shorten detection time from hours to minutes. Organic-acid profiling in juices is transitioning to ion-exclusion chromatography, reducing analysis time from 45 minutes to 18 minutes and enabling producers to release batches sooner. These compliance and operational benefits steadily enlarge the ion chromatography market.
Battery-Grade Electrolyte QC for Li-Ion Gigafactories
Lithium-ion battery makers specify fluoride, chloride, and sulfate at levels below 10 ppb in electrolyte solvents, a detection limit that only ion chromatography meets without preconcentration. China added 280 GWh of battery capacity in 2025, with CATL and BYD installing dedicated laboratories in each gigafactory. Tesla’s Nevada Gigafactory introduced inline monitoring in 2025, reducing electrolyte rejection rates from 4.2% to 1.1%, resulting in a USD 18 million annual savings. Solid-state developers utilize ion chromatography to quantify halides in ceramic powders, thereby creating an emerging niche in consumables. A forthcoming IEC standard will mandate ion-chromatography testing for automotive-grade electrolytes by late 2026, securing a long-term demand floor.
Restraints Impact Analysis*
| Restraint | (~) % Impact on CAGR Forecast | Geographic Relevance | Impact Timeline |
|---|---|---|---|
| High capital and maintenance costs | -0.6% | Global, acute in emerging markets (MEA, South America) | Medium term (2-4 years) |
| Shortage of trained chromatographers | -0.4% | North America, Europe, select Asia Pacific markets | Long term (≥ 4 years) |
| Resin and suppressor supply-chain fragility | -0.3% | Global, concentrated risk in Asia Pacific manufacturing hubs | Short term (≤ 2 years) |
| Availability of alternative techniques (ICP-MS) | -0.5% | Global, strongest in multi-element screening labs | Medium term (2-4 years) |
| Source: Mordor Intelligence | |||
High Capital and Maintenance Costs
A mid-specification instrument lists for USD 48,000–65,000, while installation and validation add USD 12,000–18,000. Consumables compound costs: Anion-exchange columns last 400–600 injections and sell for USD 800–1,200, while suppressors require quarterly replacement at approximately USD 600. Contract labs operating three systems report total annual ownership costs of nearly USD 100,000, straining budgets in India, Brazil, and certain parts of Africa. Shimadzu’s pay-per-sample plan, introduced in Southeast Asia in late 2025, removes upfront capital but increases the five-year cost by 40% compared to direct purchase. Service contracts incur annual costs of USD 8,000–15,000, and slow field-service coverage in secondary cities can result in systems being idle for days. These economic limitations restrict the penetration of ion chromatography among small laboratories and slow the market's growth in emerging regions.
Shortage of Trained Chromatographers
The American Chemical Society’s 2025 survey found a 23% vacancy rate for ion-chromatography-competent chemists, as retirees exit and talent migrates to the biotechnology sector.[3]American Chemical Society, “2025 Comprehensive Survey of the Chemical Workforce,” acs.org European contract labs require 18–24 months to train novices to achieve independent method-development proficiency, thereby delaying productivity. University curricula emphasize molecular biology over separations, thereby shrinking the talent pipeline; only 14% of U.S. chemistry graduates in 2024 had hands-on experience with ion chromatography, compared to 31% in 2015. Automation eases routine workflows but does not replace expert troubleshooting for matrix interferences. Indian pharma QC labs opened 240 new positions in 2025, yet faced six-month hiring cycles, forcing companies to cross-train liquid chromatography analysts. Vendor remote-support models help, but complex issues still need on-site expertise, curbing throughput and tempering overall ion chromatography market growth.
*Our forecasts treat driver/restraint impacts as directional, not additive. The impact forecasts reflect baseline growth, mix effects, and variable interactions.
Segment Analysis
By Product Type: Consumables Propel Recurring Revenue
In 2025, systems and instruments accounted for 58.11% of sales, the largest share of the ion chromatography market. Yet consumables are forecast to grow at a 5.81% CAGR through 2031, nearly double the growth of instruments, illustrating the pivot toward installed-base monetization. The average pharmaceutical lab running five platforms spends USD 40,000–55,000 annually on columns, suppressors, and eluent packs, creating predictable annuity streams that cushion vendor earnings. Thermo Fisher’s Dionex IonPac AS11-HC column, introduced in March 2025, achieved 800-injection lifetimes, reducing the per-sample cost by 22% and drawing users closer to proprietary chemistry. Refurbished equipment brokers discount five-year-old systems by 40%, which increases pressure on new-unit volume, so vendors emphasize modular architectures that allow buyers to refresh detectors while reusing pumps and autosamplers. Consumable innovation also targets sustainability; Tosoh’s September 2025 suppressor cartridge trims water use by 35%, a selling point for ISO 14001-aspiring labs.
Consumables dominance benefits vertically integrated suppliers that control resin production and suppressor assembly, whereas pure-play instrument makers struggle to capture recurring revenue. The software-and-services niche, although the smallest, is scaling steadily as cloud hosting, validation documentation, and predictive maintenance analytics become subscription-based items. Waters Empower 4 charges USD 3,200 per instrument annually, converting one-time licenses into recurring fees. The ion chromatography market size attached to software is therefore expected to outpace total market growth as laboratories shift to SaaS deployments that simplify audit readiness and cybersecurity compliance.


By Chromatography Technique: Ion-Pair Ascends on Biologics Wave
Ion-exchange remained the workhorse in 2025, accounting for 48.86% of revenue, supported by EPA Method 300.1 and its broad utility for inorganic anions. However, ion-pair protocols are forecasted to grow at a 6.19% CAGR through 2031, outpacing the overall ion chromatography market. Biopharmaceutical firms embrace ion-pair reagents that form transient analyte complexes, allowing reversed-phase separations on standard C18 columns using existing LC hardware, which lowers capital barriers. The FDA’s 2025 guidance on oligonucleotide therapeutics explicitly endorses ion-pair chromatography for impurity profiling, legitimizing the approach and fueling a surge in column demand. Agilent reported a 340% year-over-year jump in ion-pair shipments during Q3 2025, mainly to cell-therapy manufacturers.
Ion exclusion remains a niche application, primarily used for monitoring organic acids in fermentation and environmental samples. Long run times and limited resin suppliers constrain growth. Shimadzu’s Shim-pack IC-SA3 column, launched in November 2025, halves analysis time for short-chain fatty acids, addressing a key adoption barrier. Still, regulatory embedment of ion-exchange in water testing gives that technique a durable revenue floor. Over the forecast period, technique diversification will increase consumable volumes as laboratories adopt multiple chemistries, supporting the growth of the ion chromatography market across segments.
By Application: Environmental Testing Rides Regulatory Tailwinds
Pharmaceutical and biopharmaceutical QC generated 28.22% of the revenue in 2025 and will remain the largest segment of the ion chromatography market; however, growth is decelerating as mature laboratories extend their replacement cycles. Environmental testing is forecasted to rise at a 5.08% CAGR to 2031, the fastest among applications. The EPA’s PFAS rule and the EU Drinking Water Directive force 35,000 water utilities to install or upgrade ion-chromatography capacity. Municipal labs are moving from single-detector setups to tandem MS hybrids that quantify 40 PFAS species in a 12-minute run. Industrial dischargers in China face stricter limits on hexavalent chromium, prompting a rapid increase in the uptake of instruments.
Food and beverage safety is another expanding frontier. Infant-formula recalls in 2024 led producers to install inline nitrate sensors, while craft brewers apply ion chromatography to track sulfate and chloride that influence fermentation. Semiconductor and battery applications, bundled under “other research,” accelerate as fabs and gigafactories chase defect yield improvements; TSMC installed 18 systems in 2025 and reported a 22% drop in anion-induced defects. Overall, environmental and emerging industrial uses offset the moderating growth of pharmaceuticals, sustaining a broad application mix within the ion chromatography market.
Geography Analysis
North America generated 39.64% of global revenue in 2025, driven by stringent PFAS enforcement and a large pharmaceutical base. The EPA’s 4 ppt interim limit triggered a two-year spending surge that will taper by late 2027 as retrofits conclude. Canada added 14 QC labs in 2025 to serve U.S. supply-chain diversification efforts, maintaining mid-single-digit regional growth. Mexico’s EV battery expansion, highlighted by Tesla’s Monterrey gigafactory, introduces demand for electrolyte-quality testing, keeping instrument orders steady despite a mature overall market.
The Asia Pacific is the fastest-growing region, projected to grow at a 6.65% CAGR through 2031. Pharmacopeia standards. Semiconductor fabs in Taiwan and South Korea deploy inline ion chromatography monitors to reduce wafer defects, justifying investments of USD 85,000 per system. Japan’s installed base is shifting toward higher consumable-intensity workflows, with Shimadzu and Tosoh leveraging localized service to win share.
Europe’s growth hinges on environmental compliance. The Drinking Water Directive, effective January 2026, mandates quarterly testing for PFAS, sparking bulk procurements across municipal networks. Germany’s chemical sector installed 140 systems in 2025 to meet new wastewater caps, a cycle expected to continue through 2028. The United Kingdom added 22 QC labs post-Brexit to align with Medicines and Healthcare products Regulatory Agency guidelines. Southern Europe lags due to fragmented utilities, but cohesion funds are underwriting lab modernization to 2029. The Middle East and Africa remain nascent but show promise as desalination plants adopt anion monitoring; Saudi Arabia’s ACWA Power equipped six facilities in 2025. South America progresses unevenly; Brazil’s nitrate regulations for processed meats provide a steady, if modest, growth anchor.

Regulatory Landscape
Ion chromatography demand is increasingly influenced by environmental, pharmaceutical, and medical-device quality frameworks that require validated trace-ionic analysis. In the United States, the Food and Drug Administration published draft guidance on chemical analysis for biocompatibility assessment of medical devices in September 2024 (Docket FDA-2024-D-4165), reinforcing expectations for chemical characterization workflows where chromatography is used to screen extractables and leachables. Separately, the U.S. FDA amended 21 CFR Part 820 to the Quality Management System Regulation (QMSR), effective February 2, 2026, incorporating ISO 13485:2016 by reference, which raises the bar for audit-ready documentation and method control across global manufacturing sites supplying the US market.
Across regulated testing, standards frameworks continue to anchor method selection and validation. ISO 10993-18 is widely used for chemical characterization of medical device materials, where ion chromatography supports quantification of anions and cations relevant to material-based contaminants. The emphasis on validated detection limits and resolution of co-eluting peaks tightens performance expectations for instruments, software, and method packages. The report scope also continues to track water-quality compliance pull, including the EU Drinking Water Directive effective January 2026 and US PFAS enforcement dynamics, which reinforce ion chromatography workflows in routine monitoring and drive procurement of higher-capacity columns and hybrid IC-MS configurations in regulated laboratories.
Competitive Landscape
The ion chromatography market is moderately concentrated. Vertically integrated resin production and multi-year service contracts help incumbents protect margins. Vendors are shifting strategy from pure hardware innovation to bundled software, consumables, and predictive analytics. Waters Empower 4 charges USD 3,200 annually per instrument, generating sticky recurring revenue.
Regional specialists exploit localized service and niche chemistries. Metrohm’s modular platform, launched in June 2025, enables detector upgrades without requiring pump replacements, thereby addressing budget constraints in emerging markets. MembraPure’s March 2025 handheld analyzer targets field water testing, a segment underserved by large vendors. Patent activity forecasts future competition in suppressor materials and membrane longevity. Metrohm filed three patents in 2025 to extend suppressor life by 40%, posing a threat to competitors’ consumable streams.
Market dynamics also reflect diverging adoption curves. High-volume labs are embracing AI automation to reduce per-sample costs, while small labs are deferring upgrades due to capital constraints, thereby widening performance gaps. ISO 17025 accreditation increasingly requires certified reference materials and validated protocols, favoring incumbents with broad documentation libraries. New entrants face high validation barriers and fragmented regional demand, which will maintain the ion chromatography market's stable structure in the medium term.
Ion Chromatography Industry Leaders
Bio-Rad Laboratories Inc
Metrohm AG
Agilent Technologies Inc
Danaher Corporation (Cytiva)
Mitsubishi Chemical Corporation
- *Disclaimer: Major Players sorted in no particular order

Market Opportunities and Future Outlook
A key near-term opportunity is the modernization of routine water testing toward higher automation and lower operator burden, particularly as labs adjust to tighter monitoring frequency and lower detection thresholds. In March 2026, Shimadzu released the Nexera IC ion chromatograph for automated water-quality workflows, signaling vendor focus on compact systems, automated operation, and standardized methods that align with municipal utilities and contract lab throughput needs. This also supports the commercial case for bundled packages that combine instruments with validated methods, audit-ready software, and consumables programs, where repeatable guided workflows become more attractive as trained chromatographer availability tightens.
Another opportunity is deeper penetration of IC coupled with advanced detectors for trace and highly polar analytes in regulated and clinical matrices, alongside miniaturized formats that support point-of-use testing. Peer-reviewed method work in 2026 showed validated IC-HRMS and IC-MS/MS approaches (including direct-injection workflows) for challenging polar contaminants and clinical targets, broadening use cases where ion chromatography is selected for selectivity and low-level quantitation rather than as a secondary inorganic screen. With pharmacopeial anchoring of IC methods for ionic impurities and routine ion testing (including established USP-NF general chapters and EP 2.2.28), these developments support demand for higher-throughput systems, consumables with longer lifetime and better robustness, and data-integrity capable software stacks for regulated QC environments.
Recent Industry Developments
- March 2026: Shimadzu released the Nexera IC ion chromatograph, a compact platform designed to automate routine water-quality testing workflows. The launch underscores the shift toward simplified operation and standardized methods for municipal, environmental, and contract testing labs. It also raises competitive pressure on incumbents to match automation features that reduce manual steps and operator training burden.
- April 2025: Thermo Fisher Scientific acquired Solventum’s Purification & Filtration Business for USD 4.1 billion to deepen its bioproduction and analytical portfolio. The deal strengthens Thermo Fisher’s upstream and downstream processing footprint, supporting integrated offerings for regulated biopharma environments that also consume ion chromatography systems and validated workflows. Portfolio breadth can improve cross-selling into pharmaceutical and biopharmaceutical QC accounts where IC is embedded in release and impurity testing.
- October 2024: Agilent Technologies introduced the InfinityLab LC Series with smart automation and energy-efficiency features. Although positioned broadly for liquid chromatography, the emphasis on automation and operational efficiency aligns with laboratory purchasing criteria affecting ion chromatography platforms and adjacent workflows. The introduction supports wider adoption of connected, compliance-ready instrument ecosystems that reduce downtime and standardize data handling across regulated labs.


Research Methodology Framework and Report Scope
Market Definition and Coverage
For this study, the ion chromatography market covers the revenue earned from ion chromatography systems used to separate and measure ions (anions and cations) through ion-exchange, ion-pair, or ion-exclusion mechanisms, along with bundled manufacturer-supplied software and items shipped with the system.
Scope exclusions: stand-alone replacement columns, aftermarket service contracts, and non-ion chromatography techniques are excluded from this sizing.
Segmentation Overview
- By Product Type
- Systems / Instruments
- Consumables
- Software & Services
- By Chromatography Technique
- Ion-Exchange
- Ion-Exclusion
- Ion-Pair
- By Application
- Environmental Testing
- Pharmaceutical & Biopharmaceutical
- Food & Beverage Quality & Safety
- Other Research Applications
- By Geography
- North America
- United States
- Canada
- Mexico
- Europe
- Germany
- United Kingdom
- France
- Italy
- Spain
- Rest of Europe
- Asia-Pacific
- China
- Japan
- India
- Australia
- South Korea
- Rest of Asia-Pacific
- Middle East & Africa
- GCC
- South Africa
- Rest of Middle East & Africa
- South America
- Brazil
- Argentina
- Rest of South America
- North America
Data Sources, Market Sizing, and Validation
Desk Research
Desk work starts with building a fact base around where ion chromatography demand is coming from and how systems are priced and replaced over time. We used public sources such as environmental and water quality regulators, pharmacopeia and standards bodies, trade and lab accreditation references, peer-reviewed analytical chemistry journals, and international trade statistics for lab instruments and parts. These help us ground adoption drivers and the buying pattern for configured systems and bundled items.
On the supply side, we used annual reports, investor presentations, product catalogs, and trusted press to map what is sold with a system versus what is purchased later as a replacement. A paid subscription focused on company financials and a separate news and financials service were used selectively to cross-check revenue exposure and major business changes. We also used a patent database to sense technology activity in ion separation and detection. The desk research sources listed here are illustrative only, and additional public references were used for collection, checks, and clarification.
Primary Interviews and Surveys
Primary work then tests the desk assumptions through interviews and short surveys with instrument makers, channel partners, and lab stakeholders in environmental, pharma, food testing, and academic settings. We also ask about bundled configurations, typical replacement timing, and the share of spend that moves to non-system items, so the modeled totals stay linked to the right revenue pool across APAC, EMEA, and the Americas.
Distribution of primary research fieldwork respondents
| Company type | Respondent position | Region |
|---|---|---|
| Top tier: 35% | CXOs: 16% | APAC: 42% |
| Mid tier: 49% | Functional/Unit leaders: 30% | EMEA: 36% |
| Smaller Players: 16% | Managers: 54% | Americas: 22% |
Market-Sizing & Forecasting
Sizing is built using a top-down approach where regulated testing intensity and lab instrument spending patterns are translated into an ion chromatography demand pool by region, then split into systems and bundled items using observed purchase behavior. To keep the numbers realistic, we corroborate the totals with selective bottom-up approximations, such as a roll-up of sampled supplier revenues, channel checks on placements, and a units-times-average selling price view for common system configurations.
Key inputs that shape the model include installed base replacement cycles, new lab capacity additions, regulated water and wastewater monitoring activity, pharma quality control throughput, and observed price moves for configured systems (including detector and suppressor choices where relevant). If a bottom-up view leaves gaps, we apply conservative fill rates using region-level penetration and channel feedback, then test the output against related signals like import patterns and disclosed instrument business trends.
For forecasting, scenario analysis is used to reflect different paths for regulation-driven testing, lab funding, and replacement timing. The final path is selected based on what experts consider the most likely planning case for the next five years.
Data Validation & Update Cycle
Before sign-off, outputs are triangulated across desk signals, primary feedback, and internal consistency checks, including whether the implied system volumes match realistic replacement and expansion rates. Outliers are reviewed in detail, and if a region or application shows an unusual jump, we re-check assumptions and re-contact sources to confirm what changed.
Each report goes through multi-step analyst review, where calculation logic, unit conversions, and year alignment are checked, followed by a final pass that compares the narrative against the latest public updates. The report is refreshed annually, and interim updates are made when a material event is observed that can shift demand, pricing, or adoption.
Mordor Intelligence's Ion Chromatography Market Size Versus Other Published Estimates
Published ion chromatography market numbers often vary, and the differences usually come from what is counted as part of the market and how upgrades and replacement purchases are treated over time. We also see gaps when a source uses a different base year, applies a faster price curve, or does not re-check assumptions with people who buy and use the systems.
Some published totals expand the scope to include stand-alone replacement columns and ongoing service contracts, which increases the reported value. In Mordor Intelligence's estimate, revenue is counted for ion chromatography systems plus bundled manufacturer-supplied software and items shipped with each system, while stand-alone replacement columns and aftermarket service contracts are left out so the size stays tied to system-led demand.
Benchmark comparison
| Source | Market Size | Gaps in Research Methodology |
|---|---|---|
| Mordor Intelligence | USD 3.48 B (2026) | |
| Industry Publisher A | USD 3.63 B (2024) | Uses an earlier base year and appears to include a wider revenue pool across ion chromatography spending, which can pull in non-bundled items that are purchased after the system sale. |
| Industry Publisher B | USD 2.49 B (2024) | Reports a lower base-year value that likely leans on a narrower captured demand set, with less explicit separation between system revenue and longer-tail purchases, which can undercount configured system value in some regions. |
The spread in the table mostly traces back to what gets included beyond the instrument sale and how base-year pricing and mix are handled. By keeping the inputs tied to placements, replacement cycles, and bundled system configurations, the final number stays easier to audit and to re-run when new signals or expert feedback appear.


Key Questions Answered in the Report
What is the projected size of the ion chromatography market in 2031?
The ion chromatography market size is expected to reach USD 4.21 billion by 2031, growing at a 3.88% CAGR from 2026.
Which product segment is expanding the fastest? |
Consumables such as columns, suppressors, and reagents are growing at a 5.81% CAGR thanks to recurring demand from the installed instrument base.
Why is Asia Pacific the fastest-growing region?
Rapid expansion of pharmaceutical contract manufacturing, semiconductor fabs, and lithium-ion gigafactories in China, India, Taiwan, and South Korea is driving a 6.65% regional CAGR.
How are regulations influencing demand?
Tighter PFAS limits in water, stricter pharmaceutical excipient specifications, and upcoming battery electrolyte standards are turning ion chromatography into a compliance necessity across multiple industries.
What role does AI play in modern ion chromatography systems?
AI-enabled software optimizes gradients, predicts column life, automates peak identification, and triggers preventive maintenance, cutting method development time and unplanned downtime by double-digit percentages.
Page last updated on:


