Smart Transportation Market Size and Share
Market Overview
| Study Period | 2020 - 2031 |
|---|---|
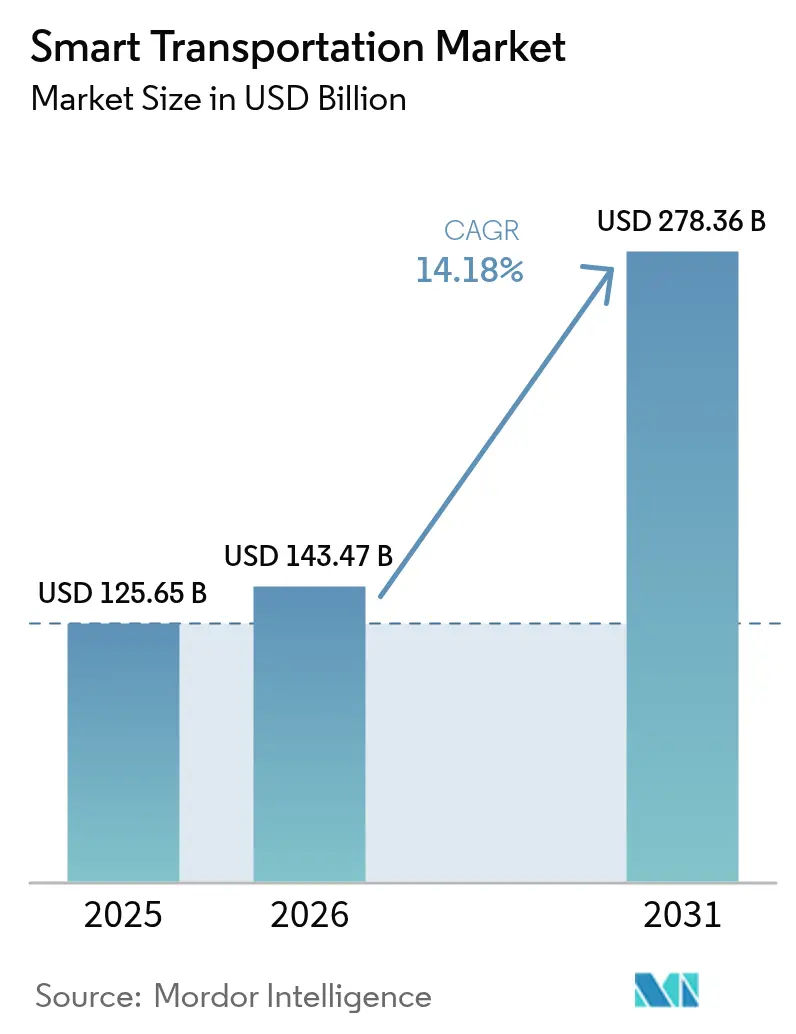
| Market Size (2026) | USD 143.47 Billion |
| Market Size (2031) | USD 278.36 Billion |
| Growth Rate (2026 - 2031) | 14.18% CAGR |
| Fastest Growing Market | Asia Pacific |
| Largest Market | Europe |
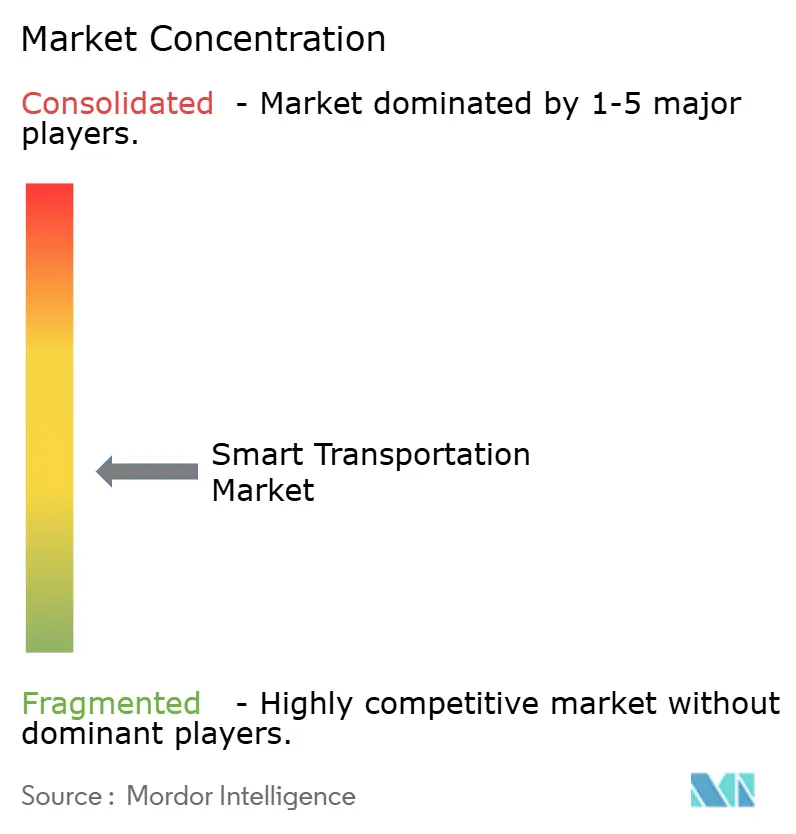
| Market Concentration | Medium |
Major Players*Disclaimer: Major Players sorted in no particular order Image © Mordor Intelligence. Reuse requires attribution under CC BY 4.0. | |
Smart Transportation Market Analysis by Mordor Intelligence
The smart transportation market size is expected to grow from USD 125.65 billion in 2025 to USD 143.47 billion in 2026 and is forecast to reach USD 278.36 billion by 2031 at 14.18% CAGR over 2026-2031. Strong policy backing and rising urban populations are steering governments toward data-centric traffic systems that deliver more capacity without paving additional lanes. Cloud-native analytics, 5G-enabled vehicle connectivity, and digital twin modeling are converging to cut congestion, shorten travel times, and improve safety. Public capital is flowing into deployment: in October 2024, the United States approved USD 4.2 billion for 44 next-generation mobility projects.[1]U.S. Department of Transportation, “Biden-Harris Administration Announces More Than USD 4.2 Billion for Transformational Projects,” transportation.govEurope leads adoption through its Sustainable and Smart Mobility Strategy that promotes zero-emission travel under 500 km and mandates open data across modes of transport. Asia-Pacific is scaling fastest as megacities roll out intelligent highways and MaaS platforms to manage the largest wave of urbanisation in history.[2]World Bank, “Transforming Transportation 2025,” live.worldbank.org
Key Report Takeaways
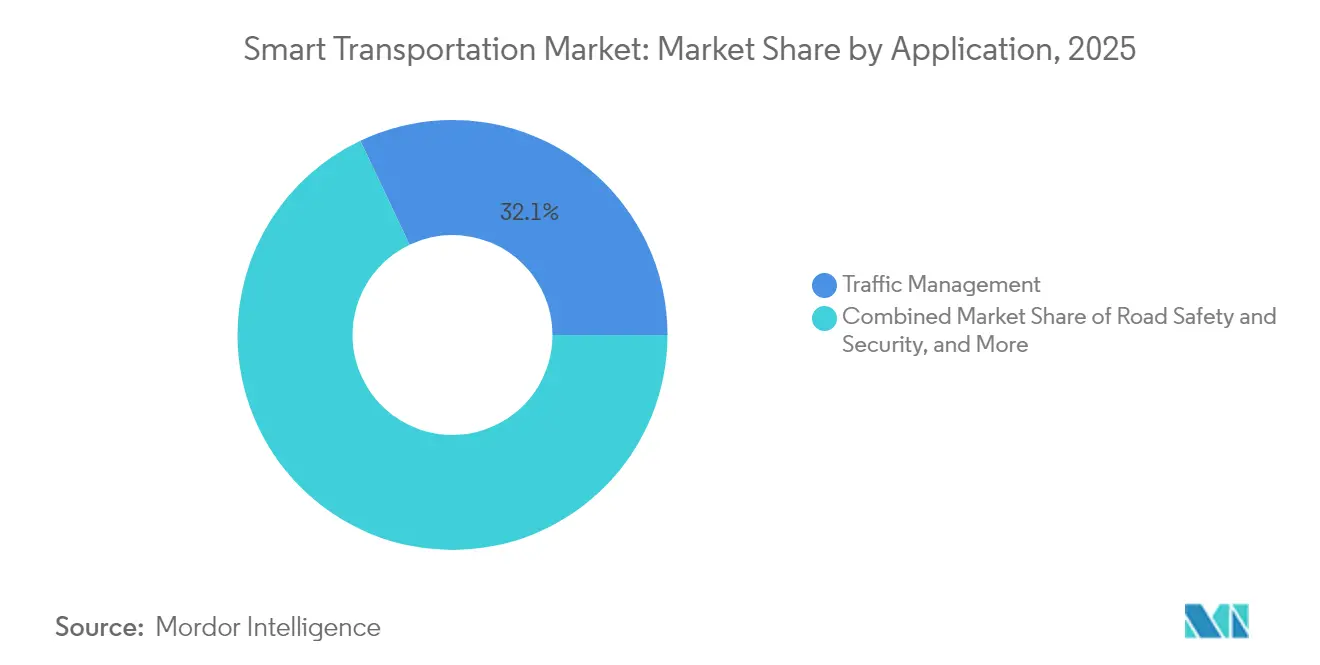
- By application, traffic management held 32.05% of the smart transportation market share in 2025 and is expanding at a double-digit CAGR toward 2031.
- By product type, advanced transportation management systems commanded a 31.45% share of the smart transportation market size in 2025; cooperative vehicle systems are rising at a 16.75% CAGR to 2031.
- By service, cloud services accounted for 41.30% of the smart transportation market size in 2025, whereas professional services are advancing at a 15.25% CAGR.
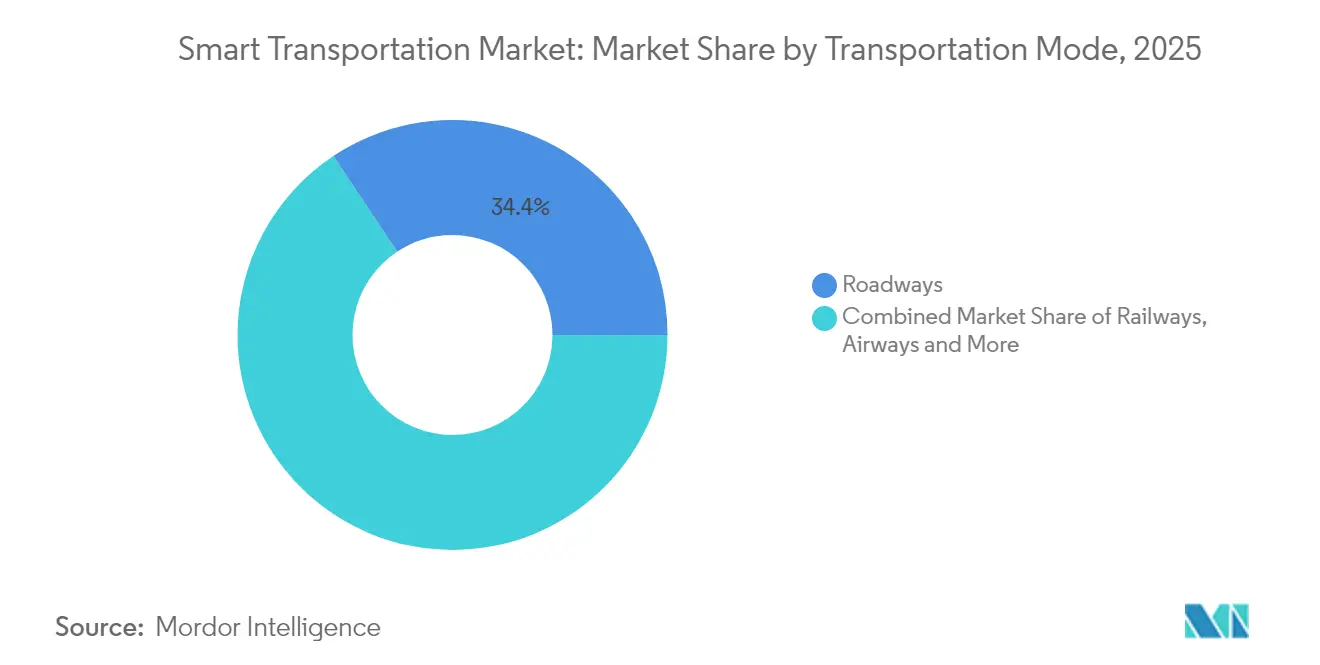
- By transportation mode, roadways accounted for 34.35% of the smart transportation market in 2025, whereas airways are growing at a 12.45% CAGR.
- By connectivity technology, cellular/C-V2X captured 59.20% of the smart transportation market share in 2025 and, when paired with 5G, is growing at 18.85% CAGR.
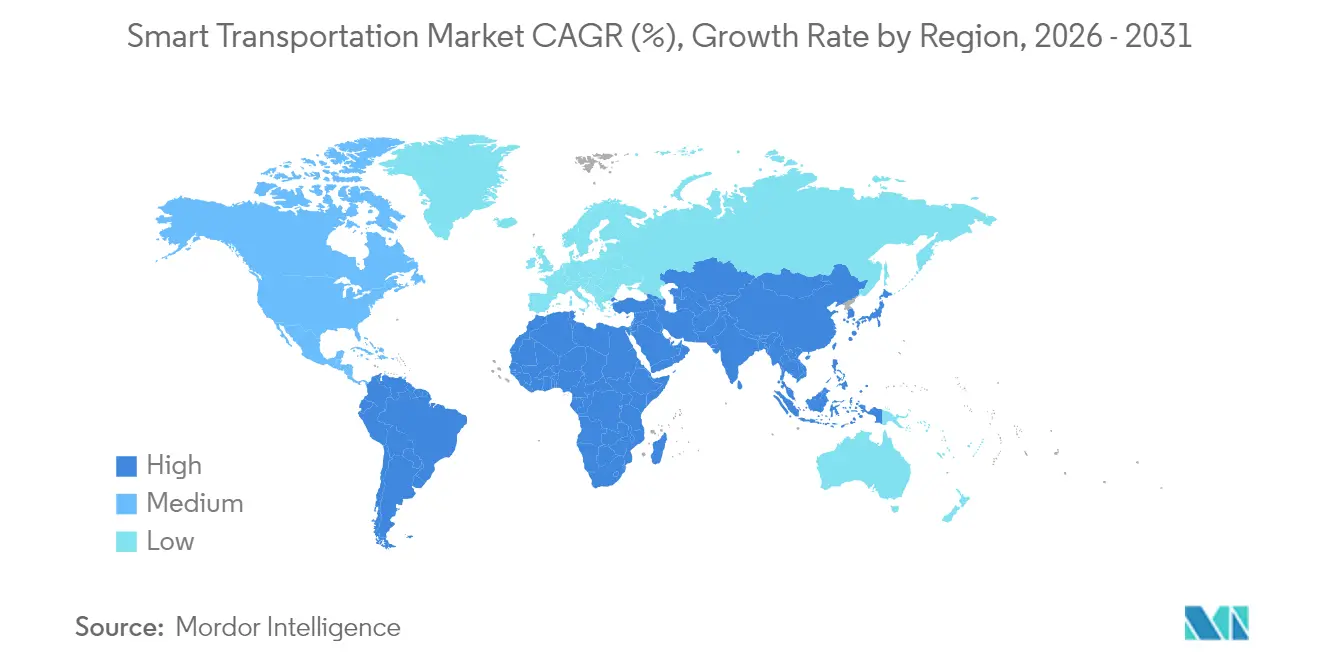
- By geography, Europe led the smart transportation market with 39.10% revenue share in 2025, while Asia-Pacific is the fastest-growing region at 13.28% CAGR.
Note: Market size and forecast figures in this report are generated using Mordor Intelligence’s proprietary estimation framework, updated with the latest available data and insights as of 2026.
Global Smart Transportation Market Trends and Insights
Drivers Impact Analysis*
| Driver | (~) % Impact on CAGR Forecast | Geographic Relevance | Impact Timeline |
|---|---|---|---|
| Rapid urban-population growth | +3.2% | Global, highest APAC & Middle East | Medium term (2-4 years) |
| Government smart-city funding & ITS mandates | +4.1% | North America, Europe, China | Medium term (2-4 years) |
| Drop-in cost of AI edge sensors | +2.8% | Global | Short term (≤ 2 years) |
| MaaS subscription growth | +2.3% | Europe, North America, developed APAC | Medium term (2-4 years) |
| Blockchain toll micro-payments | +1.1% | North America, Europe | Long term (≥ 4 years) |
| GNSS redundancy for urban canyons | +0.9% | Global megacities | Long term (≥ 4 years) |
| Source: Mordor Intelligence | |||


Rapid Urban-Population Growth Stressing Legacy Road Networks
The migration of people toward cities is creating unprecedented traffic density, with urban areas forecast to host 60% of the global population by 2030. Congestion already erodes 2-4% of GDP in many economies, spurring transport agencies to deploy AI-driven traffic optimisation instead of costly road widening. Beijing’s smart signal network cut average delays by 23% in 2024, and similar deployments are underway in Mumbai and Jakarta. Digital twins allow planners to stress-test lane configurations virtually, while adaptive signal control paired with vehicle probe data has trimmed corridor travel times by 25% inside Asian megacities. The smart transportation market, therefore, benefits directly from urban density as cities prioritise technological fixes over concrete expansions.
Government Smart-City Funding & ITS Mandates
Legislative support is translating into multibillion-dollar pipelines for intelligent mobility. The U.S. Infrastructure Investment and Jobs Act allocates USD 91.2 billion for modernising public transit,[3]Government Finance Officers Association, “Infrastructure Investment and Jobs Act,” gfoa.org and the ATTAIN program reserves USD 60 million annually for advanced technology pilots. Parallel initiatives in the European Union mandate interoperable data sharing and carbon-neutral corridors, anchoring demand certainty for vendors in the smart transportation market. Funding provisions often require rural inclusion, widening addressable demand beyond tier-one cities, and stimulating innovation in low-cost sensor packages and cloud orchestration.
Drop-in Cost of AI-Enabled Edge Sensors
Component advances have halved processing-per-watt costs since 2023, permitting camera-LiDAR fusion units below USD 300 that handle inference locally.[4]Texas Department of Transportation, “AI Strategic Plan,” txdot.govMunicipalities that previously could only afford arterial signal upgrades are moving toward blanket coverage, propelling unit shipments and enriching datasets for predictive analytics. Local in-cabinet compute also reduces back-haul bandwidth, letting agencies sweat existing fibre. Vendors positioned with open-standard sensor suites and SaaS control layers gain incremental recurring revenue as endpoints proliferate.
Growth of MaaS Subscription Platforms
Bundled multimodal passes are redefining mobility access in Europe, where regulators support account-based ticketing across metro, micro-mobility, and regional rail. Operators leverage AI to offer dynamic pricing while blockchain ensures settlement transparency among service providers. This structural pivot decreases private-car dependence and lifts utilisation of public fleets, reinforcing demand for integrated payment gateways and passenger information systems – core segments of the smart transportation market.
Restraints Impact Analysis*
| Restraint | (~) % Impact on CAGR Forecast | Geographic Relevance | Impact Timeline |
|---|---|---|---|
| High upfront ATMS capex | −2.1% | Global, highest in developing economies | Short term (≤ 2 years) |
| Lack of cross-vendor V2X standards | −1.8% | Global | Medium term (2-4 years) |
| Cyber-security liabilities | −1.3% | North America, Europe | Medium term (2-4 years) |
| Scarcity of 5.9 GHz spectrum | −0.7% | Asia, Middle East | Long term (≥ 4 years) |
| Source: Mordor Intelligence | |||
High Upfront Capex for City-Wide ATMS Roll-Outs
Deploying an advanced traffic management backbone can cost USD 6,000–7,000 per intersection, and large cities easily exceed USD 70 million capital outlay. Budget cycles and procurement rules slow adoption, particularly where tax bases are small. Public-private partnerships and usage-based pricing models are emerging to defer capex, yet financial friction remains the most immediate headwind facing the smart transportation market.
Lack of Cross-Vendor Data Standards for V2X
The industry continues to wrestle with fragmented message sets following the global pivot from DSRC to C-V2X. While the FCC codified technical parameters in late 2024, many roadside units still speak proprietary dialects, forcing integrators to customise code for each OEM. This hampers scale, raises lifetime cost, and slows fleet retrofits in the smart transportation industry. Standardisation alliances are now prioritising open APIs, but medium-term drag persists.
*Our forecasts treat driver/restraint impacts as directional, not additive. The impact forecasts reflect baseline growth, mix effects, and variable interactions.
Segment Analysis
By Application: Traffic Management Dominates Urban Mobility Solutions
Traffic Management contributed 32.05% market share to the smart transportation market in 2025 and is projected to outpace overall growth as cities target double-digit congestion cuts with AI coordination. Real-time adaptive signal control shows 35% travel-time savings in pilot corridors across Florida, underpinning procurement for intersection analytics, incident detection, and corridor optimisation. Municipal buyers value modular cloud dashboards that plug into legacy controllers without forklift upgrades, a design principle widening vendor addressability.
Parking Management technologies are advancing at a 12.95% CAGR, converting curbside inventory into digital assets and slashing cruising traffic that can reach 30% of downtown volumes. Public Transport is growing as passengers shift from ownership toward usage-based subscriptions. In freight, cooperative adaptive cruise control demonstrates 5-6% fuel savings and higher average speeds, generating business cases for logistics ITS deployments and further boosting the smart transportation market.


By Product Type: ATMS Platforms Evolve with AI Integration
Advanced Transportation Management Systems represented 31.45% of smart transportation market share in 2025, acting as the digital operating system for multi-modal networks. Agencies are replacing siloed, on-premise servers with cloud-native orchestration that supports predictive analytics, work-zone automation, and greenhouse-gas dashboards. California’s procurement to unify 20 legacy systems under a single COTS platform exemplifies the consolidation trend.
Cooperative Vehicle Systems, posting a 16.75% CAGR, marries 5G and edge AI to enable platooning, advanced hazard alerts, and prioritised emergency routing. The 5G Automotive Association’s 2025 non-terrestrial network trial in Paris validated hybrid satellite-cellular V2X, widening coverage for rural highways 5gaa.org. Advanced Transportation Pricing Systems are gaining momentum as congestion pricing reshapes revenue streams and nudges modal shift, often using blockchain for real-time micro-tolling.
By Service: Cloud Platforms Enable Real-Time Analytics
Cloud Services accounted for 41.30% of the smart transportation market size in 2025, reflecting a decisive move away from on-premise data centres. Cloud elasticity allows agencies to ingest terabytes of sensor data, run predictive models, and publish open data portals without capacity planning. Iteris’ SaaS contract with Ventura County underscores how pay-as-you-go analytics lower entry barriers. Platform vendors now bundle cybersecurity monitoring and digital-twin modelling to deepen recurring revenue.
Professional Services are expanding at 15.25% CAGR as agencies seek system integrators that can navigate multi-vendor interoperability, regulatory compliance, and change management. Advisory teams architect phased deployments to minimise disruption, while managed-service wraps guarantee uptime for mission-critical corridors. Deployment & Integration work remains pivotal where legacy SCADA, toll, and payment systems demand careful cut-overs to cloud architectures in the smart transportation market.
By Transportation Mode: Roadways Remain Foundation of Smart Mobility
Roadways generated 34.35% of 2025 revenue. Smart roadway upgrades include connected-vehicle corridors, automated incident clearance, and pavement-embedded sensors that feed maintenance AI. Federal Highway Administration pilots on nighttime visibility and next-gen incident management are setting reference frameworks. Integration with tolling and freight platforms is reinforcing the roadway backbone within the broader smart transportation market.
Airways are the fastest-growing mode at 12.45% CAGR, propelled by remote tower control, AI-guided ground handling, and UAV traffic management. The smart airport segment is driven by biometric passenger flow and edge-based security screening. Rail and maritime investments in connected signalling, predictive maintenance, and autonomous vessel systems round out modal diversification, ensuring the smart transportation industry delivers resilience across supply chains.
By Connectivity Technology: C-V2X Accelerates with 5G Integration
Cellular/C-V2X held 59.20% of the smart transportation market share in 2025 as regulators cleared the 5.9 GHz band for vehicle connectivity. The technology offers kilometre-scale communication ranges, minimal roadside hardware, and seamless upgrade paths to 5G NR. China’s mandate for adding 30 million V2X-ready vehicles annually by 2032 underlines the scale of cellular adoption.
5G/C-V2X is the fastest-growing connectivity stack at 18.85% CAGR through 2031, supporting high-bandwidth sensor sharing and paving the way for partial autonomy. Satellite augmentation using low-earth orbit constellations plugs coverage gaps along rural freight routes and open seas. The European space programme forecasts GNSS downstream revenues to more than double to EUR 580 billion (USD 639 billion) by 2033.
Geography Analysis
Europe captured 39.10% of 2025 revenue in the smart transportation market, underpinned by stringent emissions targets and cohesive funding models. The Sustainable and Smart Mobility Strategy calls for 30 million zero-emission vehicles and a doubling of high-speed rail traffic by 2030. Investment in public data spaces and open-source simulation platforms accelerates vendor innovation while helping cities benchmark performance region-wide. Northern Europe’s mature telecom infrastructure and early adoption of congestion pricing provide templates replicable across the continent.
North America ranks second. Federal programmes, including SMART Grants (USD 100 million annually) and mega-grant corridors, finance pilot scaling and rural outreach. Silicon Valley’s cloud and semiconductor clusters feed a rich supplier ecosystem, allowing rapid commercialization of LIDAR modules, mapping APIs, and middleware critical to the smart transportation market. The FCC’s approval for supplemental satellite coverage using commercial mobile spectrum extends V2X reach into sparsely populated regions, reinforcing the resilience of emergency services.
Asia-Pacific posts the highest growth at 13.28% CAGR. Chinese provinces are activating roadside C-V2X to meet national mandates, while India’s dedicated highway and port programmes integrate IoT sensors for journey-time guarantees. ASEAN megacities deploy contactless ticketing tied to national identity schemes, shortening adoption cycles for Mobility-as-a-Service. In parallel, Middle Eastern states channel Vision 2030 funds into autonomous metro lines, targeting USD 7 billion regional ITS spend by 2030. Collectively, these initiatives cement APAC as a principal volume engine for the smart transportation market.

Competitive Landscape
Market structure is moderately concentrated. Siemens, IBM, Thales, and Huawei anchor end-to-end portfolios that bundle signalling, cloud analytics, and cybersecurity. Each pursues ecosystem plays: Siemens’ Xcelerator platform courts developers to build value-add apps on its transport OS, while IBM overlays watsonx AI to orchestrate predictive incident response. Tier-one OEMs collaborate with telcos and hyperscalers to extend mobility-as-a-service stacks, shifting revenue from hardware to recurring platform fees.
Strategically, vendors pivot toward orchestration models that merge modes into unified journey layers, echoing cloud operating-system economics. Acquisition pipelines target niche software that fills capability gaps: Transit Technologies’ three-deal roll-up of bus scheduling, dispatch, and passenger apps broadens its MaaS suite. Partnerships also de-risk geographic entry; Actelis Networks leverages defence contracts to validate ruggedised Ethernet for roadside cabinets, then cross-sells to city DOTs.
White-space opportunities persist in emerging markets where per-capita capex is lower. Suppliers offering modular, cloud-first architectures with pay-as-you-drive pricing are best positioned. Blockchain tolling pilots indicate latent demand for micro-payment rails that reduce leakage and enable distance-based charging – a proposition resonating with policymakers targeting net-zero funding models within the smart transportation market.
Smart Transportation Industry Leaders
Cisco Systems Inc.
SAP SE
IBM Corporation
AVEVA Group PLC
Siemens Corporation
- *Disclaimer: Major Players sorted in no particular order

Recent Industry Developments
- April 2025: Sonoma-Marin Area Rail Transit secured USD 81 million state funding to extend rail services, leveraging mixed financing to decongest Highway 101.
- April 2025: Shengfeng Development and CATL initiated a USD 42 million logistics partnership, embedding battery distribution into a Tier-1 smart logistics hub to tilt transport emissions downward.
- March 2025: Actelis Networks reported USD 7.8 million 2024 revenue, up 38%, attributing growth to hardened networking gear for city ITS backbones.
- March 2025: Transit Technologies acquired Bushive, adding real-time bus optimisation to its road-transport tech stack and accelerating its smart city platform play.


Research Methodology Framework and Report Scope
Market Definitions and Key Coverage
Our study defines the global smart transportation market as all revenue earned from connected hardware, software, and cloud services that orchestrate passenger and freight movement across road, rail, air, and maritime networks via sensors, communications, and analytics. According to Mordor Intelligence, values are expressed in constant 2024 USD and include both upfront deployments and recurring platform or data fees.
Scope Exclusions: privately run micro-mobility fleets and stand-alone navigation apps lie outside the present scope.
Segmentation Overview
- By Application
- Traffic Management
- Road Safety and Security
- Parking Management
- Public Transport ITS
- Automotive Telematics
- Freight and Logistics ITS
- By Product Type
- Advanced Traveler Information Systems (ATIS)
- Advanced Transportation Management Systems (ATMS)
- Advanced Transportation Pricing Systems (ATPS)
- Advanced Public Transportation Systems (APTS)
- Cooperative Vehicle Systems (C-ITS)
- By Service
- Deployment and Integration
- Cloud and Managed Services
- Professional and Consulting
- By Transportation Mode
- Roadways
- Railways
- Airways
- Maritime
- By Connectivity Technology
- DSRC / C-V2X
- 5G and LTE-M
- Satellite (GNSS, L-band)
- By Geography
- North America
- United States
- Canada
- Mexico
- South America
- Brazil
- Argentina
- Europe
- Germany
- United Kingdom
- France
- Russia
- Rest of Europe
- APAC
- China
- Japan
- India
- Rest of APAC
- Middle East and Africa
- Saudi Arabia
- United Arab Emirates
- South Africa
- Rest of Middle East and Africa
- North America
Detailed Research Methodology and Data Validation
Primary Research
Mordor analysts spoke with city traffic-control chiefs, toll-road concessionaires, V2X chipset vendors, and system-integrator executives across North America, Europe, and Asia-Pacific. These interviews clarified penetration rates, average selling prices, and regulatory milestones that secondary data alone could not confirm.
Desk Research
We started with authoritative open sources such as Eurostat transport-investment tables, the US DOT ITS statistics portal, World Bank urbanization and CO₂ datasets, and UN-ECE road-safety bulletins, which framed network assets and traffic volumes. Findings were refined using IEEE Transactions on Intelligent Transportation Systems, Questel patent analytics, and company filings viewed through D&B Hoovers and Dow Jones Factiva. The sources named are illustrative; many additional datasets informed data collection, validation, and interpretation.
Market-Sizing & Forecasting
We apply a top-down build that begins with public infrastructure spending, connected-vehicle penetration, and rolling-stock orders, and then allocates shares to smart transportation applications by region. Supplier roll-ups and sampled ASP × unit checks provide a bottom-up sense check before totals are finalized. Key variables include urban population growth, daily vehicle-kilometers traveled, ITS-mandate rollout schedules, sensor cost curves, and cloud-edge data volumes. A multivariate regression links these drivers to market value through 2030, while scenario analysis adjusts for funding shocks or policy delays. Gap areas in bottom-up estimates are bridged using regional analogs or averaged price bands from validated interviews.
Data Validation & Update Cycle
Outputs pass automated variance flags, peer-analyst cross-checks, and a senior sign-off. Models refresh every twelve months, with interim updates triggered by material capex announcements, major contract wins, or regulatory changes. A final validation pass is run before report delivery.
Why Mordor's Smart Transportation Baseline Commands Confidence
Published figures often vary because firms choose different start years, bundle adjacent smart-infrastructure segments, or inflate totals with unverified service mark-ups.
Our disciplined scope, annual refresh, and dual-path modeling keep numbers current and comparable.
Benchmark comparison
| Market Size | Anonymized source | Primary gap driver |
|---|---|---|
| USD 125.65 B (2025) | Mordor Intelligence | - |
| USD 129.72 B (2024) | Global Consultancy A | Includes micro-mobility and smart-lighting IoT; uses 2023 FX rates |
| USD 121.36 B (2023) | Industry Journal B | Older base year and omits air and sea-based ITS deployments |
The comparison shows that Mordor's driver-validated assumptions and regular updates yield a balanced, transparent baseline that decision-makers can trust.


Key Questions Answered in the Report
What is the current size of the smart transportation market?
The market is valued at USD 143.47 billion in 2026 and is projected to reach USD 278.36 billion by 2031.
Which segment holds the largest share of the smart transportation market?
Advanced Transportation Management Systems lead with 31.45% share in 2025.
Which connectivity technology is growing fastest?
5G/C-V2X connectivity is expanding at 18.85% CAGR through 2031.
Which region is expected to record the highest growth?
Asia-Pacific is forecast to grow at 13.28% CAGR, driven by rapid urbanisation and large infrastructure investments.
What is the main funding driver behind market growth in North America?
The U.S. Infrastructure Investment and Jobs Act and related grant programs provide substantial capital for intelligent mobility deployments.
What is the biggest restraint facing city deployments today?
High upfront capital expenditure for city-wide ATMS roll-outs remains the most significant barrier, particularly for developing economies.
Page last updated on:


