Intelligent Transport Systems Market Size and Share
Market Overview
| Study Period | 2020 - 2031 |
|---|---|
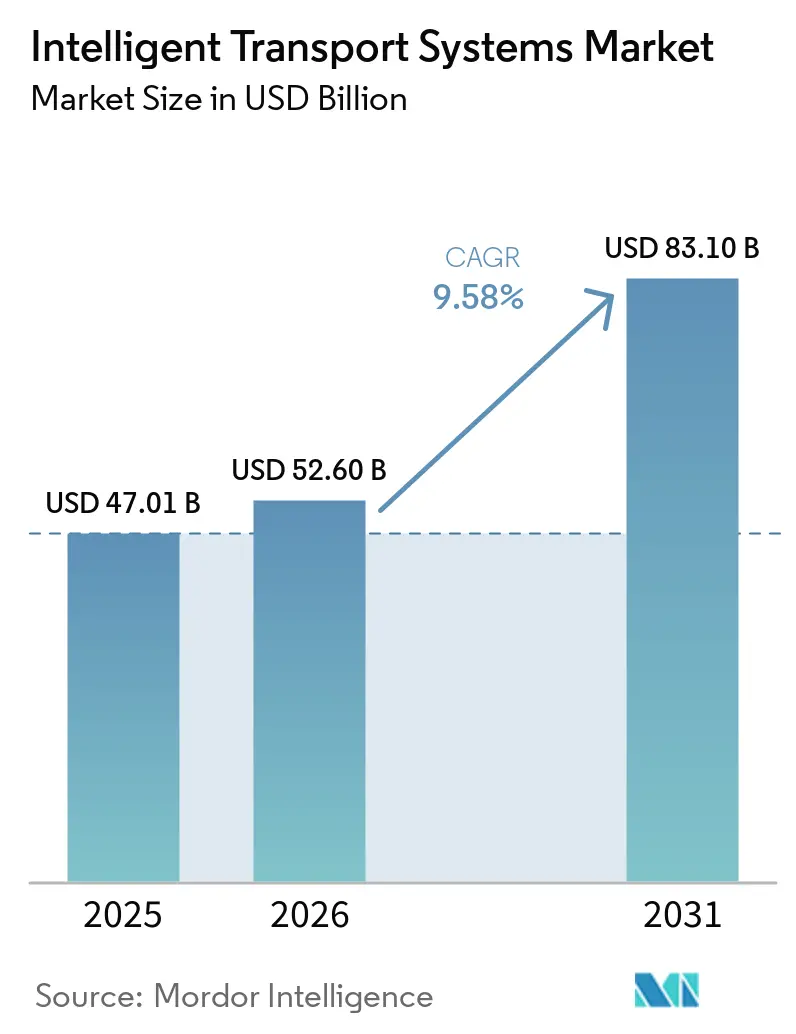
| Market Size (2026) | USD 52.60 Billion |
| Market Size (2031) | USD 83.10 Billion |
| Growth Rate (2026 - 2031) | 9.58% CAGR |
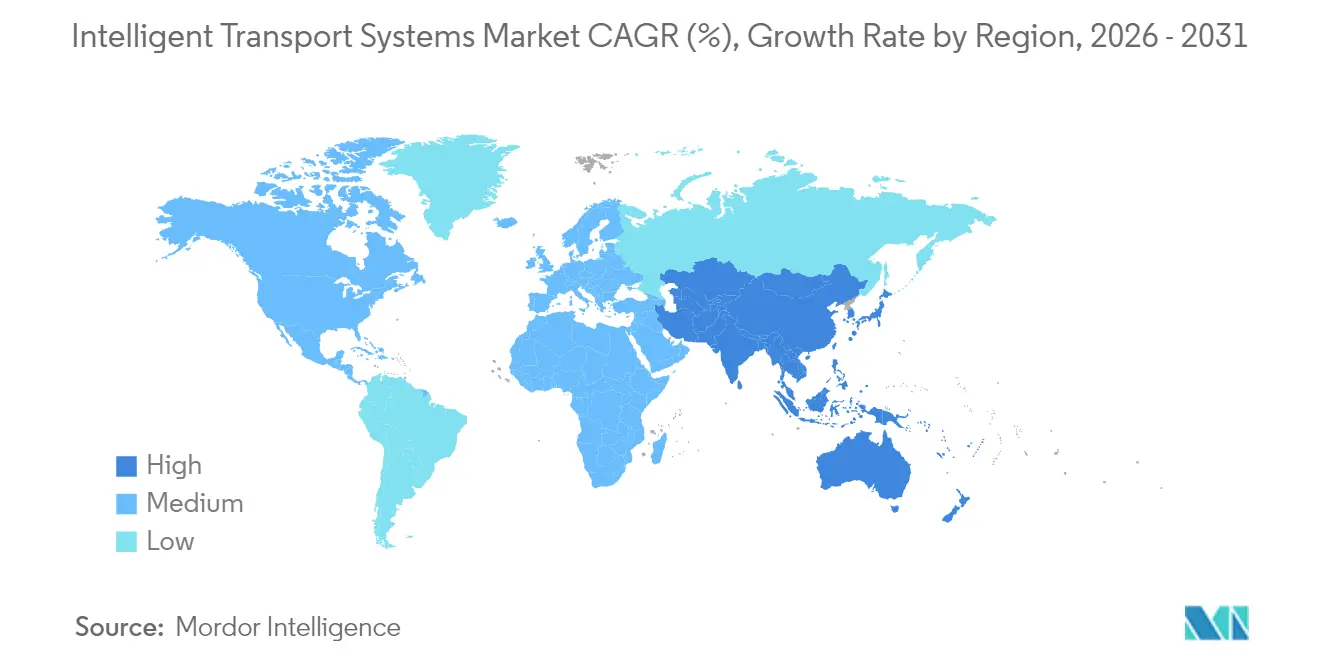
| Fastest Growing Market | Asia Pacific |
| Largest Market | North America |
| Market Concentration | Low |
Major Players *Disclaimer: Major Players sorted in no particular order Image © Mordor Intelligence. Reuse requires attribution under CC BY 4.0. | |
Intelligent Transport Systems Market Analysis by Mordor Intelligence
The Intelligent Transport Systems Market size is expected to increase from USD 47.01 billion in 2025 to USD 52.60 billion in 2026 and reach USD 83.10 billion by 2031, growing at a CAGR of 9.58% over 2026-2031.
Growth stems from the fusion of edge computing, artificial intelligence, and connected-vehicle protocols that let agencies monetize data streams once viewed as sunk infrastructure costs. Public‐sector funding tied to safety and climate goals, such as the USD 62 billion Bipartisan Infrastructure Law allocation for connected corridors, shortens purchase cycles and expands addressable budgets.[1]U.S. Department of Transportation, “Bipartisan Infrastructure Law Funding Notices,” transportation.gov Mandatory ADAS requirements under the EU General Safety Regulation II accelerate demand for infrastructure-vehicle integration.[2]European Commission, “General Safety Regulation II,” ec.europa.eu. At the same time, material cost inflation presses agencies to favor software-defined upgrades over concrete-heavy widening projects, pushing the Intelligent Transportation Systems market toward cloud, edge, and fog deployments. Platform convergence also attracts non-traditional entrants that see revenue in analytics and V2X services rather than physical assets.
Key Report Takeaways
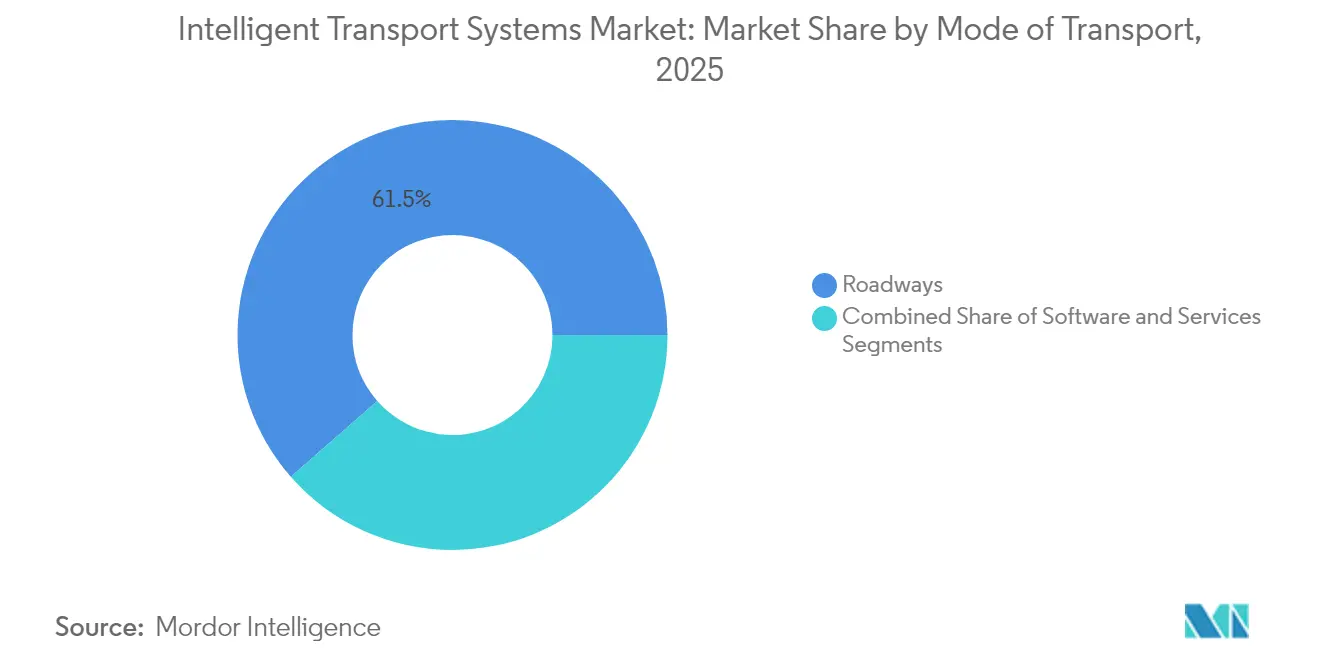
- By mode of transport, roadways led with 61.45% revenue share of the Intelligent Transportation Systems market in 2025, while maritime applications are projected to expand at a 12.86% CAGR through 2031.
- By component, hardware accounted for 48.55% share of the Intelligent Transportation Systems market in 2025; software is the fastest‐growing component at a 13.84% CAGR to 2031.
- By type, advanced traffic management systems held 38.05% of the Intelligent Transportation Systems market size in 2025, whereas cooperative vehicle-infrastructure systems are advancing at a 15.12% CAGR.
- By application, traffic management commanded 40.85% of the Intelligent Transportation Systems market size in 2025; Connected and Autonomous Vehicle support services show the strongest trajectory at an 17.92% CAGR.
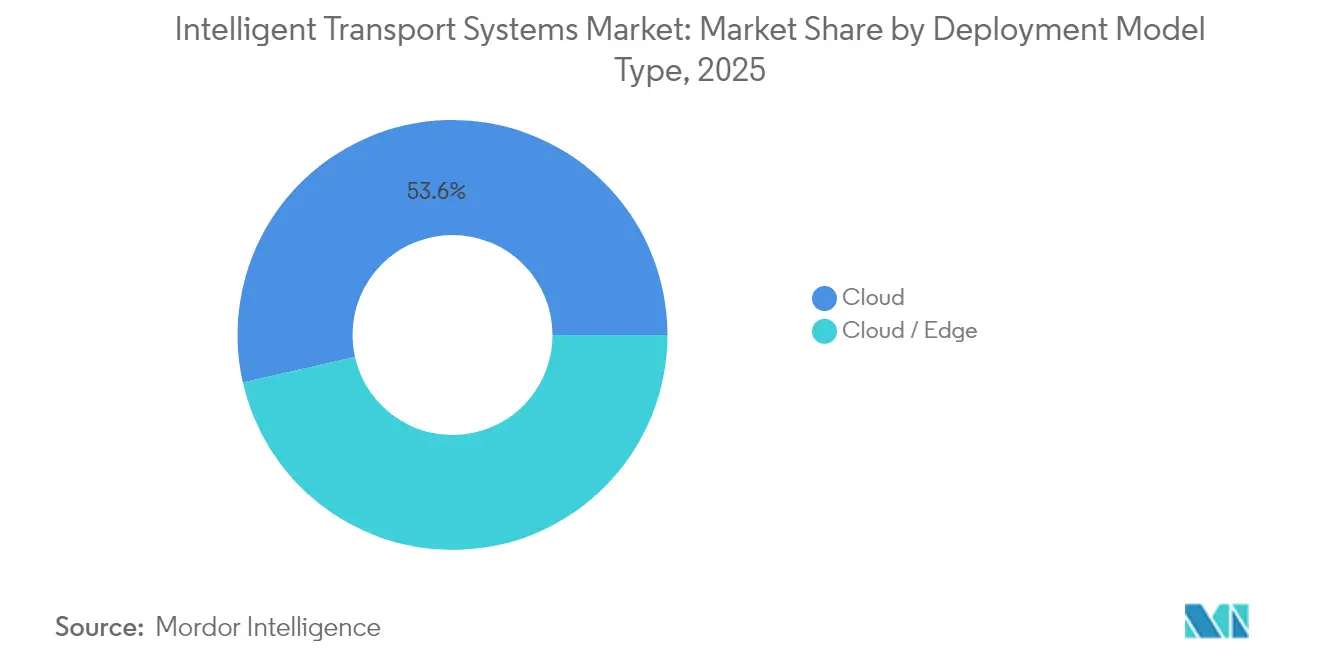
- By deployment mode, cloud captured 53.55% of the Intelligent Transportation Systems market share in 2025; edge/fog architectures are growing at a 17.22% CAGR.
- By technology, IoT sensors and V2X communication formed 39.45% of the 2025 technology mix in the Intelligent Transportation Systems market , while 5G and C-V2X solutions are forecast to rise at a 15.54% CAGR.
- North America contributed 27.65% share of the Intelligent Transportation Systems market in 2025; Asia-Pacific is the fastest-growing geography at a 10.16% CAGR.
Note: Market size and forecast figures in this report are generated using Mordor Intelligence’s proprietary estimation framework, updated with the latest available data and insights as of 2026.
Global Intelligent Transport Systems Market Trends and Insights
Drivers Impact Analysis*
| Driver | ( ~ ) % Impact on CAGR Forecast | Geographic Relevance | Impact Timeline |
|---|---|---|---|
| Government smart-city and traffic-safety funding surge | +2.1% | Global, concentrated in North America and EU | Medium term (2-4 years) |
| Escalating urban congestion demanding ATMS roll-outs | +1.8% | Core APAC, spill-over to MEA cities | Short term (≤ 2 years) |
| Mandatory road-safety regulations (e-Call, ADAS) | +1.5% | EU primary, North America secondary | Medium term (2-4 years) |
| Edge-native AI digital twins for real-time optimisation | +1.4% | Global pilot regions | Long term (≥ 4 years) |
| Integration of EV-charging assets with ITS platforms | +1.2% | North America and EU expanding to APAC | Medium term (2-4 years) |
| Data-monetisation from connected-vehicle analytics | +0.9% | Global, led by North America | Long term (≥ 4 years) |
| Source: Mordor Intelligence | |||
Government Smart-City and Traffic-Safety Funding Surge
Federal and supranational programmes are directing unprecedented sums into connected-corridor build-outs. The U.S. Department of Transportation awarded USD 54 million in SMART grants during 2024 alone, aiming to shift agencies from reactive timing plans to predictive, AI-assisted flow control. In parallel, the EU’s Digital Europe Programme has earmarked EUR 7.5 billion through 2027 for digital infrastructure, with intelligent transportation systems tagged as a centerpiece because they cut emissions while lifting competitiveness. State-level executions such as Arizona’s USD 19.6 million V2X corridor prove how quickly funds translate into assets that produce monetisable data.[3]Arizona Department of Transportation, “Connected Vehicle Corridor Project,” azdot.goV Contract award cycles that once stretched five years now close inside two, rewarding vendors that package turnkey analytics with shovel-ready hardware. Early adopters gain durable first-mover advantages by harvesting data streams before peer regions possess equivalent sensor density.
Escalating Urban Congestion Demanding ATMS Roll-outs
Daily gridlock has turned advanced traffic management systems from nice-to-have to fiscal necessity. An audit in Anne Arundel County, Maryland found a single busy junction costs users USD 324,000 in lost time and USD 48,000 in excess fuel each year, catalysing rapid ATMS procurement. Beijing’s vehicle-road-cloud program has shaved 15% off average trip times across 1,200 intersections, compelling rival megacities to follow suit. Boston’s AI-enabled signal adjustments removed 30% of stops at major downtown nodes, showing that legacy controllers can be repurposed via software rather than rebuilt in concrete. Escalating steel and asphalt prices, highway construction costs rose 24% in 2024—leave software optimisation as the only viable congestion remedy for budget-constrained agencies.
Mandatory Road-Safety Regulations (e-Call, ADAS Integration)
The EU General Safety Regulation II obliges all new cars sold from July 2024 to include Intelligent Speed Assistance, Advanced Emergency Braking, and other ADAS capabilities, forcing complementary infrastructure that can exchange data with the fleet. UN Regulation No. 157 on Automated Lane Keeping establishes global coherence that encourages cross-border freight corridors to adopt harmonised V2X standards. Similar momentum is spreading to the maritime domain where the U.S. Coast Guard now requires cybersecurity risk management across port facilities, adding pressure for unified incident-response data planes. Once optional, infrastructure‐vehicle connectivity is becoming compulsory, locking in a dependable revenue base for suppliers of roadside units, certificate management, and OTA update services.
Edge-Native AI Digital Twins Enabling Real-Time Flow Optimisation
Edge computing moves inference from cloud to curbside. Flow Labs and Michelin demonstrated a tyre-performance digital twin that updates every few milliseconds inside the vehicle ECU, bypassing round-trip delays to public clouds. NoTraffic’s AI signal platform in Maryland cut emergency-vehicle response times by 25% through predictive splits. University of Wisconsin research proved hierarchical reasoning can replicate human signal timing with 90% fewer parameters, fitting on cost-effective edge boxes. Digital twins slash validation cycles for new phasing schemes from months to hours and open novel revenue streams as municipalities license their virtual networks for third-party AV testing.
Restraints Impact Analysis*
| Restraint | ( ~ ) % Impact on CAGR Forecast | Geographic Relevance | Impact Timeline |
|---|---|---|---|
| High capex and legacy infrastructure retrofit costs | –1.8% | Developed markets with aging assets | Short term (≤ 2 years) |
| Interoperability and standards fragmentation | –1.2% | Cross-border corridors worldwide | Medium term (2-4 years) |
| Rising cybersecurity-liability compliance costs | –0.9% | North America and EU | Medium term (2-4 years) |
| AI-algorithm transparency rules | –0.7% | EU primary, spillover elsewhere | Long term (≥ 4 years) |
| Source: Mordor Intelligence | |||
High Capex and Legacy Infrastructure Retrofit Costs
Annual highway construction cost inflation reached 24% in 2024, eroding the real value of earmarked budgets and pushing agencies to defer non-critical upgrades. Steel prices rose 11.2%, dampening the purchasing power of the Bipartisan Infrastructure Law by roughly 40%, according to the American Iron and Steel Institute. Large-scale retrofits like Copenhagen’s EUR 80 million smart-lighting project still demand multi-year paybacks that municipal bond markets struggle to underwrite.[4]City of Copenhagen, “Smart-Lighting Energy Savings Report,” kk.dk Consequently, many agencies pivot to incremental, software-first deployments that extend the life of analogue cabinets instead of wholesale controller swaps. Integration fees often eclipse device prices, forcing procurement offices to spread modernisation across several fiscal cycles and delaying system-wide performance gains.
Rising Cybersecurity-Liability Compliance Costs
Proposed TSA cyber rules and Coast Guard mandates place constant risk-assessment and patching requirements on asset owners. Maritime operators face a USD 1.2 billion cumulative burden to satisfy port security directives. Railways with dispersed signalling networks must retrofit older control points with secure gateways that cost more than the original install price, according to Federal Railroad Administration advisories. Insurance premiums in Asia Pacific’s transport sector climb nearly 50% each year, signalling rising breach costs. Smaller vendors struggle to finance ISO-27001, SOC 2, and sector-specific audits, constricting the competitive field and slowing innovation velocity.
*Our forecasts treat driver/restraint impacts as directional, not additive. The impact forecasts reflect baseline growth, mix effects, and variable interactions.
Segment Analysis
By Mode of Transport: Maritime Automation Drives Cross-Modal Integration
The maritime segment captured just 6.35% of Intelligent Transportation Systems market revenue in 2025 but posts the fastest 12.86% CAGR as ports deploy automation, digital twins, and autonomous tugs. Roadways retained 61.45% share, equivalent to the largest slice of the Intelligent Transportation Systems market size, supported by national safety programmes. Investments in quay cranes fitted with AI vision and 5G links improve berth throughput and synchronise with trucking fleets, cutting container dwell time by 20%. EHang’s EH216 S autonomous air-taxi rollout illustrates how airways leapfrog ground bottlenecks, although the sub-sector remains nascent. Railways benefit from right-of-way control; U.S. freight operators reduced locomotive failures 40% via edge analytics that flag defects hours before breakdowns.
Looking ahead, cross-modal orchestration aligns sailing schedules with rail slots and truck dispatch, raising asset utilisation system-wide. The Intelligent Transportation Systems market increasingly rewards solutions that model maritime, rail, and road flows in a single data fabric. China’s port cloud platforms already integrate yard cranes, gate cameras, and customs databases, foreshadowing global adoption. Roadway projects now pilot C-V2X intersections that broadcast signal timing to heavy-duty trucks, reducing idle fuel. Collectively, these trends shift funding toward software layers that balance freight among modes, lessening peak-hour congestion and emissions.


By Component: Software Platforms Eclipse Hardware Revenue Models
Hardware still represented 48.55% revenue in 2025, yet software’s 13.84% CAGR signals a profound pivot. Agencies value flexible licensing that keeps pace with evolving safety standards, pushing perpetual-license controllers aside. Services, consulting, integration, and managed cybersecurity, expand fastest inside the software bundle, reflecting a need for continuous optimisation rather than periodic box swaps. The Intelligent Transportation Systems market share for hardware will erode as IoT nodes commoditise; roadside units become simple data collectors feeding AI pipelines.
Vendors now bundle analytics dashboards with firmware updates, converting one-time transactions into annuities. Edge containers allow over-the-air deployment of new algorithms that lengthen hardware life and lower total cost of ownership, a key selling point amid budget squeezes. As modular gateways replace monolithic cabinets, procurement shifts from capital outlay to operating-expenditure models akin to SaaS. The outcome is a virtuous cycle: recurring revenue funds R&D that in turn raises system performance, deepening customer dependence on the platform.
By Type: CVIS Emergence Signals Infrastructure-Vehicle Convergence
Advanced Traffic Management Systems (ATMS) held 38.05% of the Intelligent Transportation Systems market size in 2025, anchored by urban signal control. Cooperative Vehicle-Infrastructure Systems (CVIS), however, show a 15.12% CAGR, outpacing all other types. CVIS success stories now surface in state-level pilots where Audi passenger cars query signal phase and timing to cut intersection wait by 15%. ATIS, ATPS, and APTS see moderate growth but increasingly plug into CVIS backbones to harvest richer data.
As OEMs embed 5G modems on production lines, infrastructure that speaks the same language gains strategic value. The Intelligent Transportation Systems market rewards jurisdictions installing certificate management and misbehaviour detection early, laying the groundwork for freight platooning and autonomous shuttles. Once V2X density crosses a critical mass, academics predict a “white-phase” signal could shave 25% off delays by letting equipped vehicles govern intersections—a prospect that accelerates CVIS procurement.

By Application: CAV Support Redefines Transportation Service Models
Traffic management retained 40.85% share in 2025, but Connected and Autonomous Vehicle (CAV) support rockets ahead with an 17.92% CAGR. The Intelligent Transportation Systems market size for CAV support will swell as fleets demand HD maps, over-the-air updates, and cooperative perception. Public transport and ticketing platforms graduate into multimodal concierge apps. Freight and fleet management seize CAV tools to right-size equipment and dodge peak congestion, shrinking fuel costs by double digits.
Environmental monitoring uses connected cars as rolling sensors, streaming CO₂ and particulate metrics street-by-street. Dynamic tolling now flexes by minute rather than hour, leveraging granular flow data from CAV probes. Smart parking shifts from vacancy detection to curb-side orchestration for autonomous drop-offs, raising effective capacity without new construction. Each sub-application feeds a data lake that agencies can monetise under open-data or revenue-share models, extending the Intelligent Transportation Systems market beyond congestion relief into new service categories.
By Deployment Mode: Edge Computing Transforms Latency Economics
Cloud deployments still account for 53.55% share, given their dominance in archival storage and heavy analytics. Yet edge/fog grows 17.22% annually as safety-critical use cases demand sub-10 ms reactions. Collision avoidance, vulnerable-road-user alerts, and adaptive platooning all require on-premise inference. The Intelligent Transportation Systems market now sees cities installing GPU-equipped roadside nodes that host containerised microservices, reducing back-haul needs by up to 90%.
Hybrid architectures emerge in which batch learning stays in the cloud while real-time scoring runs at the edge. Fog layers, regional data centres near cell towers, balance compute and latency, ideal for connected corridors spanning many miles. On-premise models persist for defence and privacy-sensitive rail networks. Overall, deployment choices hinge on latency budgets, security mandates, and cost per processed gigabyte, encouraging solution providers to offer flexible topologies rather than one-size-fits-all SaaS.
By Technology: 5G Connectivity Enables AI-Infrastructure Fusion
IoT sensors and V2X links supplied 39.45% of the 2025 technology mix, anchoring data capture. 5G and C-V2X lead growth at 15.54% CAGR, lifting bandwidth and cutting round-trip delay to single-digit milliseconds, prerequisites for high-density AV traffic. AI and machine-learning analytics distil petabytes of raw feeds into actionable routing, while digital twins provide a sandbox to rehearse any change before deployment. The Intelligent Transportation Systems market increasingly bundles these layers: sensors supply context, 5G moves the bits, AI decides, and twins simulate outcomes.
Verizon's rollout of nationwide C-V2X message sets underscores telecom interest in mobility orchestration, while academic prototypes indicate that intelligent resource orchestration can reduce 5G edge energy use by 30% without degrading QoS. Interoperability with Wi-Fi 6‐e and satellite back-ups ensures resilience for emergency services. The stack's modularity encourages smaller firms to specialise antenna arrays, digital-twin engines, or path-planning AI, expanding the supplier ecosystem while strengthening integration demand for incumbents.
Geography Analysis
North America contributed 27.65% of Intelligent Transportation Systems market revenue in 2025. Federal grants, such as the USD 62 billion connected-vehicle earmark for fiscal 2025, stabilise pipeline visibility and spark state-level copycat projects. Arizona’s USD 19.6 million V2X corridor demonstrates replicable ROI, while Texas DOT’s C-V2X intersection trials position the region as a leader in infrastructure-vehicle fusion. Municipal pilots also layer social goals: Albuquerque’s micro-transit service links food deserts to grocers, showing how data-rich systems tackle equity gaps. Clear liability frameworks and deep venture capital pools pull edge-AI startups into public-sector tenders, accelerating rollouts versus regions with opaque rules.
Asia Pacific is the fastest-growing region at a 10.16% CAGR through 2031. Megacity congestion and state backing for digital economy goals push aggressive deployment timetables. China’s EHang EH216 S autonomous flying-taxi fleet, cleared for passenger service, underscores regulatory agility in advanced air mobility. Beijing’s 1,200-intersection vehicle-road-cloud scheme trimmed travel time 15% and now anchors national standards. Singapore’s SGD 1 billion AI reserve and China’s 20 million NEV target by 2025 give suppliers predictable demand curves. Robotaxi partnerships scaling beyond pilot fleets, Pony AI’s 1,000-vehicle pact in Shenzhen, validate commercialisation pathways and pump data volumes that feed analytics engines.
Europe sustains steady expansion under harmonised safety and climate legislation. The General Safety Regulation II mandates ADAS equipment, compelling roadsides to exchange data with next-generation fleets. Copenhagen’s EUR 80 million smart-lighting retrofit achieved 55% energy savings, revealing how ITS budgets align with carbon targets. EU Digital Europe funds of EUR 7.5 billion through 2027 ensure capital availability for digital twin pilots and cross-border corridors. Siemens Mobility’s multibillion Euro Deutsche Bahn contract exemplifies turnkey platform purchasing over piecemeal upgrades, while stringent GDPR and AI-transparency rules moderate adoption speed yet raise public trust, fostering durable market adoption.

Competitive Landscape
The Intelligent Transportation Systems market shows moderate consolidation as incumbents buy AI and connectivity firms to embed analytics in established product lines. Siemens Mobility secured a EUR 2.8 billion Deutsche Bahn overhaul plus a EUR 750 million mixed-use urban lab, channelling capital depth into long-tail service contracts. Traditional hardware vendors reposition as platform orchestrators, selling subscription dashboards atop commoditised controllers. Meanwhile, technology titans penetrate through partnerships: Uber links its ride-hail network to NVIDIA DGX Cloud for map and perception inference, blurring the boundary between transport operator and systems integrator.
Edge-AI specialists gain traction by guaranteeing sub-100 ms decision cycles that cloud-centric giants cannot meet. Flow Labs, NoTraffic, and similar startups prove their worth in performance-based procurements where KPIs include emergency response time cuts or throughput lifts, not hardware counts. Still, escalating cybersecurity compliance costs deter undercapitalised entrants, gently reinforcing incumbent advantage. White-space opportunities hinge on multimodal platforms that unify ports, rail yards, and arterials, an area still underserved because most offerings optimise only one mode. As data monetisation displaces toll revenue for future funding, firms with analytics IP and policy expertise will command premium valuations.
Intelligent Transport Systems Industry Leaders
Siemens AG
Thales Group
Denso Corporation
Kapsch TrafficCom AG
TomTom N.V.
- *Disclaimer: Major Players sorted in no particular order


Recent Industry Developments
- June 2025: Pony AI and Xihu Group launched a fleet of 1,000 Gen 7 robotaxis in Shenzhen, marking China’s largest autonomous ride-hailing deployment.
- May 2025: Uber committed USD 100 million to WeRide to extend robotaxi operations into 15 additional cities.
- May 2025: Toyota finalised a USD 250 million tranche in Joby Aviation toward commercial eVTOL certification.
- April 2025: SoftBank unveiled a USD 1 trillion plan to build AI-centric industrial parks in the United States.


Global Intelligent Transport Systems Market Report Scope
Intelligent transportation system (ITS) is the application of sensing, analysis, control, and communications technologies in transportation in order to improve safety, mobility, and efficiency. They can be applied to different modes of transport like roadways, railways, airways.
| Roadways |
| Railways |
| Airways |
| Maritime |
| Hardware |
| Software |
| Services |
| Advanced Traffic Management Systems (ATMS) |
| Advanced Traveler Information Systems (ATIS) |
| Advanced Transportation Pricing Systems (ATPS) |
| Advanced Public Transportation Systems (APTS) |
| Advanced Commercial Vehicle Operations (ACVOS) |
| Cooperative Vehicle-Infrastructure Systems (CVIS) |
| Traffic Management |
| Public Transport and Ticketing |
| Road Safety and Security |
| Freight and Fleet Management |
| Environmental and Emission Monitoring |
| Smart Parking and Guidance |
| Tolling and Congestion Pricing |
| Connected and Autonomous Vehicle (CAV) Support |
| Other Applications |
| On-Premise |
| Cloud |
| Edge / Fog |
| IoT Sensors and V2X |
| AI and Machine-Learning Analytics |
| Digital Twin Platforms |
| 5G and C-V2X Connectivity |
| North America | United States |
| Canada | |
| Mexico | |
| South America | Brazil |
| Argentina | |
| Rest of South America | |
| Europe | Germany |
| United Kingdom | |
| France | |
| Italy | |
| Spain | |
| Rest of Europe | |
| Asia-Pacific | China |
| Japan | |
| South Korea | |
| India | |
| Rest of Asia-Pacific | |
| Middle East | Saudi Arabia |
| United Arab Emirates | |
| Turkey | |
| Rest of Middle East | |
| Africa | South Africa |
| Nigeria | |
| Egypt | |
| Rest of Africa |
| By Mode of Transport | Roadways | |
| Railways | ||
| Airways | ||
| Maritime | ||
| By Component | Hardware | |
| Software | ||
| Services | ||
| By Type | Advanced Traffic Management Systems (ATMS) | |
| Advanced Traveler Information Systems (ATIS) | ||
| Advanced Transportation Pricing Systems (ATPS) | ||
| Advanced Public Transportation Systems (APTS) | ||
| Advanced Commercial Vehicle Operations (ACVOS) | ||
| Cooperative Vehicle-Infrastructure Systems (CVIS) | ||
| By Application | Traffic Management | |
| Public Transport and Ticketing | ||
| Road Safety and Security | ||
| Freight and Fleet Management | ||
| Environmental and Emission Monitoring | ||
| Smart Parking and Guidance | ||
| Tolling and Congestion Pricing | ||
| Connected and Autonomous Vehicle (CAV) Support | ||
| Other Applications | ||
| By Deployment Mode | On-Premise | |
| Cloud | ||
| Edge / Fog | ||
| By Technology | IoT Sensors and V2X | |
| AI and Machine-Learning Analytics | ||
| Digital Twin Platforms | ||
| 5G and C-V2X Connectivity | ||
| By Geography | North America | United States |
| Canada | ||
| Mexico | ||
| South America | Brazil | |
| Argentina | ||
| Rest of South America | ||
| Europe | Germany | |
| United Kingdom | ||
| France | ||
| Italy | ||
| Spain | ||
| Rest of Europe | ||
| Asia-Pacific | China | |
| Japan | ||
| South Korea | ||
| India | ||
| Rest of Asia-Pacific | ||
| Middle East | Saudi Arabia | |
| United Arab Emirates | ||
| Turkey | ||
| Rest of Middle East | ||
| Africa | South Africa | |
| Nigeria | ||
| Egypt | ||
| Rest of Africa | ||


Key Questions Answered in the Report
What is the current size of the Intelligent Transportation Systems market?
The market is valued at USD 52.6 billion in 2026 and is projected to reach USD 83.1 billion by 2031.
Which transport mode leads the Intelligent Transportation Systems market?
Roadways dominate with 61.45% revenue share in 2025, although maritime applications are the fastest-growing with a 12.86% CAGR.
Why is edge computing important for intelligent transportation?
Safety-critical applications like collision avoidance need sub-10 ms reaction times that only edge or fog architectures can deliver, driving a 17.22% CAGR in this deployment mode.
How do mandatory safety regulations affect market growth?
Rules such as the EU General Safety Regulation II require vehicles to carry ADAS, which in turn necessitates compatible roadside infrastructure, adding 1.5 percentage points to forecast CAGR.
Which application segment is growing the fastest?
Connected and Autonomous Vehicle support services, expanding at an 17.92% CAGR thanks to rising robotaxi and autonomous freight pilots.
What limits faster adoption of Intelligent Transportation Systems?
High retrofit capex and escalating cybersecurity compliance costs weigh on budgets, trimming overall CAGR by nearly 2.7 percentage points combined.
Page last updated on:


