
Inositol Market Size and Share
Market Overview
| Study Period | 2021 - 2031 |
|---|---|
| Market Size (2026) | USD 414.98 Million |
| Market Size (2031) | USD 643.99 Million |
| Growth Rate (2026 - 2031) | 9.19 % |
| Fastest Growing Market | South America |
| Largest Market | Asia Pacific |
| Market Concentration | Medium |
Major Players
*Disclaimer: Major Players sorted in no particular order Image © Mordor Intelligence. Reuse requires attribution under CC BY 4.0. |
|
Inositol Market Analysis by Mordor Intelligence
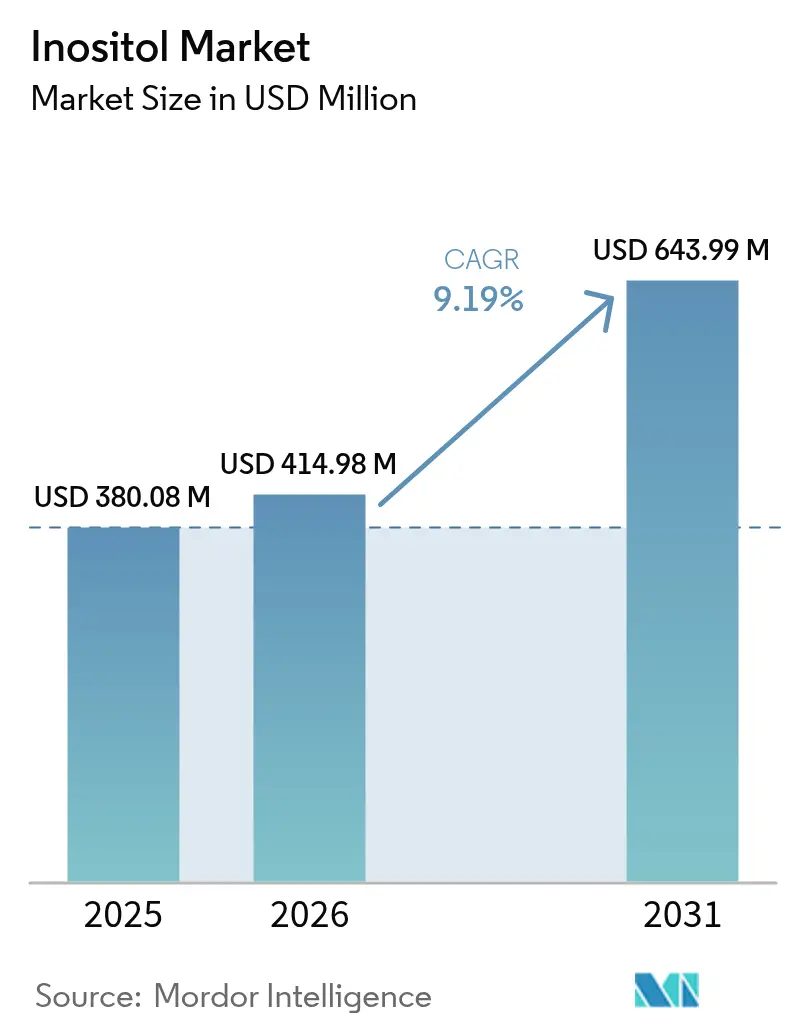
The inositol market size is expected to grow from USD 380.08 million in 2025 to USD 414.98 million in 2026 and is forecast to reach USD 643.99 million by 2031 at 9.19% CAGR over 2026-2031. The market growth is driven by increasing clinical evidence supporting its role in women's health, growing use in infant nutrition formulations, and consistent demand from the monogastric animal feed industry. These factors generate steady demand across pharmaceutical, nutraceutical, food, and feed segments. The compound's established effectiveness in treating polycystic ovary syndrome (PCOS) maintains premium pricing, while improved fermentation efficiency reduces production costs. The Asia-Pacific region, with its integrated corn, rice, and fermentation infrastructure, remains a major exporter and consumer, particularly in animal feed and dietary supplements. Regulatory approvals in the United States and the European Union expand market applications. The increase in corn prices by 2025 is prompting manufacturers to diversify their raw material sources, such as incorporating rice bran, highlighting the importance of effective supply chain management.
Key Report Takeaways
- By source, plant-based inositol captured 61.72% of the inositol market share in 2025, while synthetic variants are forecast to expand at a 9.88% CAGR through 2031.
- By type, myo-inositol dominated with an 79.56% revenue share in 2025; D-chiro-inositol is projected to grow at an 11.28% CAGR between 2026 and 2031.
- By application, dietary supplements led with 37.12% revenue share in 2025, whereas food and beverage applications are poised for an 10.95% CAGR to 2031.
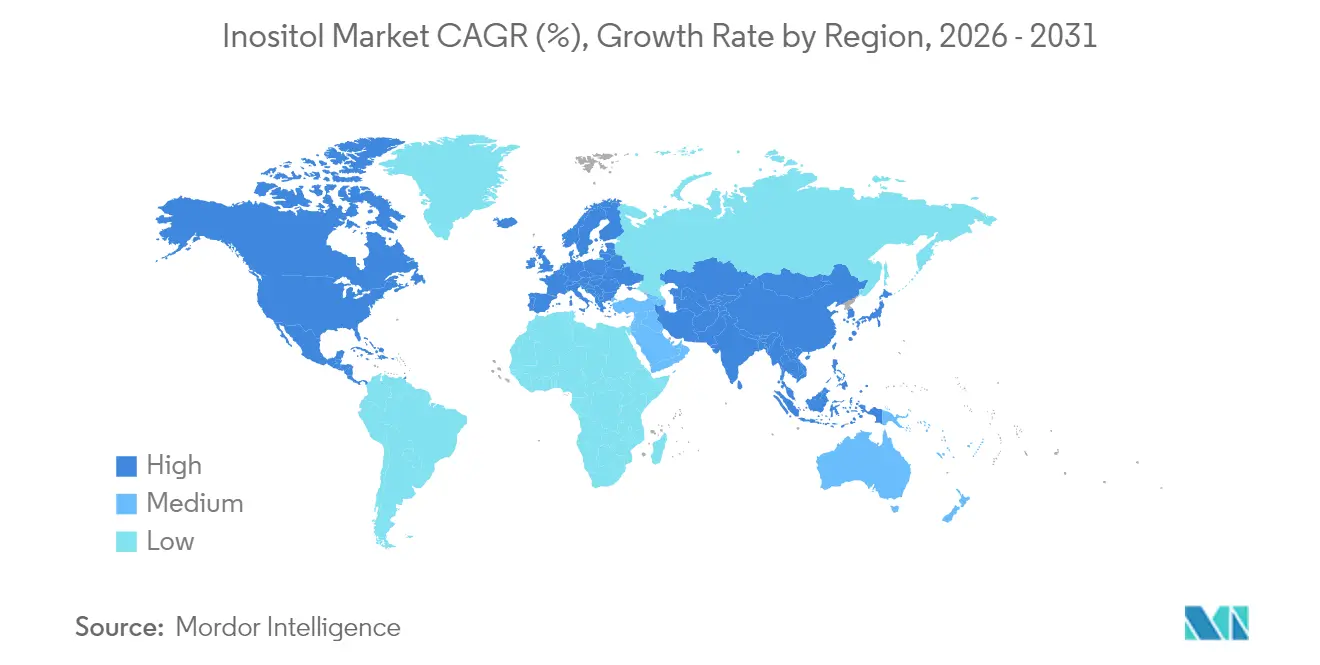
- By geography, Asia-Pacific held 43.74% of the 2025 revenue base, yet South America is on track for the fastest 9.76% CAGR over the forecast period.
Note: Market size and forecast figures in this report are generated using Mordor Intelligence’s proprietary estimation framework, updated with the latest available data and insights as of 2026.
Market Trends and Insights
Drivers Impact Analysis of Inositol Market*
| Driver | (~) % Impact on CAGR Forecast | Geographic Relevance | Impact Timeline |
|---|---|---|---|
| Growing inclusion in infant formula and functional foods due to inositol's role in cognitive and metabolic support | +2.1% | Global, with early adoption in North America and Europe | Medium term (2-4 years) |
| Expansion of Asia-Pacific monogastric feed industry | +1.8% | Asia-Pacific core, spill-over to Middle East and Africa | Long term (≥ 4 years) |
| Rising PCOS and fertility issues boost demand for inositol for its insulin-sensitizing effects | +2.4% | Global, with concentrated demand in developed markets | Short term (≤ 2 years) |
| Expanding mental health and cognitive wellness segment | +1.3% | North America and Europe primarily, expanding to Asia-Pacific | Medium term (2-4 years) |
| Preference for plant-derived, clean-label ingredients drives demand for inositol | +1.1% | Global, led by North America and Europe consumer preferences | Medium term (2-4 years) |
| Cost-down of fermentation-based synthetic inositol | +0.9% | Global manufacturing hubs, particularly Asia-Pacific | Long term (≥ 4 years) |
| Source: Mordor Intelligence | |||
Growing inclusion in infant formula and functional foods due to inositol's role in cognitive and metabolic support
The global inositol market is growing due to its increased use in infant formula and functional foods. Inositol plays a significant role in neural development, memory formation, and metabolic programming during early life. The compound functions in phospholipids and insulin signaling pathways, supporting brain development and glucose metabolism. These findings drive inositol's expansion in food and nutrition products. The U.S. FDA's GRAS designation permits inositol use in infant formula at 4-40 mg per 100 kcal, establishing clear guidelines for manufacturers. The European Food Safety Authority (EFSA) has also confirmed inositol's safety, implementing conservative dosing guidelines. These approvals validate the compound's safety and encourage its adoption by major infant formula manufacturers. Consumer preferences indicate strong market potential for inositol products. According to Glanbia Nutritionals' 2023 data, 25% of German consumers preferred functional beverages targeting cognitive health, while 19% favored products aimed at supporting digestive wellness [1]Source: Glanbia Nutritionals, "European Functional Beverage Market Insights for 2023," glanbianutritionals.com. The DSM 2023 survey indicates parents prioritize infant formulas with immune health benefits (30%), balanced nutrition (33%), and digestive gentleness (16%) [2]Source: DSM-Firmenich, "Ask-the-Expert: What do Moms Really Want from Nutritional Products for their Children," dsm-firmenich.com. These preferences create opportunities for manufacturers to incorporate inositol into their products.
Expansion of Asia-Pacific monogastric feed industry
The Asia-Pacific monogastric feed market drives significant demand for inositol, supported by annual poultry production growth of 4-5% and increasing aquaculture intensity. The region recorded a 2.5% increase in feed production capacity in 2024 compared to 2023, with China maintaining its position as the primary producer and consumer. Inositol supplementation in monogastric nutrition improves feed conversion ratios and reduces oxidative stress in intensive production systems. The compound works synergistically with phytase enzymes to improve phosphorus utilization, addressing nutritional efficiency and environmental concerns. Feed manufacturers in the region implement phytase superdosing strategies to release inositol from phytate complexes, reducing supplementation costs while maintaining dietary benefits. This approach demonstrates the market's understanding of enzyme-substrate interactions and cost optimization, vital during periods of high corn prices and increased use of alternative feed ingredients.
Rising PCOS and fertility issues boost demand for inositol for its insulin-sensitizing effects
The increasing prevalence of polycystic ovary syndrome (PCOS) and associated fertility issues has become a significant growth driver for the global inositol market. PCOS, characterized by insulin resistance, hormonal imbalance, and anovulation, directly affects reproductive health. The two main forms of inositol, myo-inositol and D-chiro-inositol, demonstrate insulin-sensitizing properties that enhance glucose uptake, regulate ovarian function, and promote ovulation. The growing recognition of these benefits among healthcare providers and consumers has increased the adoption of inositol supplementation, stimulating growth in both nutraceutical and pharmaceutical segments. Global fertility rates continue to decline, highlighting the need for effective reproductive health solutions. According to the CIA report, Taiwan reported the world's lowest fertility rate in 2024, at 1.11 children per woman, exemplifying the demographic challenges prevalent across Asia-Pacific and other regions [3]Source: CIA, "Total fertility rate," cia.gov. This demographic shift has increased interest in fertility enhancement and adoption of inositol supplementation, particularly for PCOS, which represents a significant share of female infertility cases, thereby stimulating market growth. In this context, inositol has emerged as an evidence-based ingredient that addresses both the metabolic and reproductive aspects of infertility.
Expanding mental health and cognitive wellness segment
The mental health applications of inositol continue to expand as research demonstrates its effectiveness in treating panic disorder, depression, and obsessive-compulsive disorder. Inositol functions as a precursor to phosphatidylinositol and plays a role in serotonin receptor signaling, providing a scientific basis for its use in neuropsychiatric treatments. Clinical studies shows that psychiatric conditions require therapeutic doses of 12-18 grams daily, which is higher than standard nutritional supplement doses, creating distinct market categories with separate regulatory requirements and price points. The growing focus on cognitive wellness, especially among older populations, increases the demand for lower-dose inositol formulations that target general brain health maintenance. The supplement's strong safety record and minimal drug interactions make it an attractive alternative to synthetic cognitive enhancers. While clinical evidence strongly supports inositol's use for specific psychiatric conditions, its application for general cognitive enhancement, though growing in popularity due to consumer preference for natural alternatives, has less extensive research backing.
Restraints Impact Analysis of Inositol Market*
| Restraint | (~) % Impact on CAGR Forecast | Geographic Relevance | Impact Timeline |
|---|---|---|---|
| Volatile corn/phytic-acid raw-material prices | -1.4% | Global, with acute impact on Asian manufacturing hubs | Short term (≤ 2 years) |
| Availability of substitute ingredients | -0.8% | Global, particularly in cost-sensitive applications | Medium term (2-4 years) |
| Limited penetration in emerging markets | -0.6% | Emerging markets in Africa, Latin America, Southeast Asia | Long term (≥ 4 years) |
| Stringent purity and pharma-grade regulatory hurdles | -1.1% | Global, with varying intensity by regulatory jurisdiction | Medium term (2-4 years) |
| Source: Mordor Intelligence | |||
Volatile corn/phytic-acid raw-material prices
The volatility in corn starch prices in 2025 affects inositol production costs, as corn remains the primary feedstock for both extraction and fermentation-based production methods. Manufacturers face margin pressures when they cannot transfer increased costs to price-sensitive segments, particularly the animal feed sector. The market faces additional constraints from competing corn demands, including ethanol production, food applications, and export requirements. In response, manufacturers are expanding their feedstock options to include rice bran and wheat bran, though these materials require modified processing methods and generate different impurity profiles that impact purification costs. While phytic acid extraction from rice bran provides cost benefits during periods of high corn prices, its supply chain reliability remains lower compared to established corn processing systems. These market conditions influence inventory management practices and supply agreements, changing the working capital requirements and risk management strategies throughout the industry.
Availability of substitute ingredients
Compounds such as betaine, choline, and botanical extracts compete with inositol in certain applications, especially where cost is a primary consideration over therapeutic effectiveness. Betaine offers similar methyl donor properties and insulin-sensitizing benefits at reduced costs, making it suitable for feed applications that do not require precise inositol levels. Feed manufacturers use phytase enzyme supplementation to release natural inositol from phytate compounds, reducing the need for direct inositol addition while maintaining nutritional benefits. This enzyme-based approach helps manufacturers optimize costs while preserving animal performance. While alternative ingredients gain regulatory approval and quality improvements, affecting inositol's market position in cost-sensitive segments, inositol maintains its advantage in therapeutic applications due to its specific biological functions and established clinical evidence.
*Our forecasts treat driver/restraint impacts as directional, not additive. The impact forecasts reflect baseline growth, mix effects, and variable interactions.
Inositol Market Segment Analysis
By Source:
Plant-Based Dominance Meets Synthetic InnovationIn 2025, plant-based inositol commands a dominant 61.72% share of the market. This surge in popularity is largely attributed to consumers' growing preference for natural ingredients, coupled with tried-and-true extraction techniques from corn and rice. The segment's robust standing is bolstered by its clean-label designation, which appeals to health-conscious consumers, and widespread regulatory endorsements that ensure its acceptance across various regions. Additionally, plant-based inositol benefits from its versatility in applications, including dietary supplements, pharmaceuticals, and functional foods. However, it's worth noting that production costs for plant-based inositol are susceptible to the whims of agricultural commodity price fluctuations, which can impact its overall profitability.
Synthetic inositol is projected to grow at a CAGR of 9.88% through 2031. This growth is attributed to advancements in fermentation-based production methods that lower manufacturing costs while maintaining consistent purity levels. Recent manufacturing innovations have reduced the traditional distinctions between plant-based and synthetic categories, as new biotechnology processes combine plant substrates with engineered microorganisms for inositol production. This integrated approach offers both the marketing benefits of plant-based origins and the production advantages of controlled fermentation. Both production methods comply with USP and EP monograph specifications, meeting established purity and safety standards.




By Type:
Myo-Inositol Leadership with D-Chiro-Inositol AccelerationMyo-inositol dominates the type segmentation with 79.56% market share in 2025, supported by extensive clinical evidence, regulatory acceptance, and established manufacturing infrastructure across multiple production routes. The compound's versatility spans therapeutic applications in PCOS treatment, infant formula fortification, and feed supplementation, creating diverse revenue streams that support market stability. D-chiro-inositol emerges as the fastest-growing segment at 11.28% CAGR through 2031, driven by specialized therapeutic protocols and combination therapy approaches that leverage its unique metabolic properties. Clinical research increasingly demonstrates that D-chiro-inositol addresses specific aspects of insulin resistance that myo-inositol cannot fully correct, creating complementary rather than competitive market dynamics.
The optimal therapeutic ratio of 40:1 myo-inositol to D-chiro-inositol drives demand for both compounds, though D-chiro-inositol's higher production complexity and limited manufacturing capacity create supply constraints that support premium pricing. Fermentation-based production of D-chiro-inositol requires specialized enzyme systems and longer cultivation periods compared to myo-inositol, resulting in higher manufacturing costs that pharmaceutical applications can absorb but feed applications cannot. This cost differential creates natural market segmentation where myo-inositol serves broader applications while D-chiro-inositol focuses on high-value therapeutic uses. Regulatory considerations favor myo-inositol due to its longer safety history and more extensive toxicological database, though D-chiro-inositol benefits from growing clinical evidence that supports its therapeutic positioning.
By Application:
Dietary Supplements Lead While Food Applications SurgeThe dietary supplement segment holds 37.12% market share in 2025, as inositol maintains a strong presence in the nutraceutical industry due to increased consumer awareness of its health benefits. This segment operates under less complex regulatory requirements compared to pharmaceutical applications while generating higher margins than food and feed uses. The food and beverage segment exhibits the strongest growth trajectory at 10.95% CAGR through 2031, primarily due to infant formula enrichment and functional food development. The FDA's GRAS status for inositol in infant formula expands market opportunities, particularly in developed nations where demand for premium infant nutrition products remains robust.
The pharmaceutical segment shows consistent growth despite regulatory complexities, supported by inositol's proven effectiveness in PCOS treatment and mental health applications. This segment maintains high pricing due to strict pharmaceutical-grade purity standards and documentation requirements, though regulatory approval processes limit volume expansion. Animal feed and personal care applications provide market stability through diversification, albeit at lower price points. The animal feed segment expands with Asia-Pacific's growing monogastric production, where inositol improves feed efficiency and reduces oxidative stress in intensive farming. Personal care remains a small but expanding segment, with inositol's moisturizing and skin barrier enhancement properties supporting its use in premium skincare products.

Geography Analysis
APAC Inositol Market
In 2025, Asia-Pacific commands a dominant 43.74% share of the inositol market, solidifying its role as both a leading consumer and the foremost manufacturing hub. While China's robust feed production and corn processing have traditionally bolstered its inositol manufacturing, recent fluctuations in corn prices have prompted a shift towards alternative feedstocks, such as rice bran and wheat. The region's burgeoning middle class, coupled with heightened health consciousness, fuels a rising demand for dietary supplements, particularly those targeting metabolic health and cognitive function. Simultaneously, initiatives aimed at regulatory alignment, such as harmonization of standards under ASEAN, are smoothing the path for international suppliers to access the market, further enhancing the region's global competitiveness.
Japan and South America Inositol Market
Japan's pharmaceutical industry consistently seeks high-purity inositol, fostering premium market segments. This demand not only propels advancements in manufacturing processes but also elevates quality control standards to meet stringent pharmaceutical-grade requirements. The focus on therapeutic applications, including mental health and liver health, continues to drive innovation in the sector. South America, led by Brazil, is on a rapid ascent, boasting the highest growth rate at 9.76% CAGR through 2031. Brazil's dietary supplement market surged by 43% in Q1 2024, spurred by evolving regulations under ANVISA and a heightened awareness of PCOS treatments, bolstered by better healthcare access. Additionally, the region's growing fitness culture and demand for functional foods are contributing to the expansion of the inositol market.
Argentina, North America and Europe Inositol Market
While Argentina's agricultural sector presents opportunities for plant-based inositol production, its manufacturing infrastructure lags behind its Asian counterparts, limiting its ability to scale production efficiently. However, the country's abundant raw material availability, such as corn and soy, positions it as a potential future player in the market. North America and Europe, while holding steady market positions, are channeling their focus towards high-value applications. In these regions, the emphasis on pharmaceuticals and premium dietary supplements is underscored by stringent regulatory compliance and elevated quality standards, allowing them to command higher prices that offset increased manufacturing costs. Furthermore, the growing trend of personalized nutrition and the rising prevalence of chronic diseases are driving demand for specialized inositol-based products in these markets.

Regulatory Landscape
Inositol use in foods in the United States is supported by its affirmed GRAS status under 21 CFR 184.1370 as a nutrient supplement, with use governed by current good manufacturing practice. Beyond this baseline, the US FDA completed its evaluation of GRAS Notice No. GRN 001198 (Sichuan Bohaoda Biological Technology Co., Ltd.) in 2025, which added clarity on intended food-category uses and use levels for certain product types.
In the European Union, requirements vary by end use. Food additive permissions sit within the Community list under Regulation (EC) No 1333/2008, while feed additive authorizations follow the EFSA-led process. In 2025, EFSA FEEDAP issued an opinion supporting continued safety for inositol as a feed additive (3a900), and in May 2026 the European Commission renewed the authorization of inositol as a nutritional feed additive for fish and crustaceans through an implementing regulation, reinforcing compliance pathways for aquafeed formulations using inositol.
Competitive Landscape
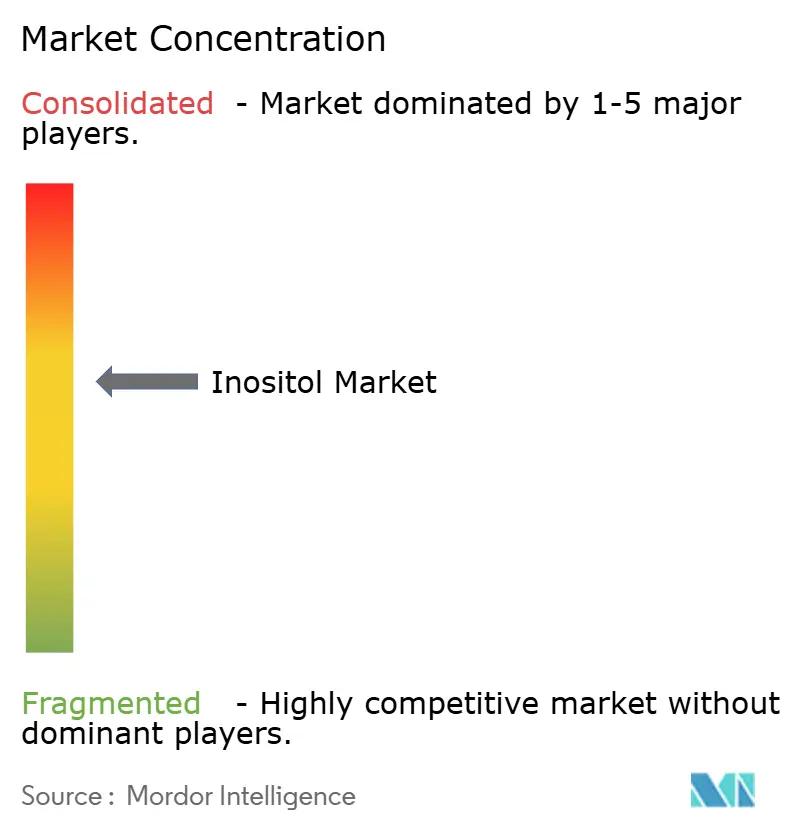
The inositol market shows moderate consolidation, characterized by a balance between established multinational suppliers and regional manufacturers who benefit from cost advantages and local market expertise. Market leaders such as DSM-Firmenich focus on high-value applications and vertical integration across the supply chain, from raw material sourcing to end-product manufacturing. The major players in the market include Koninklijke DSM N.V., Merck KGaA (Sigma-Aldrich), Zhucheng Haotian Pharm Co. Ltd (HOWTIAN), Shandong Runde Biotechnology Co., and Charles Bowman & Company.
Smaller manufacturers struggle to match the competitive edge gained through advanced fermentation techniques, automated process controls, and optimization methods, primarily due to their limited technical resources. These advanced methods enable manufacturers to achieve higher efficiency, better scalability, and improved product consistency, which are critical in maintaining a competitive position. There's been a notable uptick in patent activity, focusing on new production methods and therapeutic applications, especially in innovative microbial strategies and specialized formulations for treating PCOS. This surge in patent filings highlights the industry's focus on innovation and the growing demand for effective and targeted therapeutic solutions.
Precision fermentation methods present emerging opportunities, promising reduced production costs and enhanced purity profiles. These methods leverage advanced biotechnological processes to produce high-quality outputs with minimal impurities, making them highly attractive for pharmaceutical applications. However, high capital demands and the need for technical expertise pose challenges for market entry. Regulatory standards, particularly USP and EP monograph requirements for pharmaceutical-grade products, act as formidable entry barriers, benefiting established manufacturers equipped with advanced quality management and compliance systems. These manufacturers are better positioned to navigate complex regulatory landscapes and meet stringent quality requirements, further solidifying their dominance in the market.
Inositol Industry Leaders
-
Shandong Runde Biotechnology Co
-
Charles Bowman & Company
-
Zhucheng Haotian Pharm Co. Ltd (HOWTIAN)
-
Merck KGaA (Sigma-Aldrich)
-
DSM Firmenich
- *Disclaimer: Major Players sorted in no particular order
Inositol Market Companies Covered in this Report
- DSM Firmenich
- Merck KGaA (Sigma-Aldrich)
- Zhucheng Haotian Pharm Co. Ltd (HOWTIAN)
- T.J. Clark & Company
- Hebei Yuwei Biotechnology Co. Ltd
- Jingkai Biotechnology
- Shandong Runde Biotechnology Co.
- Charles Bowman & Company
- Asiamerica Group Inc.
- Ronas Chemicals Ind. Co. Ltd
- TSUNO Co., Ltd.
- Showa Denko K.K.
- Cargill, Incorporated
- Archer-Daniels-Midland Company
- Ningbo Zhenhai Finipharma Co. Ltd
- Suning Chemicals
- Carbone Scientific
- Xi'an Healthful Biotechnology Co. Ltd
- Thermo Fisher Scientific (Acros)
- TLC Pharmaceutical Standards

Market Opportunities and Future Outlook
Regulatory and commercial signals are widening the addressable formulation space for inositol beyond its established supplement footprint. In North America, FDA engagement via GRAS pathways (including the 2025 no-questions letter associated with GRN 001198) supports broader use as a nutrient supplement in defined food categories. This enables product developers to build compliant beverage and dairy-adjacent fortification concepts without relying only on capsule formats.
Supply chain and ingredient-format whitespace is also evident in the shift toward precision fermentation and expanded distribution access. In May 2026, DMC Biotechnologies and LBB Specialties announced a distribution partnership covering precision-fermentation-derived myo-inositol and D-chiro-inositol in the United States and Canada, which lowers commercialization friction for brands emphasizing traceability and consistent purity. In Europe, the July 2025 European Commission position that D-chiro-inositol is not a novel food supports pan-EU dietary supplement commercialization, creating room for more standardized multi-country product rollouts and for combination protocols that use both myo-inositol and D-chiro-inositol in targeted womens health and metabolic formulations.
Recent Industry Developments in Inositol Market
- May 2026: DMC Biotechnologies and LBB Specialties announced a distribution partnership for precision-fermentation-derived myo-inositol and D-chiro-inositol in the United States and Canada. The partnership expands commercial reach for fermentation-based isomers and supports customers seeking tighter traceability and consistent purity for supplements and nutrition formulations.
- July 2025: The European Commission declared D-chiro-inositol not to be a novel food, enabling its use in dietary supplements across EU member states. This clarified the regulatory pathway for cross-border supplement launches and supports wider adoption of D-chiro-inositol in womens health protocols that pair it with myo-inositol.
- April 2024: Merck KGaA announced a EUR 300 million investment to build an Advanced Research Center at its global headquarters in Darmstadt, Germany, with completion targeted for early 2027. The facility focus on biotechnology and pharmaceutical development aligns with higher-purity ingredient and process innovation needs that influence pharma-grade inositol quality expectations.


Inositol Market Report Scope and Research Methodology
Market Definition and Coverage
For this study, the inositol market is defined as revenues generated from selling inositol ingredients (including plant-based and synthetic forms, and key isomers) into commercial applications such as dietary supplements, beverages, pharmaceuticals, and animal feed, across major global regions.
Scope exclusions: We exclude finished branded consumer products, retail margins, and downstream services, and we count only the ingredient value captured within the defined applications.
Segments Covered in This Report
-
Source
- Plant-based Inositol
- Synthetic Inositol
-
Type
- Myo-inositol (MI)
- D-chiro-inositol (DCI)
-
Application
- Dietary Supplement
-
Food and Beverage
- Beverages
- Infant Formula
- Others
- Pharmaceutical Industry
- Other Applications (animal feed, personal care and cosmetics)
-
Geography
-
North America
- United States
- Canada
- Mexico
- Rest of North America
-
Europe
- Germany
- United Kingdom
- France
- Italy
- Russia
- Spain
- Rest of Europe
-
Asia-Pacific
- India
- China
- Australia
- Japan
- Rest of Asia-Pacific
-
South America
- Brazil
- Argentina
- Rest of South America
-
Middle-East and Africa
- Saudi Arabia
- South Africa
- Rest of Middle-East and Africa
-
North America
Data Sources, Market Sizing, and Validation
Desk Research
Desk research started with building a clean fact base on inositol demand drivers and supply availability, then mapping where value is created along the ingredient chain. We relied on public sources such as USDA crop and corn-related statistics, US FDA ingredient and regulatory information, EFSA scientific opinions, UN Comtrade trade data for relevant chemical and nutritional ingredient codes, and peer-reviewed clinical literature indexed in PubMed.
To make the model workable for commercial planning, we also reviewed company annual reports, investor presentations, product catalogs, and credible press coverage for capacity additions, pricing direction, and end-use adoption signals. In parallel, a paid subscription for company financials and news was used selectively to confirm corporate actions and to sanity-check revenue exposure where disclosures were available. These sources are illustrative and not exhaustive, and we used additional public references for cross-checks and clarification during the work.
Primary Interviews and Surveys
Primary work focused on validating how inositol demand is split across supplements, beverages, pharma, and feed, and how plant-based versus synthetic supply is positioned in different regions. We spoke with a mix of ingredient suppliers, distributors, formulators, and procurement and product leaders. Coverage was balanced across APAC, EMEA, and the Americas so regional pricing and adoption assumptions could be tested and corrected where needed.
Distribution of primary research fieldwork respondents
| Company type | Respondent position | Region |
|---|---|---|
| Top tier: 28% | CXOs: 14% | APAC: 52% |
| Mid tier: 54% | Functional/Unit leaders: 37% | EMEA: 29% |
| Smaller Players: 18% | Managers: 49% | Americas: 19% |
Market-Sizing & Forecasting
Market sizing used a top-down approach that reconstructs demand by linking each major end-use to a realistic consumption pool, then converting this pool into ingredient volumes and values. For inositol, key inputs included supplement adoption intensity (particularly women's health positioning), infant and functional beverage formulation activity, monogastric feed inclusion trends, and the split between myo-inositol and D-chiro-inositol where applicable.
After the demand pool was established, pricing assumptions were built from observed ranges in trade quotes and procurement feedback, then adjusted for region and grade where differences were repeatedly reported. Totals were corroborated with selective bottom-up checks such as supplier revenue exposure signals, distributor channel checks, and sampled price times volume calculations. This helped identify gaps when smaller regional suppliers were underrepresented in public information.
Forecasts were produced using scenario analysis supported by a lighter multivariate view of drivers. Variables such as corn input cost direction, fermentation and manufacturing yield improvements, regulatory acceptance, and end-market growth outlook were stress-tested with primary experts. When data was thin, assumptions were kept explicit and were only extended after they aligned with at least two independent market signals.
Data Validation & Update Cycle
Validation was done through stepwise triangulation across the demand build, the price logic, and the cross-check totals, so large variances were surfaced early rather than carried into the final number. Analysts compared outputs against independent signals such as trade movements, public capacity news, and implied consumption intensity by application, then reviewed anomalies in more detail before sign-off.
Where differences remained material, respondents were re-contacted to confirm whether the gap came from scope boundaries, regional price dispersion, or timing effects such as temporary shortages. The report is refreshed annually, and interim updates are made when major events occur that can move supply, pricing, or demand. Before delivery, an analyst performs a fresh pass on key assumptions so clients receive the latest updated view.
Mordor Intelligence's Inositol Market Size Compared Against Other Published Estimates
Published inositol market values often vary because firms do not always count the same product boundary, the same application set, or the same year timing, even when the titles look identical. Differences also show up when one model leans heavily on a single data series, while another blends demand indicators with price checks.
By tracking application-wise demand pools and refreshing regional price assumptions, Mordor Intelligence keeps the 2026 total tied to ingredient revenues in supplements, beverages, pharma, and feed, instead of mixing in finished product value or unrelated chemical derivatives.
Benchmark comparison
| Source | Market Size | Gaps in Research Methodology |
|---|---|---|
| Mordor Intelligence | USD 0.41 B (2026) | |
| Global Consultancy A | USD 0.46 B (2026) | This estimate appears to use a higher assumed price and faster value uplift across applications, and it may apply a broader inclusion of premium grades without clearly separating ingredient value from downstream formulation markups. |
| Industry Research Outlet B | USD 0.17 B (2024) | This number is anchored to an earlier year and seems to reflect a narrower captured scope, which can happen when only selected sources or forms are counted and regional coverage is not consistently normalized to a single currency timing. |
The comparison shows that the spread is mostly explained by year selection and what is counted as market value, along with how pricing is carried forward. Our approach stays traceable because each application demand driver is linked to a stated volume logic and then converted using region-aware pricing checks, which makes the total easier to reproduce and update.


Key Questions Answered in the Report
What is the projected revenue for the inositol market by 2031?
Global revenue is expected to reach USD 643.99 million by 2031, rising at a 9.19% CAGR from 2026 levels.
Which region will grow the fastest through 2031?
South America is forecast to expand at a 9.76% CAGR, led by Brazil’s booming dietary supplement sector.
Why are synthetic inositol grades gaining traction?
Advances in precision-fermentation have reduced unit costs and improved purity consistency, making synthetic grades attractive for pharmaceutical use.
How does inositol support PCOS management?
Clinical evidence confirms that combined myo-inositol and D-chiro-inositol therapy restores insulin sensitivity and ovarian function with favorable tolerability.
Page last updated on:


 Your data is secure and never sold or shared.


