Inorganic Salts Market Size and Share
Market Overview
| Study Period | 2021 - 2031 |
|---|---|
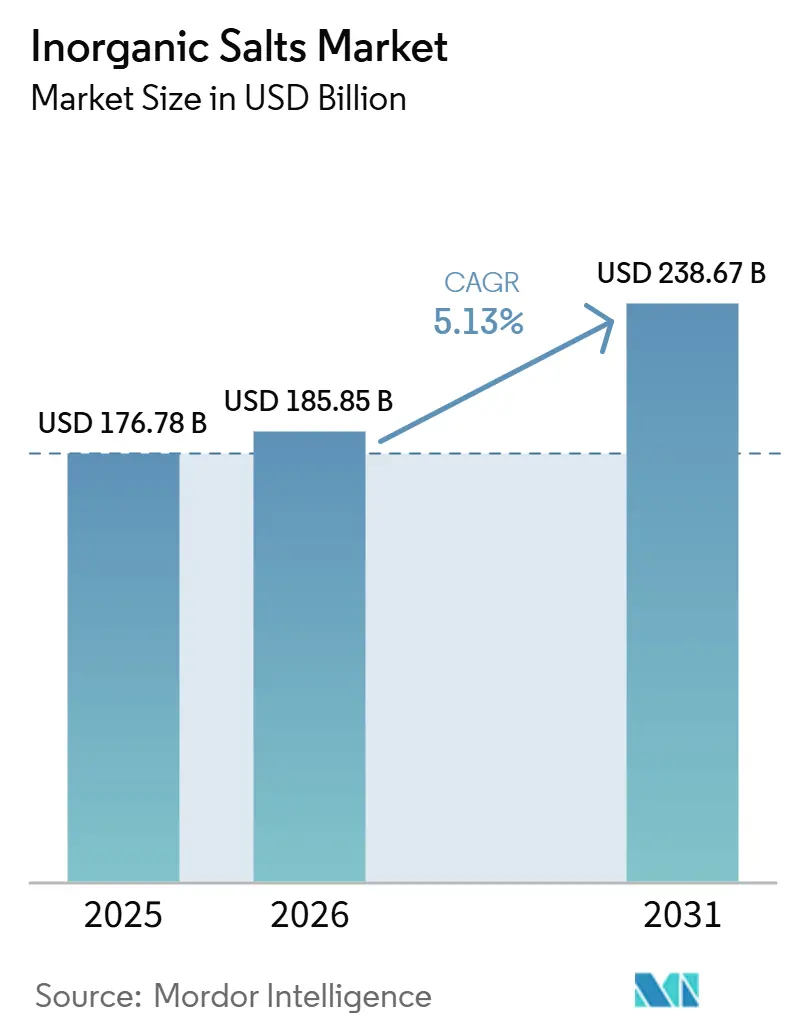
| Market Size (2026) | USD 185.85 Billion |
| Market Size (2031) | USD 238.67 Billion |
| Growth Rate (2026 - 2031) | 5.13% CAGR |
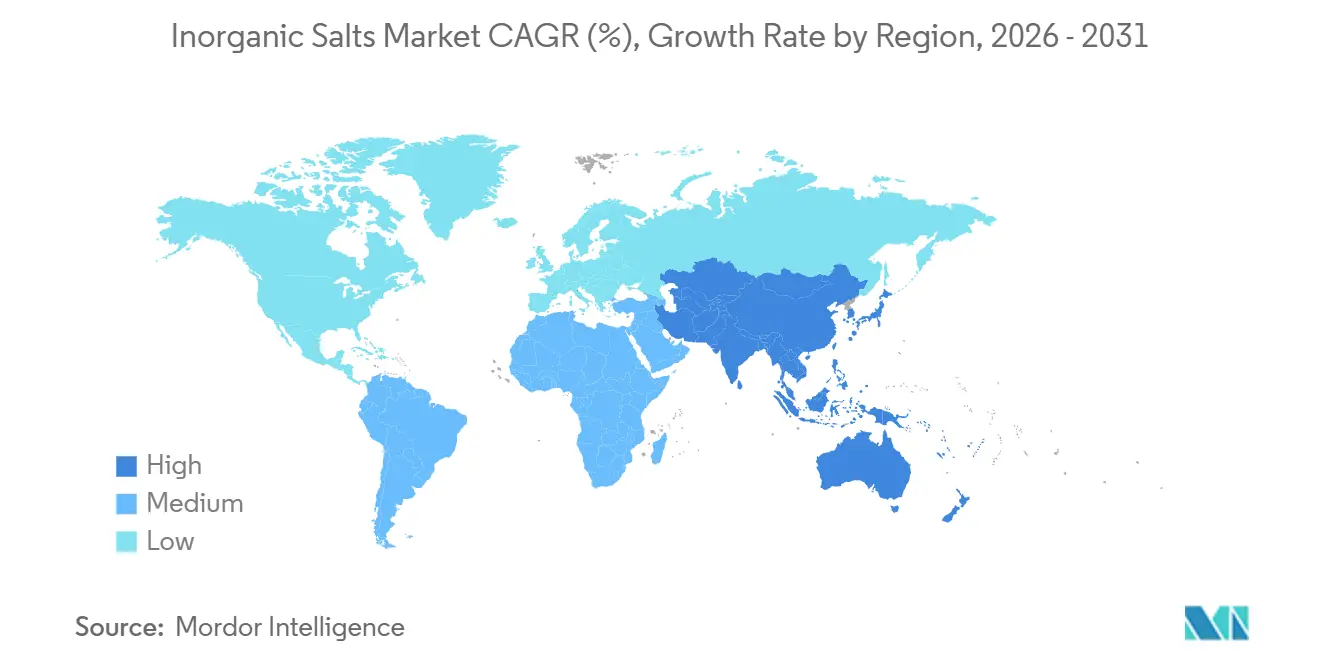
| Fastest Growing Market | Asia Pacific |
| Largest Market | Asia Pacific |
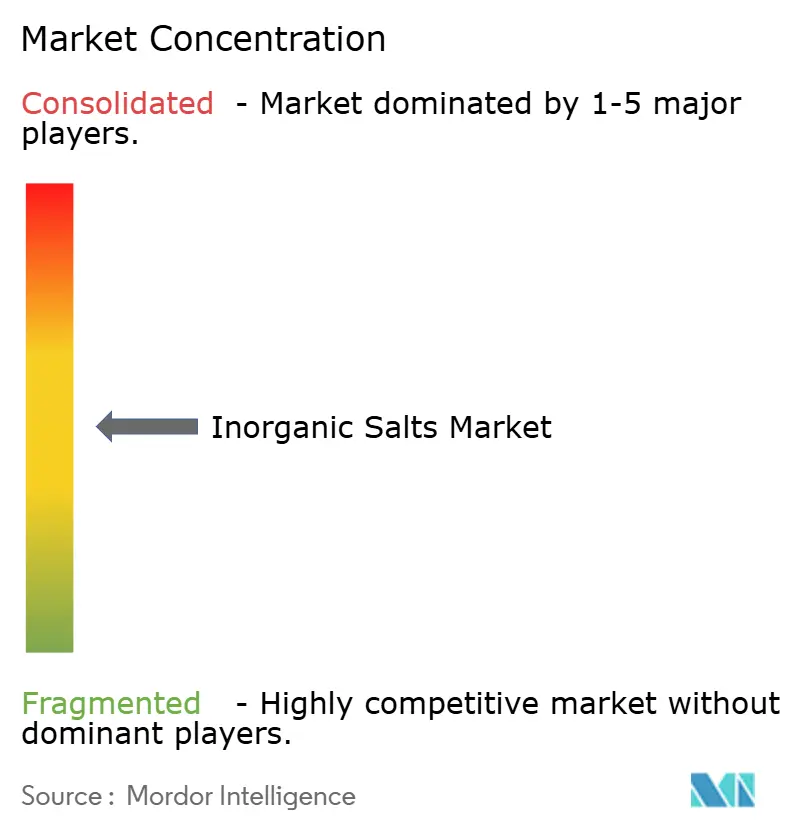
| Market Concentration | Medium |
Major Players *Disclaimer: Major Players sorted in no particular order Image © Mordor Intelligence. Reuse requires attribution under CC BY 4.0. | |
Inorganic Salts Market Analysis by Mordor Intelligence
The Inorganic Salts Market size is projected to expand from USD 176.78 billion in 2025 and USD 185.85 billion in 2026 to USD 238.67 billion by 2031, registering a CAGR of 5.13% between 2026 and 2031. Rising demand for pharmaceutical-grade sodium chloride in intravenous solutions, expanding desalination capacity across water-stressed regions, and sovereign strategies to localize battery-salt supply continue to underpin steady volume growth even as bulk fertilizer prices normalize. Energy-storage electrolytes led by lithium hexafluorophosphate and emerging potassium chemistries create the fastest value pools as battery makers diversify beyond China-centric sourcing. Meanwhile, environmental scrutiny on chloride discharge and brine-mining tailings increases compliance costs, rewarding vertically integrated players that control both processing technology and wastewater treatment. Competitive intensity remains moderate since integrated majors dominate commodity potash, yet specialty lithium-salt niches stay fragmented, allowing premium-margin entrants to thrive.
Key Report Takeaways
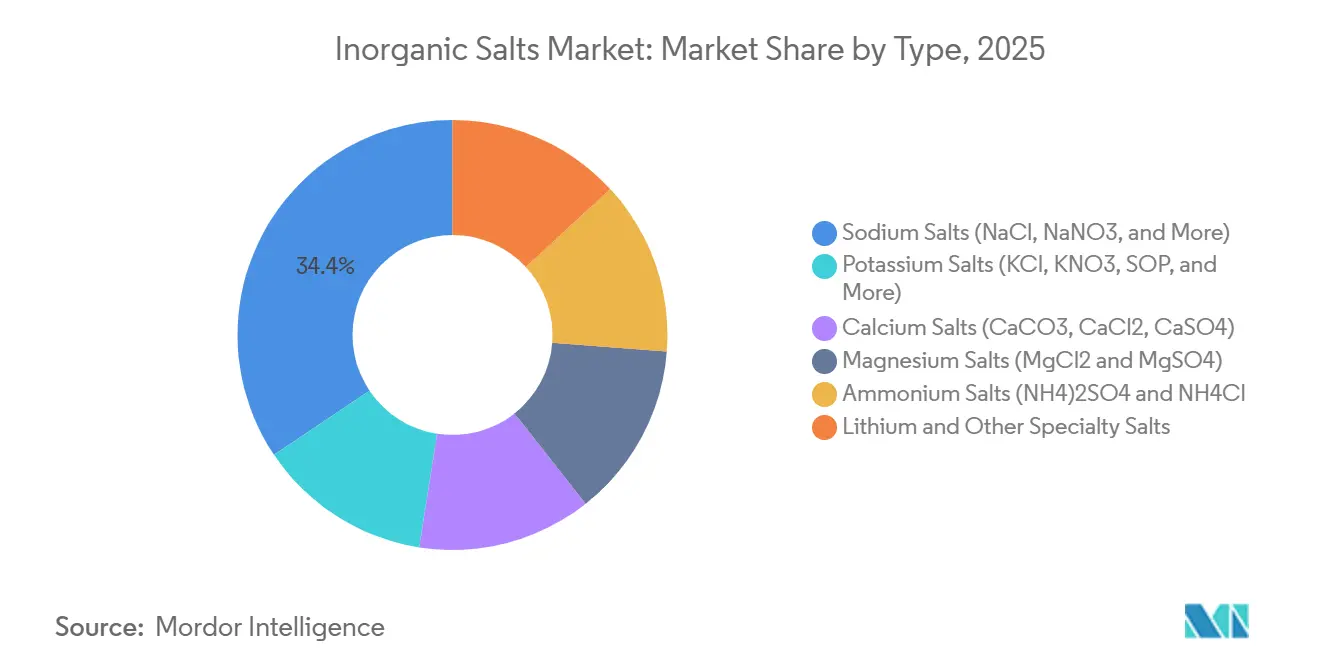
- By type, sodium salts accounted for 34.41% of the inorganic salts market share in 2025, while lithium and other specialty salts are advancing at a 5.78% CAGR through 2031.
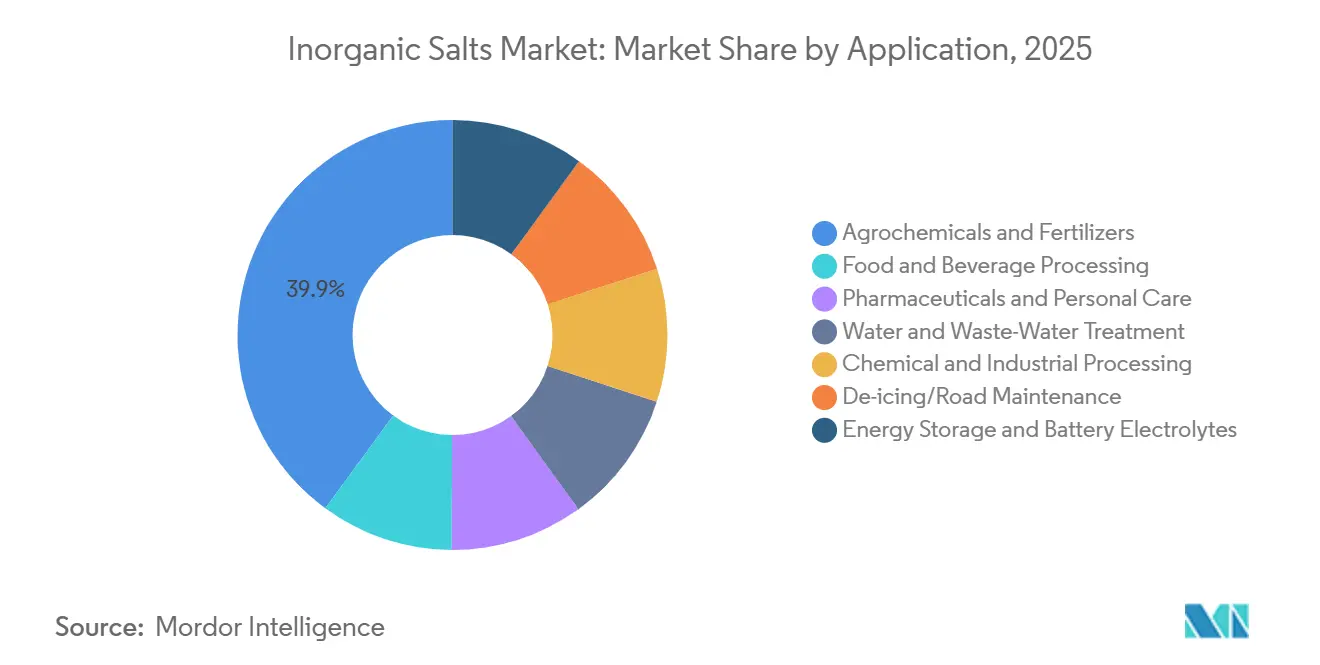
- By application, agrochemicals and fertilizers held 39.92% of the inorganic salts market size in 2025, whereas energy storage and battery electrolytes represent the fastest-growing use-case at a 5.71% CAGR to 2031.
- By geography, Asia-Pacific commanded a 40.45% share of the inorganic salts market in 2025 and is poised for the quickest regional expansion with a 5.98% CAGR during the forecast horizon (2026-2031).
Note: Market size and forecast figures in this report are generated using Mordor Intelligence’s proprietary estimation framework, updated with the latest available data and insights as of January 2026.
Global Inorganic Salts Market Trends and Insights
Drivers Impact Analysis*
| Driver | (~) % Impact on CAGR Forecast | Geographic Relevance | Impact Timeline |
|---|---|---|---|
| Expanding municipal and industrial water-treatment capacity | +0.9% | Global focus, highest in North America and Middle East | Medium term (2-4 years) |
| Robust pharmaceutical-grade NaCl offtake | +0.7% | North America and European Union | Short term (≤ 2 years) |
| Boom in low-sodium functional food formulations | +0.6% | Early adoption in North America and Western Europe | Medium term (2-4 years) |
| Rise of potassium-based battery chemistries | +1.1% | China, Japan, South Korea with spill-over to North America | Long term (≥ 4 years) |
| Magnesium-chloride uptake in carbon-capture contactors | +0.5% | Pilot projects in European Union and North America | Long term (≥ 4 years) |
| Source: Mordor Intelligence | |||
Expanding Municipal And Industrial Water-Treatment Capacity
Reverse-osmosis facilities use sodium chloride for resin regeneration and membrane flushing, creating a structural demand floor that grows with desalination mandates. Texas already runs 60 municipal plants totaling 172 million gallons per day and targets 412,000 acre-feet annually by 2070, while El Paso’s Kay Bailey Hutchison plant processes 27.5 million gallons daily. Kaukauna Utilities in Wisconsin invested USD 35 million in 2025 for a reverse-osmosis system that specifies pharmaceutical-grade salt, showing how potable-water standards lift purity requirements[1]Kaukauna Utilities, “Water System Upgrade,” kaukaunautilities.com. Semiconductor fabs and drug makers demand ultra-low heavy-metal content, splitting the sodium-chloride supply into commodity bulk and certified specialty. Similar trends at Middle Eastern desalination hubs secure long-run growth independent of fertilizer cycles.
Robust Pharmaceutical-Grade NaCl Offtake
Intravenous saline, dialysis concentrates, and drug diluents require sodium chloride meeting stringent pharmacopeia monographs with impurity limits below 0.01%. Baxter’s 2024 hurricane-related shortage highlighted single-source risk, prompting the Food and Drug Administration (FDA) to fast-track new import permits. Tata Chemicals answered with a GBP 60 million (USD 76 million) U.K. plant announced in 2025 to serve European parenteral-solution makers under ISO 9001 and GMP (Good Manufacturing Practice) certification. Clinical guidance now supports sodium-bicarbonate infusions for metabolic acidosis, widening therapeutic demand[2]Frontiers in Nutrition, “Clinical Use of Sodium Bicarbonate,” frontiersin.org. Aging populations keep dialysis salt volumes steady, and hospital stockpiling smooths seasonality.
Boom In Low-Sodium Functional Food Formulations
Health campaigns push manufacturers to replace sodium chloride with potassium chloride, calcium chloride, and magnesium sulfate blends that cut sodium by as much as 50%. Cargill’s Salt Sense and ViaTech lines combine potassium chloride with flavor enhancers and have won packaged-food contracts worldwide. Peer-reviewed Nutrients studies show potassium-enriched substitutes reduce systolic pressure by up to 5 mmHg, reinforcing regulatory guidance. The WHO seeks a 30% sodium reduction in processed foods by 2025, fueling reformulation despite potassium chloride’s 2-to-3-fold premium over sodium. Calcium chloride secures cheese and canned-vegetable applications, while magnesium sulfate gains traction in sports beverages. Supply chains, therefore, shift from single-ingredient salt toward multi-mineral blends that reward formulation expertise.
Rise Of Potassium-Based Battery Chemistries
Potassium-ion batteries cost less than lithium equivalents and suit stationary storage where weight is less critical, though energy density lags by 20-30%. CATL began a potassium-ion pilot line in 2024, signaling tier-one interest. Electrolytes based on potassium bis(fluorosulfonyl)imide promise wider voltage windows, yet global production remains subscale. Kanto Denka’s 2025 expansion of lithium hexafluorophosphate to 8,000 tons per year shows electrolyte bottlenecks can ease only with fresh investment. India’s Neogen-Morita venture targets localized LiPF₆ and may extend to potassium chemistries as geopolitical supply diversification deepens.
Restraints Impact Analysis*
| Restraint | (~) % Impact on CAGR Forecast | Geographic Relevance | Impact Timeline |
|---|---|---|---|
| Heightened environmental scrutiny on brine-mining and tailings | -0.6% | Global, most acute in EU and California | Short term (≤ 2 years) |
| Chloride-discharge limits tightening in EU and United States | -0.5% | North America and European Union | Medium term (2-4 years) |
| High-purity lithium-salt bottlenecks for solid-state batteries | -0.4% | Supply chains in Asia-Pacific and North America | Long term (≥ 4 years) |
| Source: Mordor Intelligence | |||
Heightened Environmental Scrutiny On Brine-Mining And Tailings
Hypersaline tailings threaten aquifers, driving European Union (EU) Horizon 2020 projects such as ZERO BRINE and SEArcularMINE to mandate near-zero liquid discharge, which lifts capex by up to 25%. California now enforces tougher dissolved-solids limits, adding USD 50-100 per tonne to potash or lithium output. Social-license challenges in Chile and Argentina delay new solar projects, limiting supply growth when battery demand rises fastest.
Chloride-Discharge Limits Tightening In EU And United States
The EPA (Environmental Protection Agency)’s freshwater threshold of 230 mg/L and similar EU Water Framework rules compel manufacturers to install additional treatment, boosting caustic-soda costs by USD 2-5 per tonne. States such as Minnesota require pre-wetting and lower application rates that trim road-salt volumes by up to 15%. The European Union (EU) Industrial Emissions Directive revision due 2027 will tighten limits by roughly 20%, pushing half of European chlor-alkali plants toward capital retrofits.
*Our forecasts treat driver/restraint impacts as directional, not additive. The impact forecasts reflect baseline growth, mix effects, and variable interactions.
Segment Analysis
By Type: Specialty Lithium Salts Outpace Commodity Sodium Volumes
Sodium salts accounted for 34.41% of the inorganic salts market share in 2025, yet specialty lithium and allied salts are projected to grow at a 5.78% CAGR through 2031. The inorganic salts market size for lithium-focused products is set to climb sharply as Idemitsu finalizes a 1,000-ton lithium sulfide unit worth CNY 21.3 billion (USD 3.1 billion) by 2027, while Kanto Denka’s electrolyte capacity expansion highlights ongoing supply tightness. Oligopolistic LiPF₆ supply concentrated among three Chinese firms sustains above-trend margins. Potassium chloride and sulfate of potash remain vital for fertilizers, and BHP’s USD 8.4 billion Jansen mine will soon inject 4.15 million tons annually, reinforcing long-run commodity relevance.
Lithium and other specialty grades deliver price realization multiple times higher than sodium chloride because battery and pharmaceutical specifications demand parts-per-billion purity, GMP documentation, and closed-loop processing. Calcium chloride wins in extreme-cold de-icing and cheese-making, while magnesium salts straddle de-icing, pharma, and budding carbon-capture uses. Ammonium salts retain niche roles in fertilizers and metallurgy but face European capacity caps linked to ammonia-emission rules. As energy-storage adoption spreads, value shifts toward high-purity grades, cementing the specialty tier as the long-term growth engine of the inorganic salts market.


By Application: Energy Storage Electrolytes Surge While Fertilizers Hold Volume Share
Agrochemicals and fertilizers represented 39.92% of total revenue in 2025 on the back of large-scale potash and phosphate tonnage delivered by Nutrien and Mosaic. Nonetheless, energy-storage electrolytes will post the fastest 5.71% CAGR through 2031, and the inorganic salts market size attributed to this application is set to expand as LiPF₆, lithium sulfide, and potassium bis(fluorosulfonyl)imide gain traction.
Food and beverage applications stabilize demand for sodium chloride and potassium chloride blends used in flavoring and preservation. Pharmaceutical and personal-care use stands out for its stringent purity needs, with Tata Chemicals’ U.K. plant aimed squarely at post-pandemic supply security. Water treatment adds steady volumes linked to expanding desalination, while industrial soda ash finds continuous offtake from glass and detergent producers supported by China’s 7.8-million-tonne single-train complex. De-icing remains weather-dependent, yet high-performance calcium and magnesium chlorides hold share in northern climates even as regulatory caps dampen total tonnage.
Geography Analysis
Asia-Pacific captured 40.45% of 2025 revenue and is forecast to advance at a 5.98% CAGR through 2031, buoyed by China’s 7.8-million-ton soda ash start-up and India’s RSPL capacity doubling to 1 million tons. Japan’s Idemitsu is investing USD 142 million in lithium sulfide for solid-state batteries, while Neogen-Morita localizes LiPF₆, revealing sovereign battery-supply strategies-in-motion. South Korea and ASEAN electronics hubs drive ultra-pure acid and caustic demand, and shifting capacity to Vietnam and Thailand balances geopolitical risk. China’s hold on 60% of global LiPF₆ output remains a strategic issue for regional battery makers.
North America follows with sizable fertilizer-grade output anchored by Nutrien, Mosaic, and the upcoming 4.15-million-ton Jansen potash mine. Texas desalination plans reach 412,000 acre-feet per year by 2070, ensuring consistent sodium-chloride pull for brine regeneration. EPA chloride-discharge rules slow road-salt growth, yet calcium chloride gains share where performance trumps cost. Canadian diversification into Germany and Canada by K+S shows that geographic spread is a hedge against single-region regulation.
Europe exhibits steady glass and chemical demand but faces compliance cost rises from proposed 2027 Industrial Emissions Directive updates. Tata Chemicals’ pharma-grade plant illustrates how specialty positioning offsets commodity headwinds. ZERO BRINE pilots near-zero liquid discharge for desalination, while Nordic dialysis demand keeps pharmaceutical-grade salt flows stable. South America’s growth leans on Brazil Potash’s 2.4-million-ton project that has locked in 91% offtake and targets 2028 start-up. Indigenous and water-use disputes still delay Chilean lithium capacity, though incumbents with grandfathered permits maintain output.

Competitive Landscape
The inorganic salts market is moderately concentrated. Regulatory hurdles such as ISO 9001 audits, FDA filings, and tighter chloride-discharge permits act as soft entry barriers. K+S illustrates a diversification strategy by running 4 million tonnes in Canada and 5.5 million tonnes in Germany, reducing exposure to any single regulator. Emerging players like Kore Potash pursue African deposits to shorten fertilizer logistics loops, though financing large-scale mines remains a challenge.
Inorganic Salts Industry Leaders
ICL
Nutrien Ltd.
K+S Aktiengesellschaft
Cargill, Incorporated
Compass Minerals
- *Disclaimer: Major Players sorted in no particular order

Recent Industry Developments
- March 2026: Dazhong Mining Co., Ltd. announced plans to sign an Investment Agreement with the Management Committee of Meishan High-tech Industrial Park and Wanhua Chemical (Sichuan) Battery Materials Technology Co., Ltd. The agreement involves co-investing in a 200,000-tonne lithium salt project within Meishan High-tech Industrial Park.
- June 2025: Veolia and Solvay, through their subsidiary Resolest, inaugurated a new unit at the Rosières-aux-Salines site in Meurthe-et-Moselle to enhance capacity. The site recovers salt from flue gas treatment residues after sodium bicarbonate use. The purified brine is then used by Solvay's Dombasle facilities in France to produce sodium carbonate.


Global Inorganic Salts Market Report Scope
Inorganic salts are ionic compounds composed of cations and anions that do not contain carbon-hydrogen bonds, generally formed by the neutralization reaction of an acid and a base. They are essential for biological functions, industrial processes, and agriculture, often appearing as water-soluble, crystalline solids.
The inorganic salts market is segmented by type, application, and geography. By type, the market is segmented into sodium salts (NaCl, NaNO₃, and More), potassium salts (KCl, KNO₃, SOP, and More), calcium salts (CaCO₃, CaCl₂, and CaSO₄), magnesium salts (MgCl₂ and MgSO₄), ammonium salts ((NH₄)₂SO₄ and NH₄Cl), and lithium and other specialty salts. By application, the market is segmented into agrochemicals and fertilizers, food and beverage processing, pharmaceuticals and personal care, water and wastewater treatment, chemical and industrial processing, de-icing/road maintenance, and energy storage and battery electrolytes. The report also covers the market size and forecasts for inorganic salts in 17 countries across major regions. The market sizes and forecasts are provided in terms of value (USD).
| Sodium Salts (NaCl, NaNO₃, etc.) |
| Potassium Salts (KCl, KNO₃, SOP, etc.) |
| Calcium Salts (CaCO₃, CaCl₂, CaSO₄) |
| Magnesium Salts (MgCl₂, MgSO₄) |
| Ammonium Salts (NH₄)₂SO₄, NH₄Cl |
| Lithium and Other Specialty Salts |
| Agrochemicals and Fertilizers |
| Food and Beverage Processing |
| Pharmaceuticals and Personal Care |
| Water and Waste-Water Treatment |
| Chemical and Industrial Processing |
| De-icing/Road Maintenance |
| Energy Storage and Battery Electrolytes |
| Asia-Pacific | China |
| India | |
| Japan | |
| South Korea | |
| ASEAN Countries | |
| Rest of Asia-Pacific | |
| North America | United States |
| Canada | |
| Mexico | |
| Europe | Germany |
| United Kingdom | |
| France | |
| Russia | |
| Italy | |
| Spain | |
| NORDIC Countries | |
| Rest of Europe | |
| South America | Brazil |
| Argentina | |
| Rest of South America | |
| Middle-East and Africa | Saudi Arabia |
| South Africa | |
| Rest of Middle-East and Africa |
| By Type | Sodium Salts (NaCl, NaNO₃, etc.) | |
| Potassium Salts (KCl, KNO₃, SOP, etc.) | ||
| Calcium Salts (CaCO₃, CaCl₂, CaSO₄) | ||
| Magnesium Salts (MgCl₂, MgSO₄) | ||
| Ammonium Salts (NH₄)₂SO₄, NH₄Cl | ||
| Lithium and Other Specialty Salts | ||
| By Application | Agrochemicals and Fertilizers | |
| Food and Beverage Processing | ||
| Pharmaceuticals and Personal Care | ||
| Water and Waste-Water Treatment | ||
| Chemical and Industrial Processing | ||
| De-icing/Road Maintenance | ||
| Energy Storage and Battery Electrolytes | ||
| By Geography | Asia-Pacific | China |
| India | ||
| Japan | ||
| South Korea | ||
| ASEAN Countries | ||
| Rest of Asia-Pacific | ||
| North America | United States | |
| Canada | ||
| Mexico | ||
| Europe | Germany | |
| United Kingdom | ||
| France | ||
| Russia | ||
| Italy | ||
| Spain | ||
| NORDIC Countries | ||
| Rest of Europe | ||
| South America | Brazil | |
| Argentina | ||
| Rest of South America | ||
| Middle-East and Africa | Saudi Arabia | |
| South Africa | ||
| Rest of Middle-East and Africa | ||


Key Questions Answered in the Report
How large will the inorganic salts market be by 2031?
The inorganic salts market is forecast to reach USD 238.67 billion by 2031, expanding at a 5.13% CAGR from 2026 to 2031.
Which salt segment is growing the fastest?
Specialty lithium and allied salts are projected to register a 5.78% CAGR through 2031, outpacing commodity sodium volumes.
What application shows the highest growth momentum?
Energy-storage electrolytes hold the strongest outlook with a 5.71% CAGR as battery demand escalates.
Why is Asia-Pacific leading the market?
Large soda ash and chlor-alkali capacity additions in China and India, coupled with localized battery-salt projects, drive both volume and value.
Page last updated on:


