Market Overview
| Study Period | 2021 - 2031 |
|---|---|
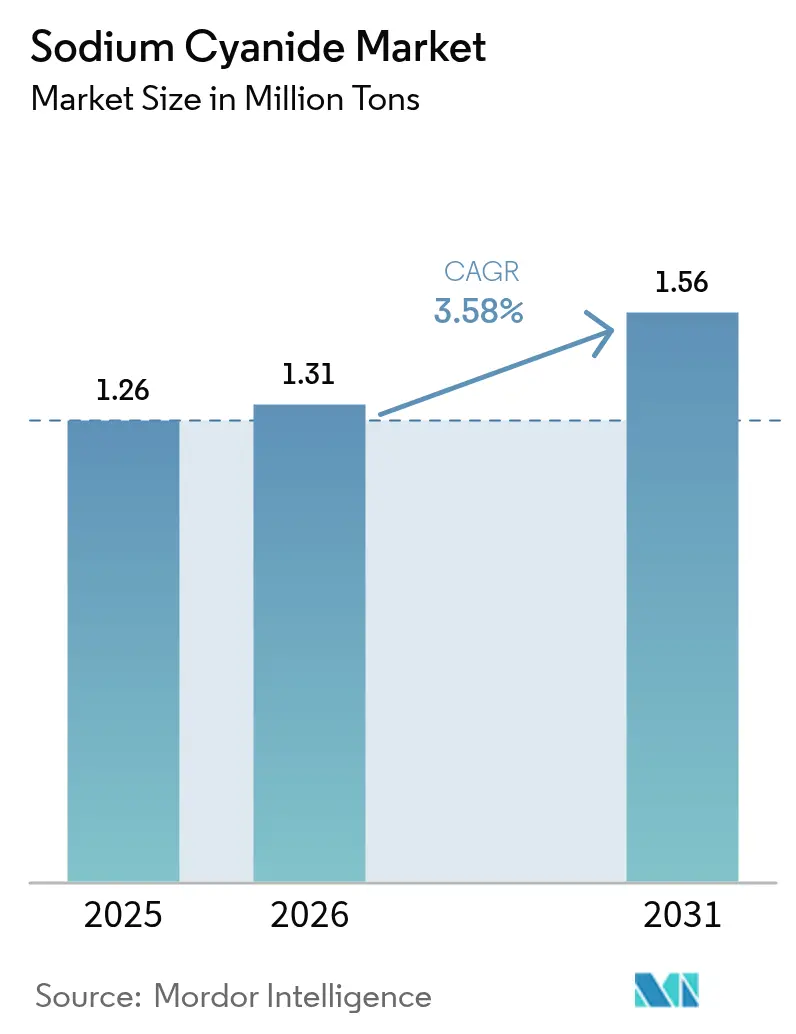
| Market Volume (2026) | 1.31 Million tons |
| Market Volume (2031) | 1.56 Million tons |
| Growth Rate (2026 - 2031) | 3.58% CAGR |
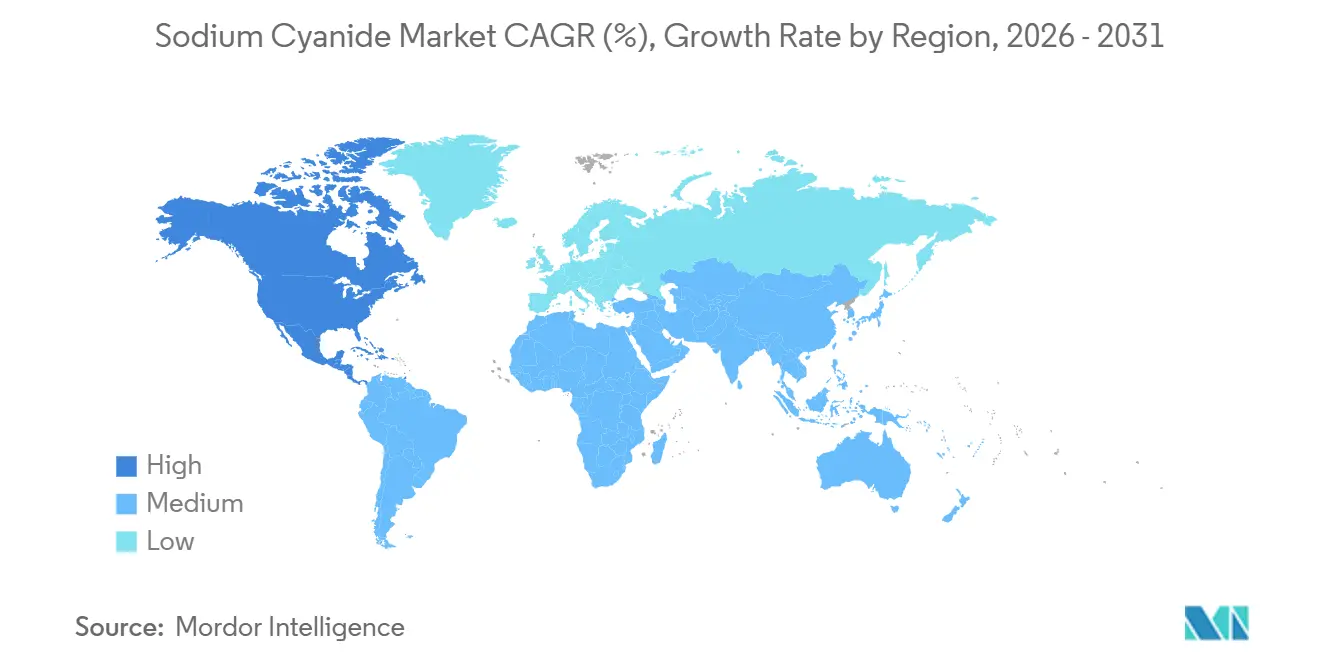
| Fastest Growing Market | North America |
| Largest Market | Asia Pacific |
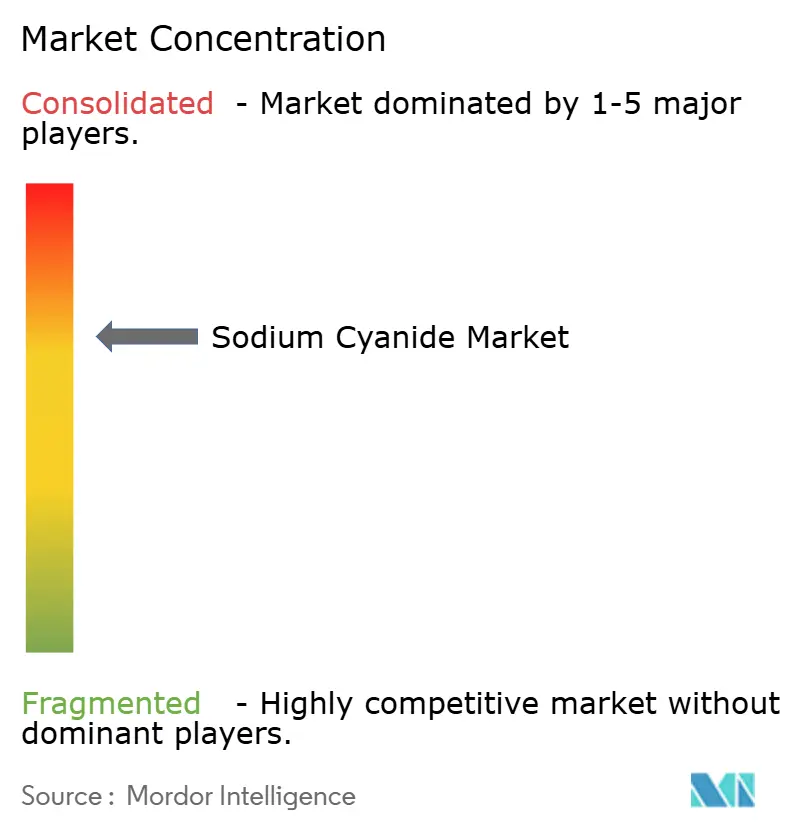
| Market Concentration | Medium |
Major Players *Disclaimer: Major Players sorted in no particular order Image © Mordor Intelligence. Reuse requires attribution under CC BY 4.0. | |
Sodium Cyanide Market Analysis by Mordor Intelligence
The Sodium Cyanide Market size is projected to expand from 1.26 Million tons in 2025 and 1.31 Million tons in 2026 to 1.56 Million tons by 2031, registering a CAGR of 3.58% between 2026 to 2031. Steady demand stems from declining gold ore grades that require higher reagent intensity, regional expansions such as Orica’s post-acquisition capacity uplift, and the emergence of modular on-site plants that curb logistics costs. Heap-leach projects in West Africa and Central Asia continue to set the pace as their lower capital outlays attract investment, while regulatory regimes now weigh greenhouse-gas intensity alongside traditional toxicity metrics. Competitive focus is shifting toward long-term offtake agreements and bundled technical support, especially where freight disruption or winter road closures expose supply-chain risk. Producers are embedding wastewater-recycling systems that recover more than 70% of process water and incinerators that cut manufacturing emissions by nearly 30%, strengthening their audit scores under the International Cyanide Management Code.
Key Report Takeaways
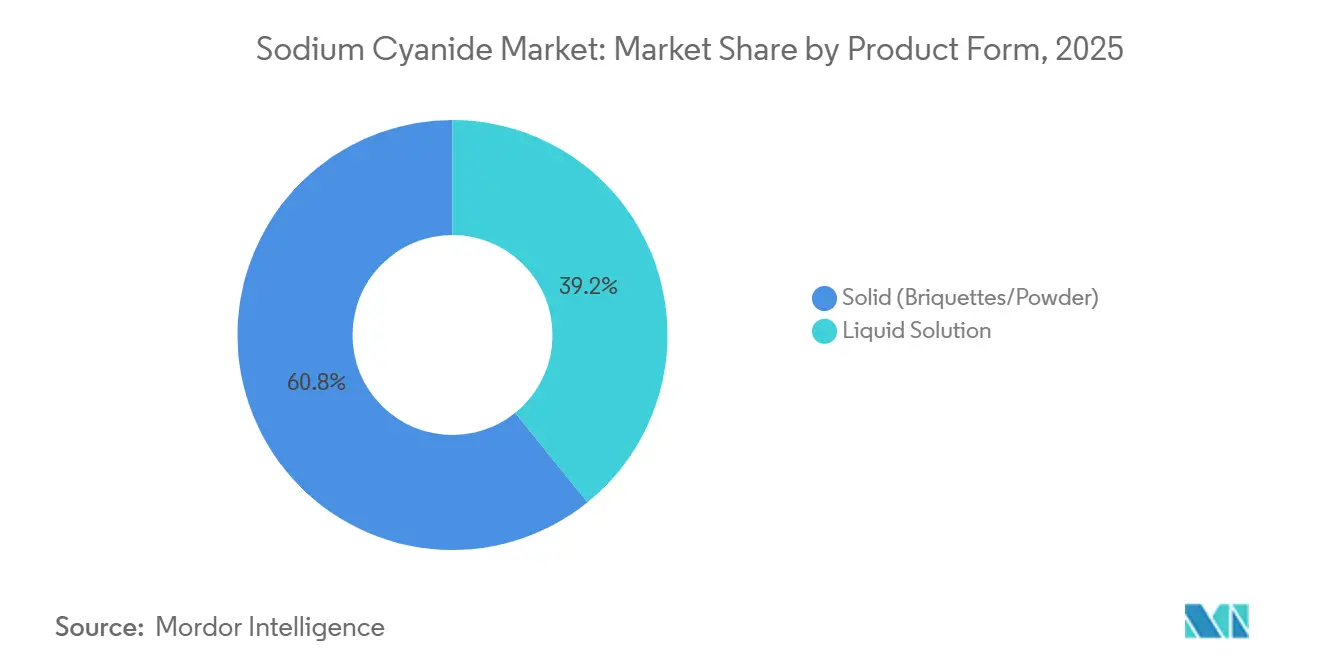
- By product form, solid (briquettes/powder) captured 60.81% of sodium cyanide market share in 2025, while liquid solution is forecast to advance at a 3.72% CAGR through 2031.
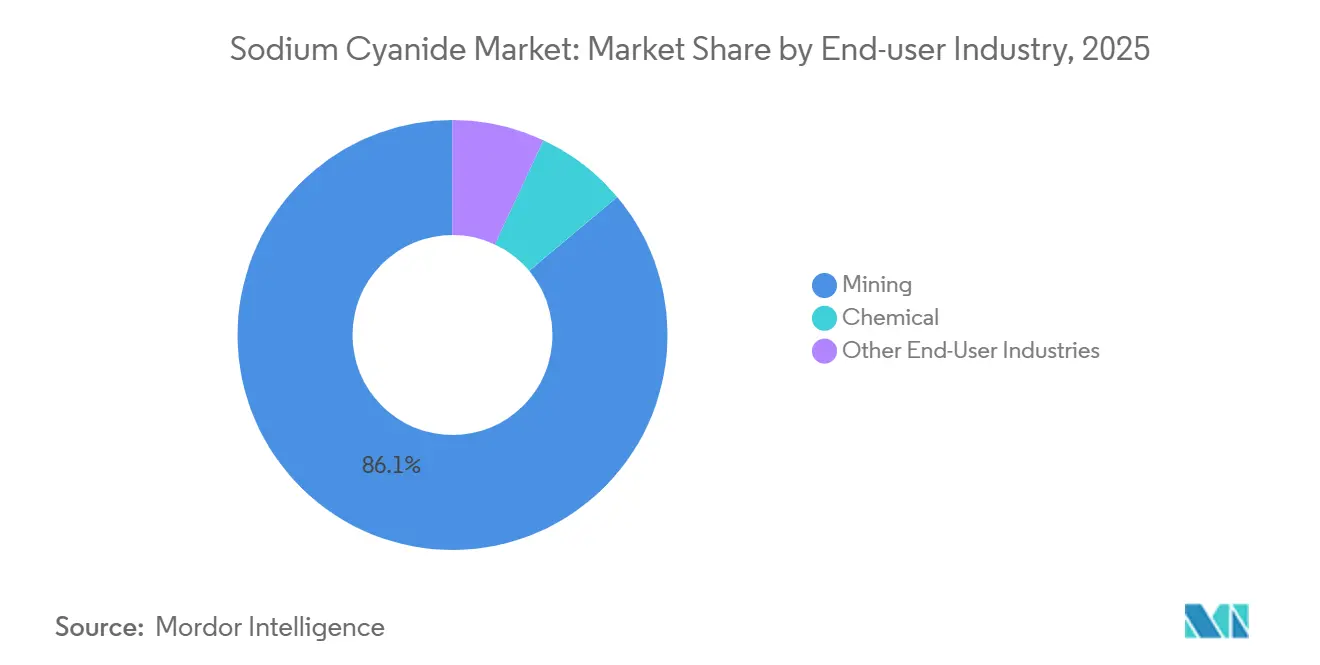
- By end-user industry, mining held 86.11% of the sodium cyanide market size in 2025, while the chemical segment is projected to post 3.95% through 2031.
- By geography, Asia-Pacific led with a 30.12% volume share in 2025, whereas North America is projected to advance at a 3.98% CAGR through 2031.
Note: Market size and forecast figures in this report are generated using Mordor Intelligence’s proprietary estimation framework, updated with the latest available data and insights as of 2026.
Global Sodium Cyanide Market Trends and Insights
Drivers Impact Analysis*
| Driver | (~) % Impact on CAGR Forecast | Geographic Relevance | Impact Timeline |
|---|---|---|---|
| Boom in low-grade gold mining requiring higher NaCN loadings | +1.2% | Global, with concentration in West Africa (Ghana, Burkina Faso), Central Asia (Kazakhstan, Kyrgyzstan), and Latin America (Peru, Argentina) | Medium term (2–4 years) |
| Rising heap-leach projects in Africa and Central Asia | +0.9% | Sub-Saharan Africa (Ghana, Sudan, Tanzania), Kazakhstan, Uzbekistan, Tajikistan | Medium term (2–4 years) |
| Growth of on-site modular NaCN plants lowering logistics cost | +0.6% | Remote mining districts in Australia (Western Australia), Canada (Yukon, Northwest Territories), and South America (Chilean Atacama, Peruvian Andes) | Long term (≥ 4 years) |
| Increasing adoption of cyanide sparging systems in Asia-Pacific mines | +0.5% | Asia-Pacific core (Australia, Indonesia, Papua New Guinea), with spill-over to Southeast Asian greenfield projects | Short term (≤ 2 years) |
| Recovery of silver-bearing tailings in Latin America | +0.4% | Peru (Cerro de Pasco, Junín), Argentina (San Juan, Catamarca), Mexico (Zacatecas, Chihuahua) | Medium term (2–4 years) |
| Source: Mordor Intelligence | |||
Boom in Low-Grade Gold Mining Requiring Higher NaCN Loadings
Falling head grades are driving cyanide dosages from historical 0.5–0.8 kg per tonne to 1.2–1.5 kg per tonne so that recovery stays above 85%. Each 0.1 g/t grade drop can lift per-tonne reagent demand by 10–15%, magnifying volumes even when gold output is flat. West African operators now stipulate monthly deliveries exceeding 200 tons, double those of higher-grade underground mines. Australian forecasts show domestic gold production rising to 377 tons by 2030, yet average grades have slipped below 1.8 g/t, highlighting the sodium cyanide market’s volume leverage. Miners are concurrently installing regeneration loops that recapture up to 12% of free cyanide, partially offsetting higher feed rates.
Rising Heap-Leach Projects in Africa and Central Asia
Heap leaching demands far lower capital—typically USD 50–80 million for a 3–5 Mt/a pad—than conventional mills, unlocking oxide deposits in Ghana, Sudan, and Kazakhstan. Draslovka’s USD 160 million Egyptian plant will feed nearby projects, trimming shipment times to 8–12 days via Red Sea ports. Kazakh initiatives aim at domestic reagent security as border delays hamper imports. Seasonal rainfall in West Africa dilutes solution strength by up to 20%, creating buffer-inventory requirements that favor suppliers offering consignment stock at mine-gate warehouses. Cyanide recovery aims remain above 85%, with deviations below 80% triggering step-ups in fresh reagent orders.
Growth of On-Site Modular NaCN Plants Lowering Logistics Cost
Mines located more than 500 km from ports contend with freight and insurance premiums that lift delivered cost by 15–25%. Skid-mounted units producing 10,000–30,000 t/y sodium cyanide cut working capital tied to inventory by up to 40% and remove the freeze-thaw risk of winter haulage. Australian Gold Reagents is integrating a low-emissions incinerator that slices plant-level CO₂ intensity by 28% and serves as a blueprint for mine-site modules. The trade-off is reliance on concentrated hydrogen-cyanide feedstock from a handful of suppliers, shifting risk from freight to precursor availability.
Recovery of Silver-Bearing Tailings in Latin America
Legacy dams in Peru’s Cerro de Pasco contain around 120 Mt of tailings at 50 g/t silver, now reprocessed using cyanide dosages of 1.5–2.5 kg per tonne of solids with 70–80% recovery[1]United Chemical Company, “Tailings Reprocessing Initiatives,” unitedchemical.kz, unitedchemical.kz . At silver prices of USD 28–32 per oz, internal rates of return surpass 18%. Argentina and Mexico are experimenting with lower-cost heap approaches that accept reduced recovery to minimize reagent spend. Tailings projects bypass exploration lead times, so sodium cyanide demand here is projected to grow faster than in primary ore processing through 2031.
Restraints Impact Analysis*
| Restraint | (~) % Impact on CAGR Forecast | Geographic Relevance | Impact Timeline |
|---|---|---|---|
| Toxicity and tightening ICMC compliance audits | -0.8% | Global, with stringent enforcement in North America (U.S., Canada), Australia, and European Union member states; emerging rigor in West Africa (Ghana, Côte d'Ivoire) | Short term (≤ 2 years) |
| Pilot-scale switch to glycine/thiosulphate lixiviants | -0.3% | Localized trials in Australia (Western Australia), Canada (Ontario, British Columbia), and select European projects; limited commercial deployment | Long term (≥ 4 years) |
| High marine freight premiums for hazardous cargoes | -0.5% | Trade lanes from Asia-Pacific (China, Australia) to Africa and South America; intra-European shipments; trans-Pacific routes to North America | Medium term (2–4 years) |
| Source: Mordor Intelligence | |||
Toxicity and Tightening ICMC Compliance Audits
The Code now insists on secondary containment sized for the largest tank plus piping, fixed monitors, and community outreach in local languages. Newmont’s Ghana project invested in triple-coated concrete bunds and leak-detection pumps, spending USD 3–5 million for compliance[2]WSP Group Africa, “ICMC Compliance Requirements,” wspgroup.com, africa.wsp.com. Annual audit fees top USD 80,000 and suppliers must maintain chain-wide certification, pushing smaller blenders toward consolidation. Mines that miss audits risk offtake cancellations and financing delays, steering procurement toward established, audit-ready vendors.
Pilot-Scale Switch to Glycine/Thiosulphate Lixiviants
Alternative lixiviants consume three- to five-fold more reagent and seldom exceed 80% gold recovery in sulfide-bearing ores. Process windows demand tight pH and temperature control, lifting energy cost by USD 4–6 per tonne. Cyanco’s partnership with Cycladex aims to improve kinetics, but no commercial launch has been declared. Unless carbon taxes surpass USD 80–100 per t CO₂-eq, sodium cyanide retains a decisive cost edge.
*Our forecasts treat driver/restraint impacts as directional, not additive. The impact forecasts reflect baseline growth, mix effects, and variable interactions.
Segment Analysis
By Product Form: Solid Leads as Logistics-Friendly Choice
Solid sodium cyanide commanded 60.81% of 2025 volume, underscoring the segment’s sodium cyanide market share advantage for mines that value long shelf life and lower marine insurance costs. Briquettes resist freezing and allow operators to store several weeks of inventory without solution tanks. Powder serves smaller mills but incurs dust-control packaging expenses.
Liquid solution is projected to grow quickest as mines in remote deserts and high altitudes adopt ISO-tank deliveries that remove dissolution steps and curb hydrogen-cyanide exposure. Automated metering linked to online analyzers trims wastage by up to 8%. However, heated storage and more frequent shipments raise working capital. Suppliers offering hybrid supply contracts—briquettes for base load and solution for peak demand—expect to capture additional sodium cyanide market revenue as process-control systems become more responsive.


By End-user Industry: Mining Dominates While Chemicals Accelerate
Mining accounted for 86.11% of 2025 volume, reflecting sodium cyanide’s unrivaled economics in dissolving gold at sub-2 g/t grades. Typical reagent outlay sits at approximately USD 1.50–2.00 per gram of gold recovered, far below competing lixiviants. Heap-leach projects now elevate loadings to 1.2–1.5 kg per tonne, locking in a stable pull on the sodium cyanide market.
The chemical segment is expanding on demand from nitrile pharmaceuticals and high-purity electroplating baths. Precise dosing of liquid cyanide boosts batch yields and reduces operator exposure. Draslovka’s push into sodium-ion battery precursors could add 5,000–8,000 t/y by 2030, further diversifying the sodium cyanide industry’s client base. Niche uses in metallurgy, water treatment, and photography collectively represent less than 5% of demand but offer premium pricing for 98–99% purity grades.

Geography Analysis
Asia-Pacific controlled a 30.12% slice of the sodium cyanide market in 2025, supported by China’s export-oriented producers and Australia’s ongoing capacity build-out. Australian Gold Reagents is lifting Kwinana output by 30% to 130,000 t/y to serve a domestic gold sector forecast to reach 377 t of metal by 2030, translating into an incremental 18,000–22,000 t of sodium cyanide per year. Indonesian and Papua New Guinean mines are retrofitting sparging systems that sync cyanide dosing with clay-rich feed fluctuations, and Chinese exporters must now supply documentation proving end-use compliance with the Cyanide Code, bolstering their quality credentials.
North America is positioned for the fastest regional growth, at 3.98% CAGR through 2031. Orica’s USD 640 million purchase of Cyanco doubled regional capacity to 240,000 t/y, anchoring supply for Nevada, Ontario, and British Columbia operations that prefer domestic logistics over trans-Pacific freight. Canada’s northern mines are weighing modular plants to overcome winter road closures that limit deliveries to a few months each year. Mexico’s heap-leach expansions in Zacatecas and Sonora could add another 10,000 t/y of demand by 2029.
Europe’s consumption clusters in Russia and the CIS, where Siberian and Ural complexes tap domestic caustic soda streams for cyanide synthesis. Evonik’s CyPlus subsidiary is exploring waste-heat capture to lower plant emissions ahead of the EU’s carbon-border levies. Kazakhstan’s United Chemical Company has inked memorandums to supply 25,000 t/y from Taraz to Tajik customers, reflecting a wider pivot toward reagent self-sufficiency amidst trade frictions AZH.KZ.
South America relies on Peru, Argentina, and Brazil. Peru’s tailings-reprocessing in Cerro de Pasco applies 1.5–2.5 kg/t cyanide to unlock residual silver, delivering IRRs above 18% at today’s metal prices. Argentine projects accept lower recovery to cut reagent cost but must invest in lined storage for environmental clearance. Brazil’s Unigel dominates liquid supply domestically and exports short-sea to neighbors, leveraging lower insurance fees than trans-Pacific cargos.
Middle-East and Africa focus on Ghana, Sudan, and South Africa. Draslovka’s Egyptian plant will reduce delivery windows to under two weeks for West African mines, slicing freight cost and inventory carry. Newmont’s Ahafo North requires roughly 5,000 t/y of cyanide and has already passed a pre-operational Code audit with upgraded containment and monitoring. Deeper South African reefs and Sudan’s infrastructure gaps create openings for suppliers that combine reagent sales with turnkey handling services.

Competitive Landscape
The sodium cyanide market is moderately concentrated: Orica, Draslovka, TAEKWANG, Australian Gold Reagents, and Anhui Shuguang collectively control roughly 60–66% of global capacity. Orica’s February 2024 acquisition of Cyanco for USD 640 million doubled its footprint to 240,000 t/y and provided North American redundancy, a core selling point during freight bottlenecks. Draslovka’s foray into sodium-ion battery chemicals diversifies revenue streams beyond mining cycles. Australian Gold Reagents is integrating a low-emissions incinerator and wastewater recycling above 70%, aligning with miners’ Scope 1 and 2 reduction goals.
Competition increasingly pivots on service packages—technical audits, regeneration circuit design, and consignment inventory—rather than spot pricing. Chinese entrants undercut incumbents by up to 12% yet struggle to secure long-term offtakes where buyers demand full ICMC certification. Modular on-site synthesis represents a white-space niche: suppliers bundling hydrogen-cyanide feedstock with turnkey plants can command premium margins in regions where haulage exceeds 500 km. Heightened regulatory scrutiny that extends liability upstream to transport partners is hastening consolidation, as smaller distributors lack the compliance infrastructure.
Sodium Cyanide Industry Leaders
Australian Gold Reagents Pty Ltd
Draslovka
Orica Limited
Anhui Shuguang Chemical Group
TAEKWANG INDUSTRIAL CO. LTD
- *Disclaimer: Major Players sorted in no particular order

Recent Industry Developments
- February 2026: DrasChem Specialty Chemicals, an Egyptian private free zone company, initiated the establishment of the Middle-East's first sodium cyanide production plant in Alexandria, Egypt, with an initial investment of USD 200 million. The first phase is designed to achieve an annual production capacity of 50,000 tons of sodium cyanide.
- November 2025: Sasol, the only domestic producer of liquid cyanide in South Africa, declared force majeure following a breakdown at its ammonia plant, significantly impacting the country's gold mining industry. As the sole local supplier of liquid cyanide, this disruption compelled miners to rely on solid cyanide stockpiles.


Global Sodium Cyanide Market Report Scope
Sodium cyanide is a white, crystalline, deliquescent, water-soluble, poisonous powder prepared by heating sodium amide with charcoal. It is used commercially for fumigation, electroplating, extracting gold and silver from ores, and chemical manufacturing.
The sodium cyanide market is segmented by product form, end-user industry and geography. By product form, the market is segmented into solid (briquettes/powder) and liquid solution. By end-user industry, the market is segmented into mining, chemical, and other end-user industries. The report also covers the market size and forecasts for sodium cyanide in 14 countries across major regions. For each segment, the market sizing and forecasts have been done on the basis of volume (Tons).
By Product Form
| Solid (Briquettes/Powder) |
| Liquid Solution |
By End-user Industry
| Mining |
| Chemical |
| Other End-User Industries |
By Geography
| Asia-Pacific | China |
| Australia and New Zealand | |
| Indonesia | |
| Rest of Asia-Pacific | |
| North America | United States |
| Canada | |
| Mexico | |
| Europe | Russia |
| CIS (ex-Russia) | |
| Rest of Europe | |
| South America | Brazil |
| Peru | |
| Argentina | |
| Rest of South America | |
| Middle-East and Africa | Ghana |
| Sudan | |
| South Africa | |
| Rest of Middle-East and Africa |
| By Product Form | Solid (Briquettes/Powder) | |
| Liquid Solution | ||
| By End-user Industry | Mining | |
| Chemical | ||
| Other End-User Industries | ||
| By Geography | Asia-Pacific | China |
| Australia and New Zealand | ||
| Indonesia | ||
| Rest of Asia-Pacific | ||
| North America | United States | |
| Canada | ||
| Mexico | ||
| Europe | Russia | |
| CIS (ex-Russia) | ||
| Rest of Europe | ||
| South America | Brazil | |
| Peru | ||
| Argentina | ||
| Rest of South America | ||
| Middle-East and Africa | Ghana | |
| Sudan | ||
| South Africa | ||
| Rest of Middle-East and Africa | ||


Key Questions Answered in the Report
How fast will sodium cyanide demand grow through 2031?
Global volumes are projected to climb from 1.31 million tons in 2026 to 1.56 million tons by 2031, translating to a 3.58% CAGR.
Which region offers the highest growth potential?
North America shows the strongest outlook, advancing at approximately 3.98% CAGR as reopened deposits and heap-pad retrofits lift consumption.
Why do miners still favor sodium cyanide over alternative lixiviants?
Glycine and thiosulphate routes consume three- to five-times more reagent and rarely exceed 80% recovery, keeping cyanide the most cost-effective option.
What role do modular on-site cyanide plants play?
Skid-mounted units of 10,000–30,000 t/y slash freight premiums and cut inventory working capital by up to 40% in remote districts.
Page last updated on:


