Potassium Sulphate Market Size and Share
Market Overview
| Study Period | 2021 - 2031 |
|---|---|
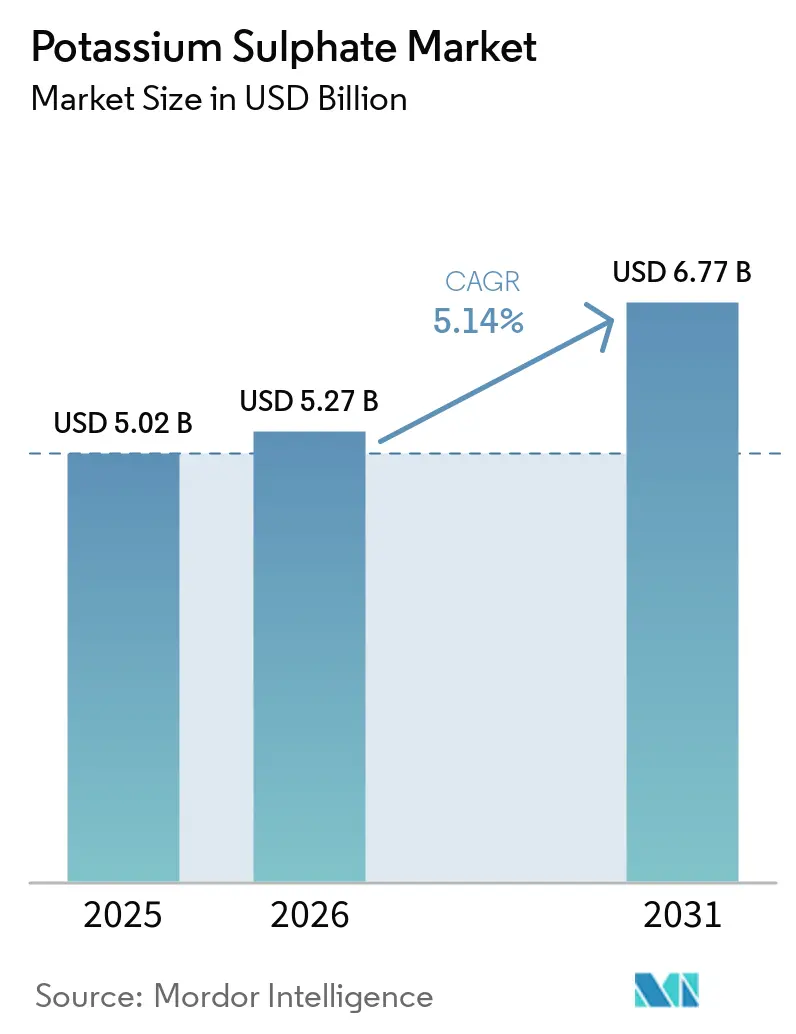
| Market Size (2026) | USD 5.27 Billion |
| Market Size (2031) | USD 6.77 Billion |
| Growth Rate (2026 - 2031) | 5.14% CAGR |
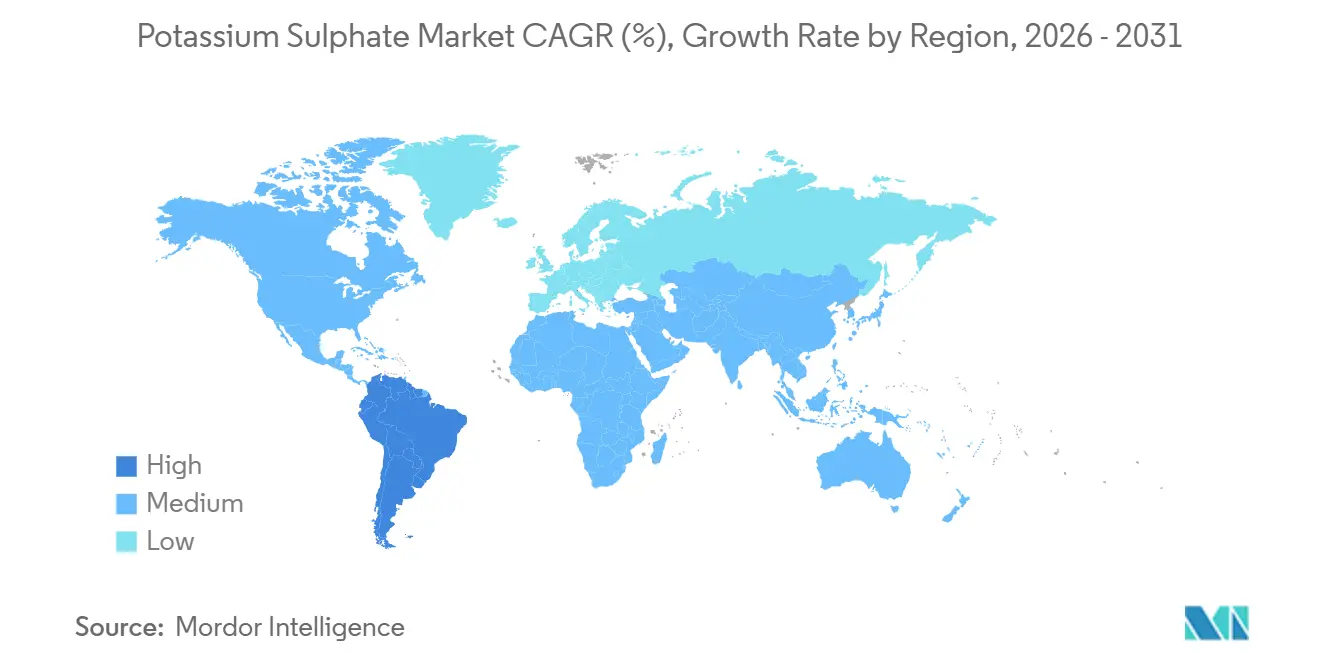
| Fastest Growing Market | South America |
| Largest Market | Asia Pacific |
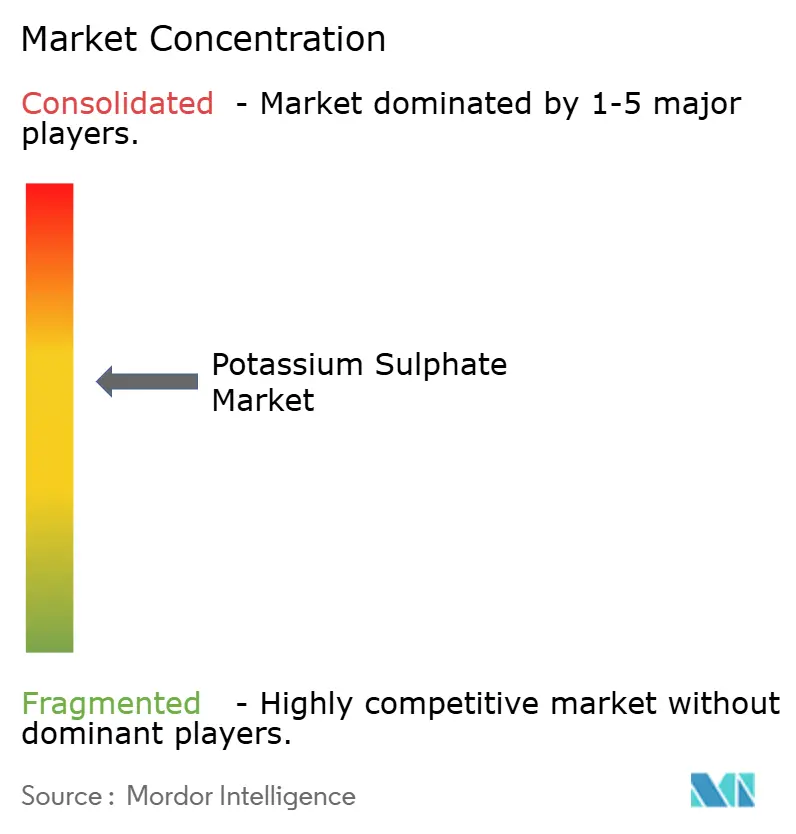
| Market Concentration | Medium |
Major Players *Disclaimer: Major Players sorted in no particular order Image © Mordor Intelligence. Reuse requires attribution under CC BY 4.0. | |
Potassium Sulphate Market Analysis by Mordor Intelligence
The Potassium Sulphate Market size is expected to increase from USD 5.02 billion in 2025 to USD 5.27 billion in 2026 and reach USD 6.77 billion by 2031, growing at a CAGR of 5.14% over 2026-2031. Strong price premiums over muriate of potash, rising adoption in chloride-sensitive crops, and a tight global production base underpin steady value growth. Growing fertigation acreage, decarbonization investments in low-GHG production routes, and South America’s import reliance create additional upside. However, high energy costs for Mannheim units, limited primary ore bodies, and stricter effluent regulations temper supply responsiveness. Incumbents are accelerating capacity expansions, process innovation, and offtake alliances to capture demand while managing regulatory and cost headwinds.
Key Report Takeaways
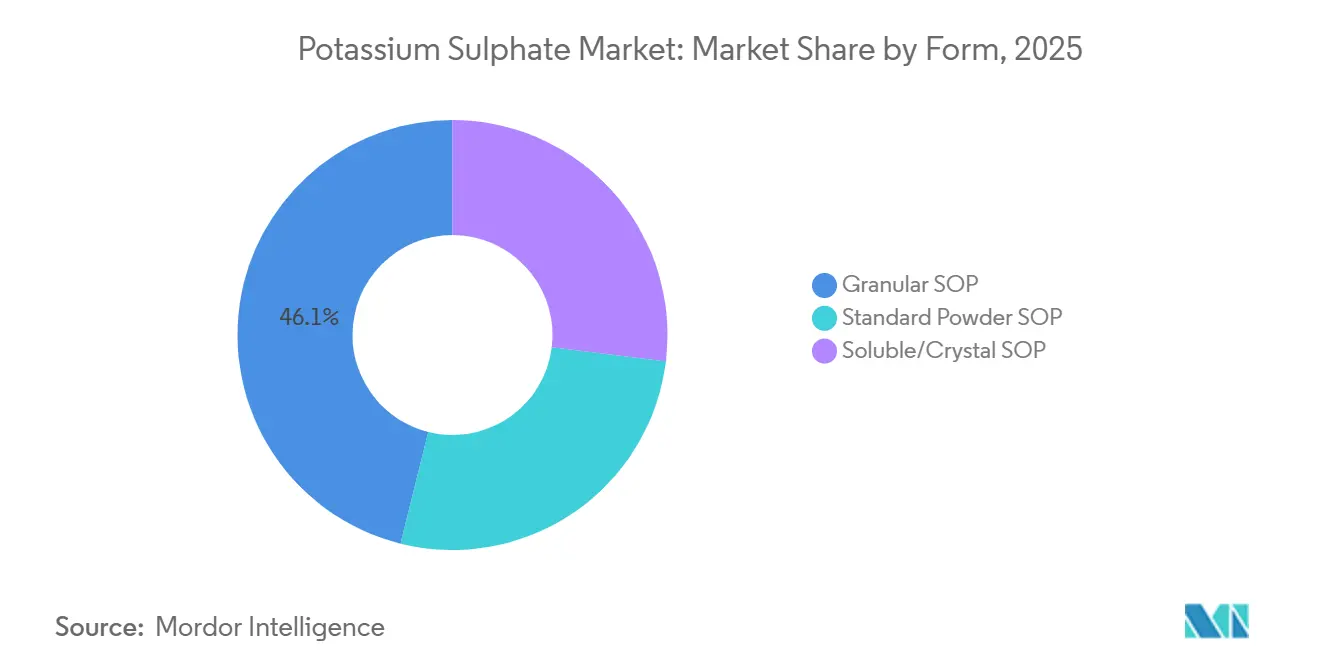
- By form, granular SOP led with 46.12% of the potassium sulphate market share in 2025, while soluble and crystal grades are forecast to post the fastest growth at a 6.04% CAGR through 2031.
- By production process, the Mannheim route held 55.18% share of the potassium sulphate market size in 2025; phosphogypsum conversion is projected to expand at 6.12% CAGR to 2031.
- By application, agriculture dominated with 71.35% share of the potassium sulphate market size in 2025, whereas industrial uses are advancing at a 6.15% CAGR over 2026-2031.
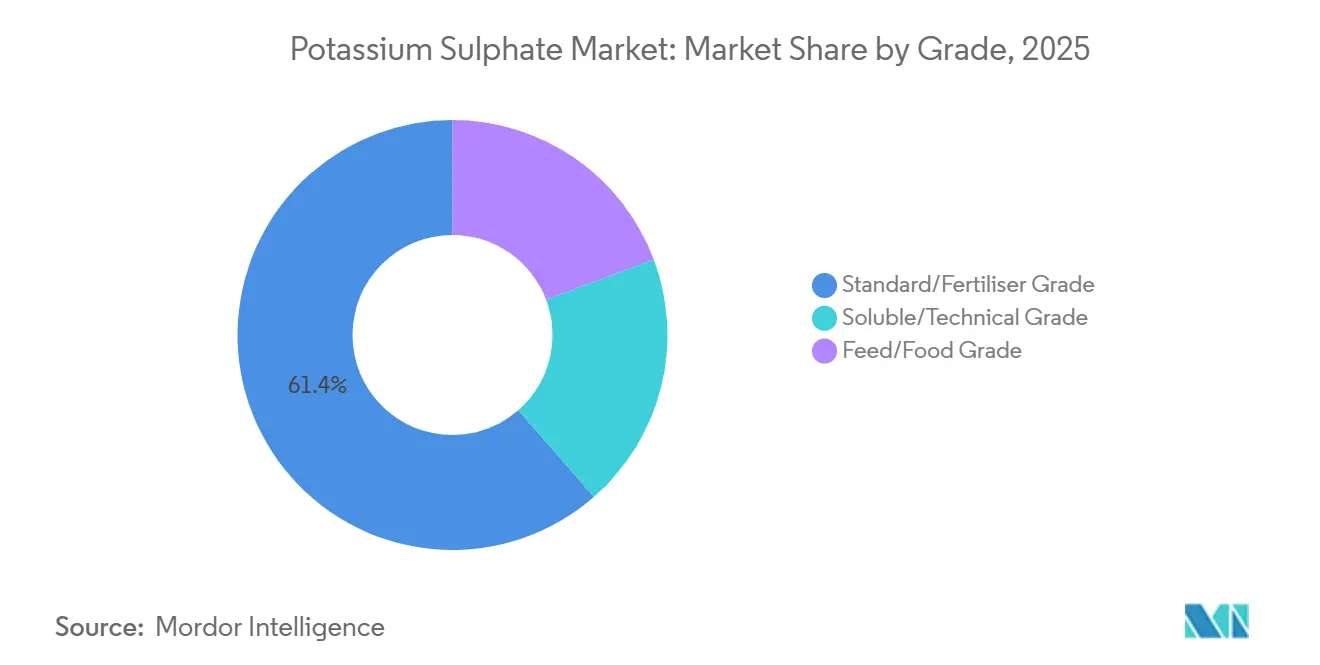
- By grade, standard/fertilizer grade accounted for 61.44% share in 2025, while soluble and technical grades are growing at a 6.09% CAGR to 2031.
- By geography, Asia-Pacific captured 41.22% of the potassium sulphate market share in 2025; South America is expected to register the highest regional CAGR of 6.23% through 2031.
Note: Market size and forecast figures in this report are generated using Mordor Intelligence’s proprietary estimation framework, updated with the latest available data and insights as of January 2026.
Global Potassium Sulphate Market Trends and Insights
Driver Impact Analysis*
| Drivers | (~) % Impact on CAGR Forecast | Geographic Relevance | Impact Timeline |
|---|---|---|---|
| Growing demand for chloride-free potash fertilizers | +1.2% | Global, with concentration in Asia-Pacific, Europe, North America | Medium term (2-4 years) |
| Expansion of high-value horticulture acreage | +0.9% | South America (Brazil, Argentina), Asia-Pacific (China, India, ASEAN), North America | Long term (≥ 4 years) |
| Wider adoption of drip and micro-irrigation systems | +0.8% | Asia-Pacific (India, China), Middle East, South America | Medium term (2-4 years) |
| Rising soil salinity pressuring MOP substitution | +0.7% | Asia-Pacific (China, India), Middle East and Africa, Australia | Long term (≥ 4 years) |
| Carbon-priced markets favoring low-GHG SOP routes | +0.6% | Europe, North America, select Asia-Pacific jurisdictions | Long term (≥ 4 years) |
| Source: Mordor Intelligence | |||
Growing Demand for Chloride-Free Potash Fertilizers
Crops such as citrus, grapes, potatoes, and tree nuts incur yield and quality losses when exposed to chloride, locking in demand for SOP despite premiums that averaged USD 283 per ton over MOP in Northwest Europe during 2025. Greenhouse growers in the Netherlands, Spain, and China rely on water-soluble SOP to avoid salt accumulation in recirculating systems. Brazil’s export-oriented fruit sector also mandates chloride-free nutrition to meet residue limits in key importing regions. Because these agronomic factors are structural, the potassium sulphate market retains pricing power even when conventional potash prices soften.
Expansion of High-Value Horticulture Acreage
Income growth and dietary shifts are pushing acreage for fruits, vegetables, and nuts ahead of staples. Brazil imported 12.76 million tons of potash in 2025 and is incentivizing domestic fertilizer supply to lower foreign-exchange exposure, while India supports drip-fed horticulture under the Pradhan Mantri Krishi Sinchayee Yojana. SOP use rises with each hectare converted to premium crops, enlarging the addressable potassium sulphate market.
Wider Adoption of Drip and Micro-Irrigation Systems
Micro-irrigation reached 10.5 million ha in India by 2024 and is expanding quickly in Saudi Arabia, the UAE, and Israel. These systems demand fully soluble, low-salt fertilizers to prevent emitter clogging, positioning SOP as the preferred potassium source. The global water-soluble fertilizer sector will grow from USD 22.25 billion in 2026 to USD 31 billion by 2031 at 6.9% CAGR, with SOP capturing an increasing slice.
Rising Soil Salinity Pressuring MOP Substitution
Roughly 20% of irrigated cropland faces salinity issues, and SOP mitigates chloride buildup. China has mapped 3.3 million ha of saline-affected land in the North China Plain, prompting recommendations to replace MOP with SOP on wheat and vegetables[1]Agrolink Staff, “Soil Salinity and Potassium Management,” agrolink.com.br. Similar dynamics hold in Australia’s Murray-Darling Basin and the Indo-Gangetic Plain.
Restraint Impact Analysis*
| Restraints | (~) % Impact on CAGR Forecast | Geographic Relevance | Impact Timeline |
|---|---|---|---|
| High production and energy costs | -0.9% | Global, acute in Europe and North America | Short term (≤ 2 years) |
| Limited naturally-occurring kainite/langbeinite basins | -0.5% | Global, concentrated in Canada, Germany, United States | Long term (≥ 4 years) |
| Stringent discharge rules for sulphate-rich effluents | -0.4% | Europe, North America, China | Medium term (2-4 years) |
| Source: Mordor Intelligence | |||
High Production and Energy Costs
Mannheim plants consume 300-400 kWh/ton and carry cash costs near USD 500/ton. Although K+S hedged 70% of its 2026 European gas below EUR 40 per megawatt-hour, spot volatility above EUR 100 per megawatt-hour still threatens margins. Phosphogypsum and glaserite routes cut energy use but depend on consistent waste-stream feedstocks and add logistics complexity.
Limited Naturally Occurring Kainite/Langbeinite Basins
Economically viable primary SOP resources are concentrated in Saskatchewan, Germany’s Werra-Fulda basin, and New Mexico’s Carlsbad district[2]U.S. Geological Survey, “Mineral Commodity Summary: Potassium Sulphate 2026,” usgs.gov. Australian salt-lake projects struggled to commission, and Chinese brine output is effectively ring-fenced by export controls, keeping the potassium sulphate market structurally tight.
*Our forecasts treat driver/restraint impacts as directional, not additive. The impact forecasts reflect baseline growth, mix effects, and variable interactions.
Segment Analysis
By Form: Soluble Grades Capture Fertigation Growth
Granular SOP accounted for 46.12% of the potassium sulphate market size in 2025. Producers favor it for field-crop broadcasting because it costs less to make and handles well in blends. Yet soluble/crystal grades are set for a 6.04% CAGR through 2031 as growers shift to drip systems. Cinis Fertilizer shipped its water-soluble GreenSwitch product in September 2024 and targets 1.5 million kilotons per annum by decade-end. Soluble SOP commands USD 50-80/ton premiums, offsetting added crystallization expense.
Granular products will remain entrenched in cereals and oilseeds because of lower nutrient-use-efficiency requirements and higher price sensitivity. Conversely, greenhouse vegetables and high-value orchards insist on residue-free soluble grades to protect irrigation equipment. Packaging innovations such as fully dissolving bags reduce labor and contamination, reinforcing adoption.


By Production Process: Phosphogypsum Routes Challenge Mannheim Dominance
The Mannheim route held 55.18% of the potassium sulphate market share in 2025, owing to established assets and 98-99.5% purity. Nevertheless, phosphogypsum conversion is forecast to expand at 6.12% CAGR through 2031, unlocking 6 billion tons of global gypsum stockpiles and avoiding corrosive HCl by-products. Glaserite synthesis, demonstrated by Cinis in Sweden, uses half the energy per ton of SOP but hinges on sodium sulphate feedstock availability.
Mannheim plants face mounting natural-gas costs and effluent controls, while brine operations in China confront export restrictions and seasonal evaporation risk. Modular phosphogypsum plants offered by Ballestra and K-UTEC lower capex for regional build-outs, broadening the competitive field in the potassium sulphate market.
By Application: Industrial Segments Outpace Agricultural Growth
Agriculture absorbed 71.35% of SOP demand in 2025, led by fruits, vegetables, nuts, and vines needing chloride-free nutrition. Yet industrial uses, including glass, ceramics, dyes, and pharmaceuticals, are projected to grow at 6.15% CAGR to 2031 as manufacturers replace sodium salts in low-iron glass and adopt pharmaceutical-grade SOP excipients.
Cereal and rice growers in saline soils are adopting SOP to curb sodicity, but the brightest demand comes from industrial glassmakers pursuing higher optical clarity and drug makers requiring USP/EP compliance. These outlets lift average realized prices and diversify revenue streams for producers.
By Grade: Technical Grades Ride Specialty-Crop and Industrial Demand
Standard/fertilizer grade represented 61.44% of sales in 2025, yet soluble and technical grades will grow at 6.09% CAGR through 2031. Compass Minerals’ Protassium+ Organic captures premiums of USD 80-120 per ton in the U.S. organic supply chain. Technical-grade SOP must meet heavy-metal limits below 10 ppm and dissolved-solids specs below 0.01%, commanding the highest margins.
Feed and food grades serve animal nutrition and food-processing markets that require Codex or FDA compliance. Organic certification bodies list naturally derived SOP as an approved input, reinforcing demand for high-purity grades that meet stringent residue standards.
Geography Analysis
Asia-Pacific held 41.22% of the potassium sulphate market share in 2025, anchored by China’s over 5 million tons per annum production-plus-consumption base, though export curbs since 2021 tightened supply and lifted intra-Asian freight rates. India’s drip-irrigated acreage, subsidized up to 55%, is spurring soluble-grade imports, while ASEAN growers of durian and palm oil increased SOP purchases by 12% y-o-y in 2025. Japan and South Korea sustain niche greenhouse demand, paying premiums for technical purity.
South America is the fastest-growing region at a projected 6.23% CAGR to 2031. Brazil’s import reliance is above 95% for potash, and its pivot to high-value horticulture drives SOP uptake despite premiums of over USD 300 per ton over MOP. Argentina’s citrus exporters and Chile’s avocado sector depend on SOP to meet EU chloride limits, while freight from the Middle East and Europe keeps landed prices elevated.
North America and Europe post steady growth anchored in organic farming and decarbonized supply. K+S broke ground on a CAD 3 billion Bethune expansion in September 2025 to nearly double output to 4 million tons per annum by 2040. EU buyers favor low-carbon SOP lines like C:LIGHT to meet Scope 3 targets, and OMRI-listed inputs underpin U.S. organic demand valued at USD 60 billion in 2025.

Competitive Landscape
The potassium sulphate market is moderately consolidated. Incumbents lean on decarbonization to protect share: K+S’s power-to-heat upgrade slashes plant CO₂ by 90%, and Bethune will integrate 62 MW of cogeneration plus 60 GWh/annum of solar power. ICL’s Polysulphate segment registered USD 453 million potash sales in Q3 2025, aided by specialty-grade positioning. Smaller exploration plays in Ethiopia and Australia exited or pivoted after funding shortfalls, underscoring the capital intensity and regulatory hurdles of new builds.
Process licensors K-UTEC and Ballestra are commercializing modular phosphogypsum plants that cut capex and effluents, potentially reshaping regional supply patterns. Compliance with ISO 14001 and zero-liquid-discharge rules raises entry barriers, favoring well-capitalized producers and encouraging joint ventures that pool technology, feedstock, and marketing reach.
Potassium Sulphate Industry Leaders
Compass Minerals
SQM
Tessenderlo Kerley
K+S AG
ICL
- *Disclaimer: Major Players sorted in no particular order

Recent Industry Developments
- December 2025: Arab Potash signed a long-term supply pact with Yara International to streamline global distribution through its Swiss and Brazilian subsidiaries.
- March 2025: Cinis Fertilizer AB' facility in Köpmanholmen is ramping up production, successfully shipping its latest load of water-soluble potassium sulphate. This shipment, weighing just over 4,400 tons, meets the stringent quality standards.


Global Potassium Sulphate Market Report Scope
Potassium sulphate is an inorganic, white crystalline salt widely utilized in agriculture and industrial sectors. It serves as a premium fertilizer, supplying potassium and sulfur without chloride, making it ideal for chloride-sensitive crops such as tobacco and fruits. Additionally, it is employed in industrial applications, including glass manufacturing and flash reduction in explosives.
The potassium sulphate market is segmented by form, production process, application, grade, and geography. By form, the market is segmented into granular SOP, standard powder SOP, and soluble/crystal SOP. By production process, the market is segmented into Mannheim process, natural brine/sea-lake processing, sulphate-salts reaction, and phosphogypsum conversion. By application, the market is segmented into agriculture (cereals and grains, fruits and vegetables, nuts, citrus and vines, oilseeds and pulses, and other crops) and industrial (glass and ceramics, dyes and pigments, pharmaceuticals and food, and other industrial applications). By grade, the market is segmented into standard/fertiliser grade, soluble/technical grade, and feed/food grade. The report also covers the market size and forecasts for the potassium sulphate market in 17 countries across major regions. For each segment, the market sizing and forecasts have been done based on revenue (USD).
| Granular SOP |
| Standard Powder SOP |
| Soluble/Crystal SOP |
| Mannheim Process |
| Natural Brine/Sea-Lake Processing |
| Sulphate-Salts Reaction |
| Phosphogypsum Conversion |
| Agriculture | Cereals and Grains |
| Fruits and Vegetables | |
| Nuts, Citrus and Vines | |
| Oilseeds and Pulses | |
| Other Crops | |
| Industrial | Glass and Ceramics |
| Dyes and Pigments | |
| Pharmaceuticals and Food | |
| Other Industrial Applications |
| Standard/Fertiliser Grade |
| Soluble/Technical Grade |
| Feed/Food Grade |
| Asia-Pacific | China |
| Japan | |
| India | |
| South Korea | |
| ASEAN Countries | |
| Rest of Asia-Pacific | |
| North America | United States |
| Canada | |
| Mexico | |
| Europe | Germany |
| United Kingdom | |
| France | |
| Italy | |
| Spain | |
| Russia | |
| NORDIC Countries | |
| Rest of Europe | |
| South America | Brazil |
| Argentina | |
| Rest of South America | |
| Middle East and Africa | Saudi Arabia |
| South Africa | |
| Rest of Middle East and Africa |
| By Form | Granular SOP | |
| Standard Powder SOP | ||
| Soluble/Crystal SOP | ||
| By Production Process | Mannheim Process | |
| Natural Brine/Sea-Lake Processing | ||
| Sulphate-Salts Reaction | ||
| Phosphogypsum Conversion | ||
| By Application | Agriculture | Cereals and Grains |
| Fruits and Vegetables | ||
| Nuts, Citrus and Vines | ||
| Oilseeds and Pulses | ||
| Other Crops | ||
| Industrial | Glass and Ceramics | |
| Dyes and Pigments | ||
| Pharmaceuticals and Food | ||
| Other Industrial Applications | ||
| By Grade | Standard/Fertiliser Grade | |
| Soluble/Technical Grade | ||
| Feed/Food Grade | ||
| By Geography | Asia-Pacific | China |
| Japan | ||
| India | ||
| South Korea | ||
| ASEAN Countries | ||
| Rest of Asia-Pacific | ||
| North America | United States | |
| Canada | ||
| Mexico | ||
| Europe | Germany | |
| United Kingdom | ||
| France | ||
| Italy | ||
| Spain | ||
| Russia | ||
| NORDIC Countries | ||
| Rest of Europe | ||
| South America | Brazil | |
| Argentina | ||
| Rest of South America | ||
| Middle East and Africa | Saudi Arabia | |
| South Africa | ||
| Rest of Middle East and Africa | ||


Key Questions Answered in the Report
How large will global demand for potassium sulphate be by 2031?
The Potassium Sulphate Market size is expected to increase from USD 5.02 billion in 2025 to USD 5.27 billion in 2026 and reach USD 6.77 billion by 2031, growing at a CAGR of 5.14% over 2026-2031.
Why do growers pay a premium for SOP over standard potash?
Chloride-sensitive crops risk yield loss with muriate of potash, so growers use chloride-free SOP even when it averages USD 283/ton above MOP in Northwest Europe.
Which region is expected to grow fastest in SOP consumption?
South America is projected to post a 6.23% CAGR through 2031, led by Brazil’s import reliance and expansion in high-value horticulture.
What production route is gaining momentum against Mannheim plants?
Phosphogypsum conversion technologies are scaling at 6.12% CAGR during 2026-2031, leveraging phosphoric-acid waste gypsum and avoiding corrosive HCl by-products.
How are producers lowering the carbon footprint of SOP?
K+S’s C:LIGHT uses power-to-heat electrification for a 90% CO₂ cut, while Cinis Fertilizer’s glaserite route halves energy intensity versus Mannheim.
Page last updated on:


