
Sodium Chloride Market Size and Share
Market Overview
| Study Period | 2021 - 2031 |
|---|---|
| Market Volume (2026) | 253.18 Million tons |
| Market Volume (2031) | 325.60 Million tons |
| Growth Rate (2026 - 2031) | 5.16 % |
| Fastest Growing Market | Asia Pacific |
| Largest Market | Asia Pacific |
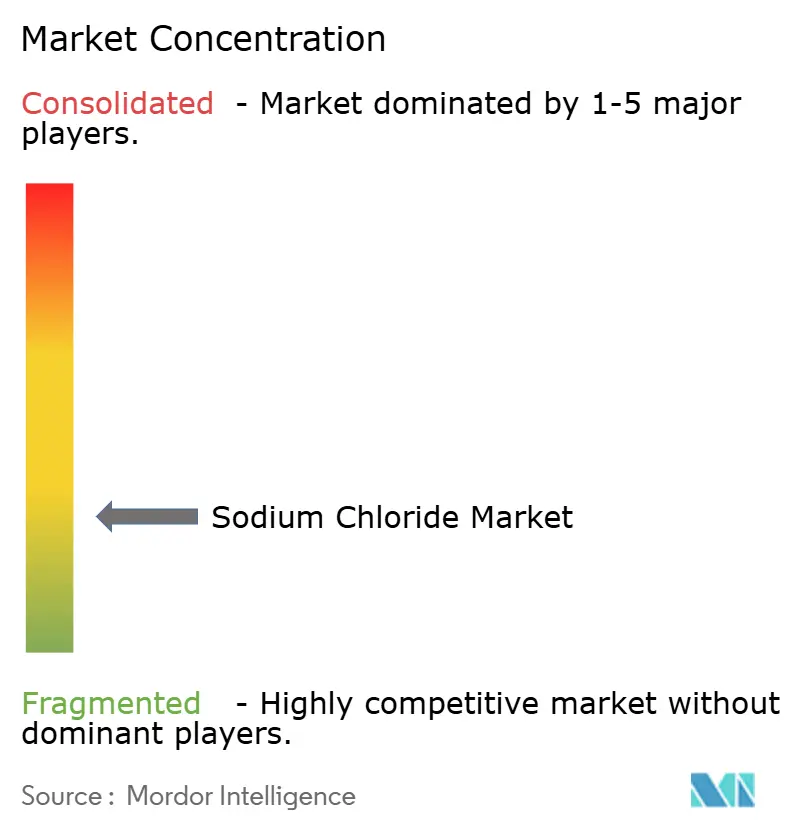
| Market Concentration | Low |
Major Players *Disclaimer: Major Players sorted in no particular order Image © Mordor Intelligence. Reuse requires attribution under CC BY 4.0. | |
Sodium Chloride Market Analysis by Mordor Intelligence
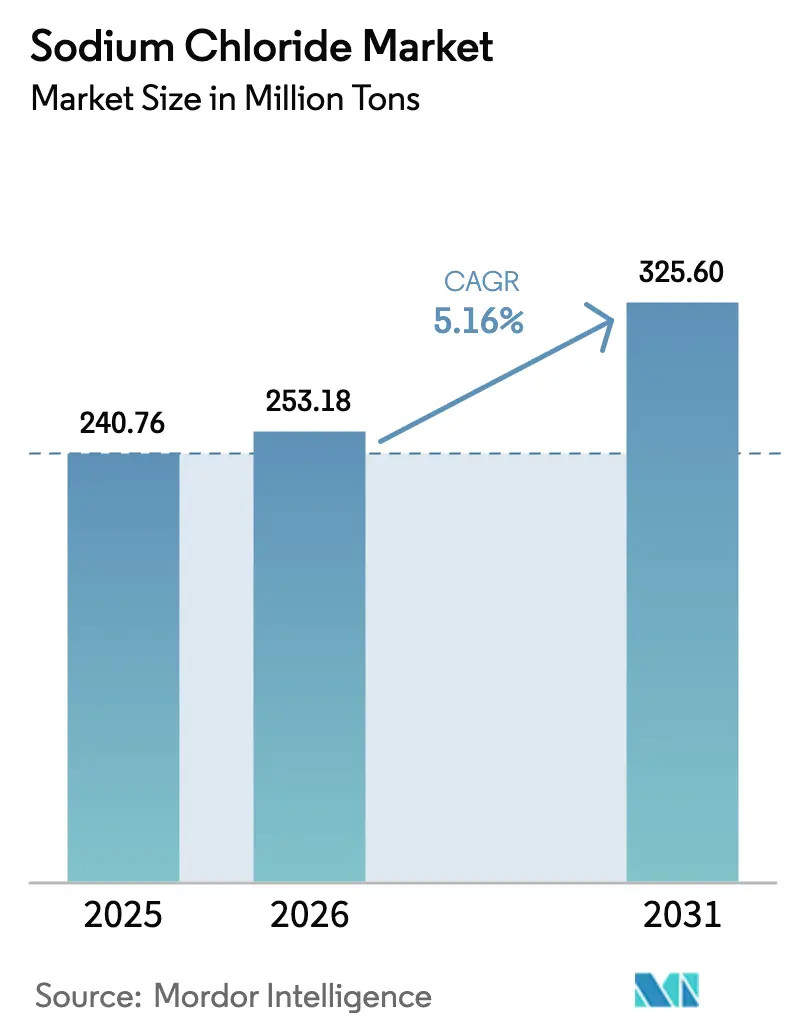
The Sodium Chloride Market size was valued at 240.76 Million tons in 2025 and is estimated to grow from 253.18 Million tons in 2026 to reach 325.60 Million tons by 2031, at a CAGR of 5.16% during the forecast period (2026-2031). Industrial pivots underlie this growth: pharmaceutical-grade supply gaps recorded by the U.S. Food and Drug Administration in 2024 continue to strain dialysis and intravenous therapy chains; Chinese sodium-ion battery cathode output rose from 10 gigawatt-hours in 2025 and is heading toward 292 gigawatt-hours by 2034, inflating demand for high-purity feedstock. Concentrated solar-power projects in Morocco, South Africa, and the Middle East increasingly employ molten-salt thermal storage, a requirement absent from legacy fossil plants. Municipal water-softening mandates in hard-water regions, expanding packaged-food output in emerging cities, and broader electrification trends reinforce the upward trajectory of the sodium chloride market. Competitive intensity stays moderate because the five largest suppliers control only 30% of global capacity, leaving room for regional specialists and integrated chemical majors to address niche purity grades and local contracts.
Key Report Takeaways
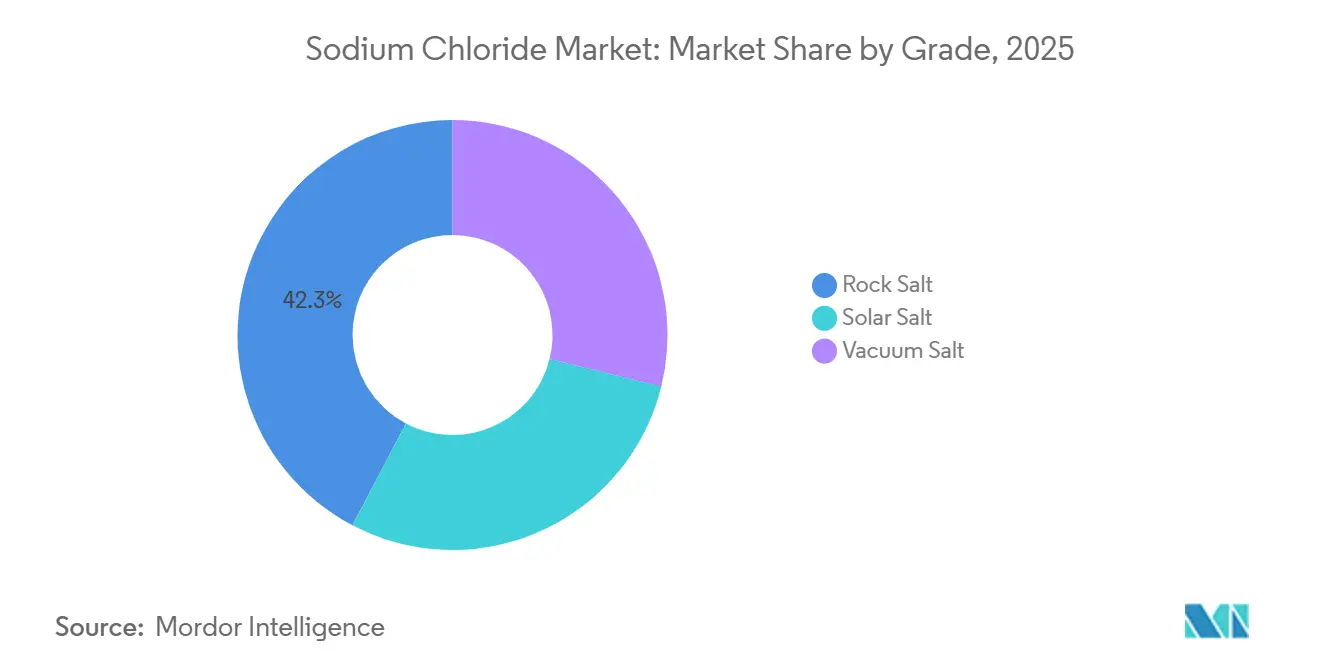
- By grade, rock salt led with 42.30% sodium chloride market share in 2025, while vacuum salt is forecast to advance at a 6.98% CAGR through 2031.
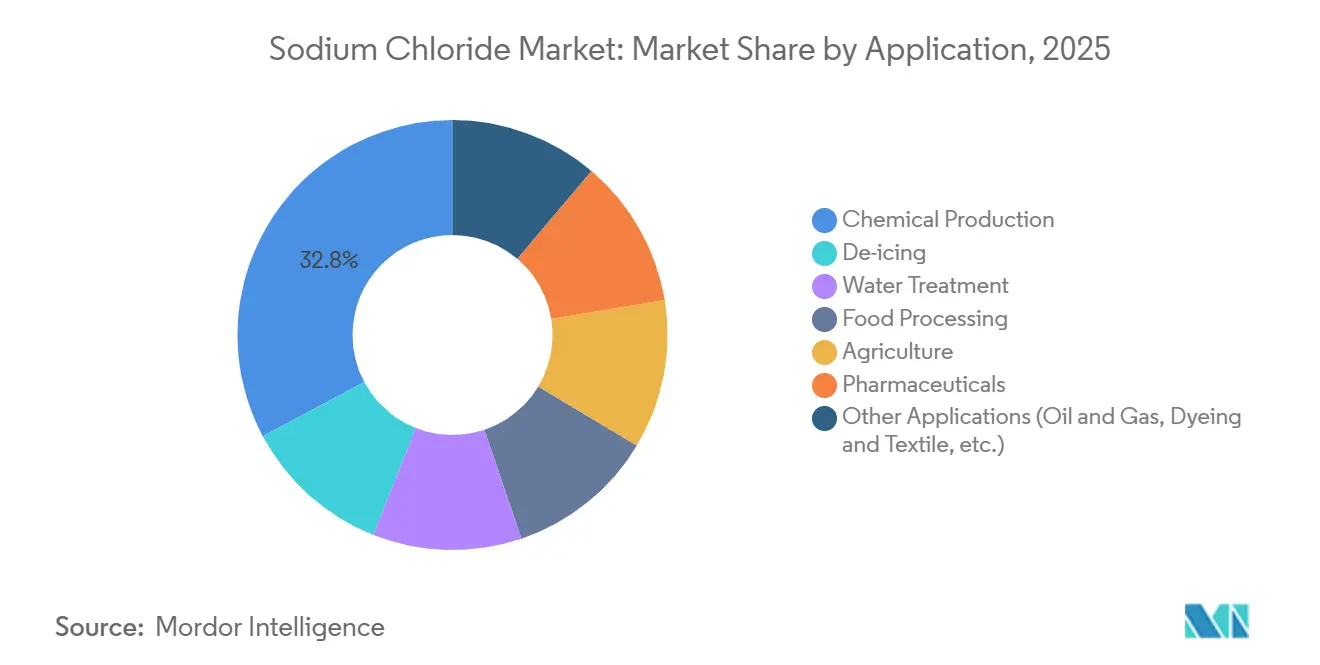
- By application, chemical production accounted for 32.80% of the sodium chloride market size in 2025, whereas pharmaceuticals are poised to expand at a 7.82% CAGR during 2026-2031.
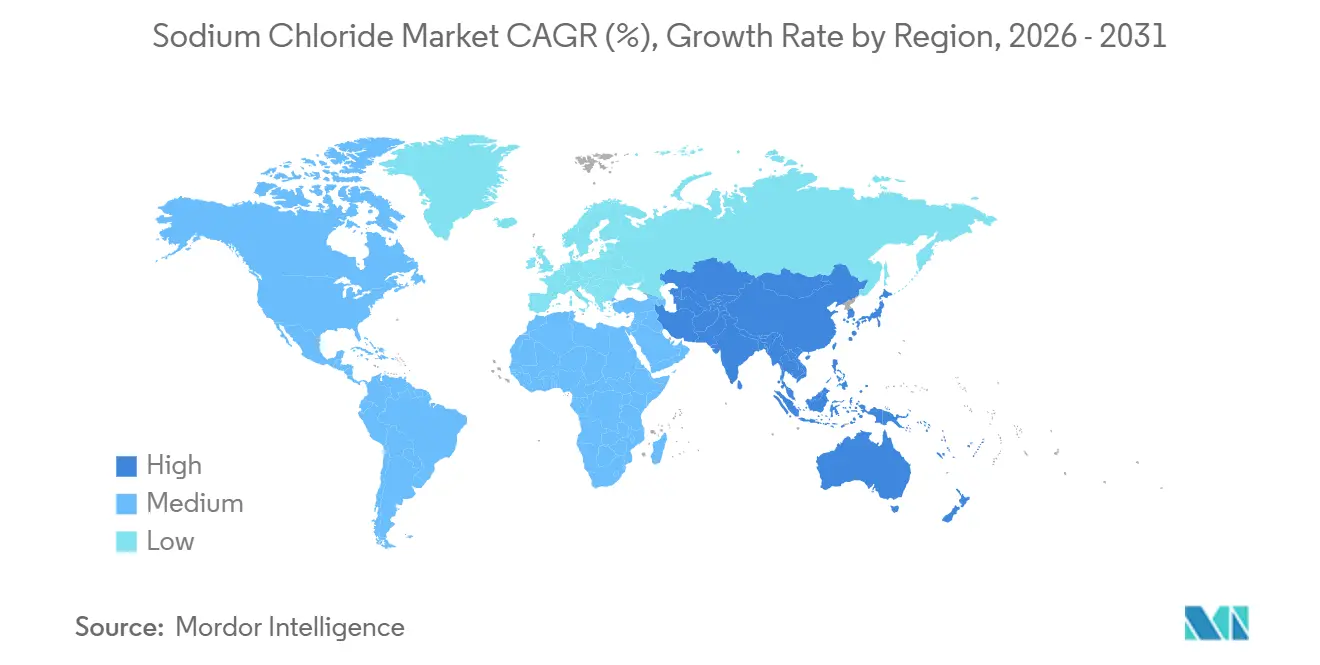
- By geography, Asia-Pacific captured 46.20% of volume in 2025 and is projected to register a 6.44% CAGR, outpacing North America and Europe.
Note: Market size and forecast figures in this report are generated using Mordor Intelligence’s proprietary estimation framework, updated with the latest available data and insights as of January 2026.
Market Trends and Insights
Drivers Impact Analysis of Sodium Chloride Market*
| Driver | (~) % Impact on CAGR Forecast | Geographic Relevance | Impact Timeline |
|---|---|---|---|
| Surging Demand from Packaged-Food and Beverage Processors | +0.8% | Global, with concentration in North America, Europe, and APAC urban centers | Medium term (2-4 years) |
| Rising Pharmaceutical-Grade NaCl Uptake for Dialysis and IV Fluids | +1.2% | Global, peak demand in Japan, Germany, South Korea, United States | Long term (≥4 years) |
| Increasing Usage of Sodium-Based Batteries | +0.9% | APAC core (China, South Korea), spill-over to North America and Europe | Medium term (2-4 years) |
| Municipal Water-Softening Mandates in Hard-Water Regions | +0.6% | North America (Midwest, Southwest), India (Gujarat, Rajasthan), Middle East | Short term (≤2 years) |
| Molten-Salt Thermal Storage in Concentrated-Solar-Power Plants | +0.7% | Middle East and Africa (UAE, Saudi Arabia, South Africa), North Africa (Morocco), select APAC and South America sites | Long term (≥4 years) |
| Source: Mordor Intelligence | |||
Surging Demand from Packaged-Food and Beverage Processors
The tension between voluntary sodium-reduction targets and rapid packaged-food growth is sustaining bulk consumption. The FDA’s Phase I limit of 3,000 milligrams and Phase II goal of 2,300 milligrams per day have not yet suppressed the absolute tonnage of salt bought by manufacturers as urbanization in India and Southeast Asia broadens cold-chain access[1]U.S. Food and Drug Administration, “Voluntary Sodium Reduction Goals,” fda.gov . India’s processed-food industry expanded 11% in 2025, with shelf-stable ready-to-eat meals using sodium chloride for microbial control. Europe’s front-of-pack labeling improves transparency, but a 2025 European Commission audit showed only 58% compliance, keeping reformulation behind schedule. Beverage categories such as electrolyte sports drinks grew 14% year over year in 2025, adding another discretionary channel.
Rising Pharmaceutical-Grade NaCl Uptake for Dialysis and IV Fluids
Regulatory shortages logged by U.S. and Australian agencies in 2024 exposed concentrated production footprints that rely on fewer than a dozen vacuum-salt plants worldwide. Each patient on thrice-weekly regimens consumes roughly 312 kilograms of ultra-pure salt annually, and specifications under the U.S. Pharmacopeia and European Pharmacopoeia require more than 99.9% purity plus tight heavy-metal and endotoxin limits. Adoption of mechanical-vapor-recompression evaporators, which slash energy input to 15-25 kilowatt-hours per ton, helps producers meet these standards while defending margins.
Increasing Usage of Sodium-Based Batteries
Surging sodium-ion capacity pipelines enhance structural demand. Chinese cathode plants grew from 10 GWh in 2025 to a projected 292 GWh by 2034, each GWh requiring about 1,200 tons of battery-grade sodium chloride feedstock. Cost advantages over lithium have drawn CATL, BYD, and Alsym Energy into multi-GWh programs. Prussian-blue and layered-oxide cathodes set strict impurity limits—calcium and magnesium below 10 ppm—opening premium opportunities for vacuum-salt suppliers. Venture capital entries such as Alsym’s USD 78 million Series B funding in 2024 signal broader geographic diversification of battery salt demand beyond Asia.
Municipal Water-Softening Mandates in Hard-Water Regions
Utilities in hard-water localities are rolling out ion-exchange softening. California Water Code Section 13148 empowers agencies to set point-of-entry rules, and cities from Phoenix to Ahmedabad require 55-90 kilograms of salt per household each year for resin regeneration. India’s Jal Jeevan Mission delivers piped water to rural households, many in high-hardness zones, adding an incremental municipal market. In the Gulf Cooperation Council, blending desalinated water with brackish aquifer supplies necessitates resin regeneration.
Restraints Impact Analysis of Sodium Chloride Market*
| Restraint | (~) % Impact on CAGR Forecast | Geographic Relevance | Impact Timeline |
|---|---|---|---|
| Proliferation of Eco-Friendly Organic De-Icers (Acetates, Formates) | -0.5% | North America (airports, urban centers), Northern Europe (Scandinavia, Benelux) | Medium term (2-4 years) |
| Public-Health Push to Curb Dietary Sodium Intake | -0.4% | Global, with regulatory enforcement concentrated in North America, Europe, Australia | Long term (≥4 years) |
| Stringent Regulation on Hypersaline Effluent Disposal | -0.3% | North America (Texas, California), Europe (EU Water Framework Directive jurisdictions), Middle East desalination hubs | Short term (≤2 years) |
| Source: Mordor Intelligence | |||
Proliferation of Eco-Friendly Organic De-Icers (Acetates, Formates)
Airports and Nordic municipalities are shifting from rock salt to corrosion-free alternatives. Potassium acetate and sodium formate covered 80% of U.S. airfield de-icing tonnage in 2024[2]U.S. Environmental Protection Agency, “Active De-Icing Chemical Usage,” epa.gov . The Nordic Swan Ecolabel caps chlorine at 100 mg per kg, diverting 180,000 tons annually into acetate blends. Though acetates cost three to five times more than rock salt, lifecycle savings from reduced bridge corrosion are narrowing total ownership gaps.
Public-Health Push to Curb Dietary Sodium Intake
The FDA’s voluntary reduction roadmap aims to cut U.S. intake from 3,400 mg to 2,300 mg per day, aligning with WHO guidelines. Similar frameworks rolled out in the United Kingdom and Australia showed that 10% intake reductions could displace 1.2 million tons of food-grade salt across OECD countries. Yet intake in India climbed from 8.5 g to 9.2 g per person between 2020 and 2025, reflecting faster processed-food adoption.
*Our forecasts treat driver/restraint impacts as directional, not additive. The impact forecasts reflect baseline growth, mix effects, and variable interactions.
Sodium Chloride Market Segment Analysis
By Grade:
Purity Premiums Drive Vacuum-Salt AdoptionVacuum salt is rising at a 6.98% CAGR. Demand stems from MVR evaporators that deliver more than 99.9% purity using one-third the energy of older multi-effect units. Rock salt retained dominance with a 42.30% sodium chloride market share in 2025 because bulk de-icing contracts require low cost more than extreme purity. Solar salt from coastal evaporation ponds meets mid-purity needs in textile dyeing and water softening where minor calcium sulfate residues are tolerated.
Despite rock salt’s cost edge—USD 40-60 free-on-board mine versus USD 120-180 for vacuum salt—pharmaceutical and battery cathode makers pay premiums for impurity thresholds below 10 ppm. Tata Chemicals’ 1.5 million-ton plant in Gujarat supplies regional dialysate producers, while Cargill’s Great Salt Lake operation feeds western U.S. food processors. Solar-salt producers in Shandong and Jiangsu must now manage hypersaline mother liquor under stricter discharge rules, nudging them toward solar-evaporation crystallizers that reclaim magnesium bromide byproducts. Energy-price disparities cap vacuum-salt rollouts in Europe, but MVR retrofits in Germany’s Werra mine cut sulfate to 0.2%, enabling bids for pharma contracts previously unreachable.


By Application:
Pharmaceuticals Outpace Mature Chemical SegmentChemical production consumed 32.80% of volume in 2025, largely as chlor-alkali feedstock for caustic soda and chlorine. Still, pharmaceutical demand is forecast to rise at a 7.82% CAGR, the quickest pace within the sodium chloride market. Japan’s 36 million citizens over 65 years old and Germany’s 22% senior cohort elevate dialysate consumption at 312 kg per patient annually.
Water treatment accelerated as India’s Jal Jeevan Mission and Middle East desalination added 12 million m³ per day of membrane capacity that relies on brine regeneration. Food processing demonstrated moderate consumption, balanced between direct formulation and brining steps. Oil-field clear-brine fluids consumed lower volumes but remain cyclical: U.S. drilling rigs fell between December 2024 and December 2025, reducing salt pull-through. Textile dye houses, compelled by ISO 14001 adoption, are trialing salt-free fixation chemistries, posing a prospective downside demand by 2030.
Geography Analysis
APAC Sodium Chloride Market
Asia-Pacific commanded 46.20% of global volume in 2025 and will advance at a 6.44% CAGR, underpinned by Chinese sodium-ion battery cathode capacity and India’s 30 million-ton salt output centered in Gujarat. Japan’s aging population intensifies pharmaceutical-grade demand, while South Korea’s membrane-cell chlor-alkali lines supply semiconductor-grade chemicals. ASEAN petrochemical corridors in Vietnam and Indonesia expand industrial uptake, and Singapore’s Tuas desalination plant, commissioned in 2024 at 137,000 m³ per day, raises brine-management volumes.
North America Sodium Chloride Market
North America exhibits mature growth. Highways consumed up to 20 million tons of de-icing salt during harsh winters, but municipal budget limits and inventory drawdowns trimmed Compass Minerals’ 2024 salt revenue by 6%. California water-softening ordinances add residential-level volume, while Mexico’s chlor-alkali capacity around Monterrey expanded to serve near-shoring electronics plants, boosting feedstock demand by over 800,000 tons in 2025.
Europe, South America and Middle East Sodium Chloride Market
Europe grows as Nordic Swan procurement bans limit road-salt use. K+S’s EUR 25 million ion-exchange upgrade lowered sulfate levels to penetrate pharmaceutical niches. The EU Water Framework Directive forces zero-liquid-discharge adoption, raising production costs but enabling compliance. In South America, pulp-and-paper and lithium brine processors lift needs, while the Middle East leans on desalination, chlor-alkali, and CSP storage. Qatar opened a 1 million-ton vacuum-salt plant in 2025 to backfill pharmaceutical and food demand across the Gulf.

Regulatory Landscape
Food-grade sodium chloride specifications and labeling rules continue to be a compliance driver, alongside public-health sodium reduction initiatives. In the United States, the FDA advanced its voluntary sodium reduction program with Phase II draft guidance released in August 2024 (following Phase I targets dated to April 2024), which helps shape reformulation timelines across 163 food categories and influences salt demand patterns for food processing.
Standards and trade rules also affect sourcing and product qualification across regions. Codex Alimentarius Standard CXS 150-1985 for food-grade salt was updated in 2025, providing an internationally referenced baseline for food-grade requirements, while the Food Chemicals Codex and pharmacopeial specifications continue to govern high-purity grades. In the EU, sodium chloride is approved as a basic substance for specific plant-protection uses under Commission Implementing Regulation (EU) 2021/556, and in Nigeria, NAFDAC requires iodization and mandates clear labeling to separate industrial salt from food-grade products. Trade exposures, such as the US Section 301 additional tariff on Chinese-origin sodium chloride, can change landed costs and procurement strategies.
Value Chain Analysis
The sodium chloride value chain runs from extraction and collection (rock salt mining, solution mining and brine wells, and solar evaporation ponds) through refining (washing, screening, and vacuum pan evaporation for higher-purity grades) and then bulk distribution to end users. Industry structure is shaped by four major production routes, rock salt mining, solution mining, vacuum pan evaporation, and solar evaporation, with output concentrated among large producers in China, the United States, India, Australia, and Canada.
Logistics is a key constraint for bulk applications because the commodity's weight-to-value ratio makes transport cost decisive, often steering supply toward regional and captive demand. Rail and truck networks, winter-season inventory positioning for de-icing, and access to ports and bulk terminals influence delivered economics. Downstream integration also supports resilience for chemical production (chlor-alkali brine) and specialty grades, with vertically integrated participants such as Cargill, K+S, Compass Minerals, ICL Group, and China National Salt Industry Corporation using processing and distribution footprints to serve both high-volume industrial buyers and higher-margin pharmaceutical and food customers that require tighter impurity controls.
Competitive Landscape
Low concentration defines the sodium chloride market; Cargill, China National Salt Industry Corporation, Compass Minerals, K+S, and Tata Chemicals together own 30% of capacity. Vertical integration into downstream chlorine derivatives or soda ash frames commercial advantage. Tata Chemicals channels 40% of internal salt into caustic soda, while Cargill leverages lake brine proximity to lower freight for western U.S. clients. Pricing power derives from purity: vacuum-salt premiums run 2.5-3 times rock salt, and K+S’s 2024 ion-exchange train in Germany opened the door to pharma contracts after cutting sulfate to 0.2%.
Opportunities surface in battery-grade supply. CATL and BYD lack long-term offtake for more than 99.5%-pure feedstocks, creating scope for vacuum-salt producers to index deals to lithium-price spreads. Technology investments favor energy-efficient MVR and membrane electrodialysis; 47 patents filed in 2024-2025 targeted brine concentration and selective crystallization per WIPO statistics, up 60% from 2022-2023. Compliance with ISO 9001 and ISO 14001 is fast becoming an entry ticket. Nouryon’s Hengelo plant cut freshwater intake by 40% through closed-loop brine recycling and retained ISO 14001 recertification in 2025, demonstrating the environmental narrative that buyers increasingly evaluate.
Disruptive newcomers are coupling desalination and crystallization. BCI Minerals’ AUD 1.4 billion Mardie project aims for 5.35 million tons of solar salt and 120,000 tons of sulfate of potash by 2027, leveraging integrated evaporation ponds to curb logistics costs. Such models shorten supply chains and monetize byproduct streams, challenging legacy miners dependent on deep shafts or remote lake brines.
Sodium Chloride Industry Leaders
China National Salt Industry Corporation
K+S Aktiengesellschaft
Cargill Inc.
Compass Minerals
Tata Chemicals
- *Disclaimer: Major Players sorted in no particular order
Sodium Chloride Market Companies Covered in this Report
- Cargill Inc.
- China National Salt Industry Corporation
- CK Life Sciences Int’l., (Holdings) Inc.
- Compass Minerals
- Donald Brown Group (PureSalt)
- EUsalt c/o KELLEN
- GHCL Limited
- ICL
- K+S Aktiengesellschaft
- Morton Salt, Inc.
- Nouryon
- Rio Tinto
- Salins Group
- Südwestdeutsche Salzwerke AG
- Swiss Salt Works AG
- Tata Chemicals
- Wacker Chemie AG

Market Opportunities and Future Outlook
White-space opportunities are forming around high-purity and lower-carbon supply, as end users tighten impurity and sustainability screens while also looking for supply security beyond legacy mining and solar-pond output. Producers are directing capital toward vacuum-salt and electrified, MVR-based manufacturing that targets pharmaceutical, food, and battery-linked specifications, including Tata Chemicals February 2026 announcement to build a greenfield iodized vacuum salt dried (IVSD) facility in Valinokkam, Tamil Nadu, and Nobian's June 2026 start of fully electrified operations at Mariager, Denmark, with a stated 60% site capacity expansion. These moves increase competition for conventional grades and leave room for regional suppliers that can certify to food and pharmacopeial standards and deliver consistent low-impurity lots.
Industrial integration and circularity are also expanding the addressable opportunity set. China National Salt Industry Group announced in May 2026 a large natural soda ash project in Tongliao, Inner Mongolia, reinforcing salt-linked chemical value chains, while waste-salt utilization investments such as Tianyuan Co., Ltd.'s April 2026 project in Yibin highlight a pathway for chlor-alkali ecosystems to convert salt-bearing waste streams into usable feedstock. In bulk markets, supply-chain security initiatives and infrastructure-led projects, including large-scale solar-salt developments, emphasize the value of local production near demand centers to reduce freight exposure and improve contract reliability for chemical producers, water treatment operators, and municipal buyers.
Recent Industry Developments in Sodium Chloride Market
- June 2026: K+S Aktiengesellschaft agreed to acquire the salt business of Qemetica, including evaporated salt production sites in Stassfurt (Germany) and Janikowo (Poland), for EUR 350 million plus a performance-linked component. The deal expands K+S salt production footprint in Europe and strengthens its offering for industrial and specialty customers that require consistent quality and reliable regional supply.
- November 2025: Tata Chemicals invested USD 15.52 million to increase soda ash production by 350 kilotonnes per annum at its Mithapur plant. Higher soda ash output tightens the linkage between soda ash and upstream salt flows, supporting internal demand pull-through for sodium chloride within integrated chemical operations.
- September 2024: QatarEnergy signed an MoU to establish Qatar Salt Products Company (QSalt) under its TAWTEEN localization program. The initiative supports domestic sodium chloride production capability in the Gulf, improving local supply availability for food and industrial consumers and reducing import dependence.


Sodium Chloride Market Report Scope and Research Methodology
Market Definition and Coverage
For this study, the sodium chloride market covers the supply and consumption of salt used across industrial and consumer uses, measured in volume terms and tracked by where the material is produced, traded, and finally consumed.
Scope exclusions: We exclude downstream chemicals and blends where sodium chloride is not the main product sold.
Segments Covered in This Report
- By Grade
- Rock Salt
- Solar Salt
- Vacuum Salt
- By Application
- Chemical Production
- De-icing
- Water Treatment
- Food Processing
- Agriculture
- Pharmaceuticals
- Other Applications (Oil and Gas, Dyeing and Textile, etc.)
- By Geography
- Asia-Pacific
- China
- India
- Japan
- South Korea
- ASEAN Countries
- Rest of Asia-Pacific
- North America
- United States
- Canada
- Mexico
- Europe
- Germany
- United Kingdom
- France
- Italy
- Spain
- NORDIC Countries
- Rest of Europe
- South America
- Brazil
- Argentina
- Rest of South America
- Middle East and Africa
- Saudi Arabia
- South Africa
- Qatar
- Nigeria
- United Arab Emirates
- Rest of Middle East and Africa
- Asia-Pacific
Data Sources, Market Sizing, and Validation
Desk Research
Desk work starts by building the supply and demand picture that can be checked in public data. We review official production and mineral statistics and trade flows from sources such as the United States Geological Survey (USGS), UN Comtrade, and national statistical offices that publish mining and salt output tables.
Next, we use salt association websites, food safety and labeling standards, and environmental and transport references to understand usage patterns and shipment seasonality, especially for de-icing demand. Company annual reports, investor presentations, and reputed business press are then used to validate capacity additions, plant utilization narratives, and end use exposure. Where needed, we also use paid subscriptions for company financials and intelligence, patent databases, and shipment-level import export records to cross-check the direction and magnitude of volumes. These sources are illustrative only, and many other public references were also used to collect, validate, and clarify the final assumptions.
Primary Interviews and Surveys
Primary work focuses on confirming what desk sources cannot fully explain, including realistic capacity utilization, product mix by grade, and how much demand is linked to seasonal de-icing versus steady industrial use. Interviews cover producers, distributors, large buyers, and industry experts across APAC, EMEA, and the Americas, so key assumptions can be challenged, corrected, and then aligned to practical market behavior.
Distribution of primary research fieldwork respondents
| Company type | Respondent position | Region |
|---|---|---|
| Top tier: 35% | CXOs: 16% | APAC: 41% |
| Mid tier: 44% | Functional/Unit leaders: 40% | EMEA: 34% |
| Smaller Players: 21% | Managers: 44% | Americas: 25% |
Market-Sizing & Forecasting
The model is built mainly using a top-down approach where production, trade, and apparent consumption are reconstructed for salt, and then adjusted using application-level demand signals gathered from interviews. To keep the totals realistic, we also run selective bottom-up checks such as sampled supplier capacity times utilization, and volume times typical pricing bands for key grades, which helps correct obvious gaps.
Inputs used in the model include salt production volumes, import export balances, grade mix shifts (rock, solar, vacuum), winter severity and de-icing intensity indicators, chemical industry operating rates, and water treatment activity signals that drive steady demand. When public series disagree, we prioritize the latest official release and then validate the direction through channel checks.
For forecasting, we use scenario analysis anchored on weather variability for de-icing, expected capacity changes, and industrial end use growth expectations, followed by a smoothing step to avoid unrealistic year to year jumps. Where a country data series is incomplete, missing years are bridged using regional peers and trade flow proxies, and the assumption is re-tested with expert feedback before being locked.
Data Validation & Update Cycle
Validation is done through multiple checks so the numbers stay consistent with real market signals. We compare modeled consumption against production plus net trade, and then verify that country and regional shares remain plausible given known capacity locations and shipment patterns.
If an outlier shows up, the underlying driver is re-opened, which can trigger follow-up calls and a quick rebuild of the affected module. Before sign-off, the work is reviewed in steps by another analyst to catch unit errors, double counting, and scope leakage. Reports are refreshed annually, and interim updates are made when major events materially change output, trade routes, or end-use demand, followed by a final pre-delivery check to reflect the newest available data.
Mordor Intelligence's Sodium Chloride Market Size Compared Against Other Published Estimates
Published market sizes for sodium chloride can look far apart because some sources report value in USD and others report physical volumes, and the conversion depends heavily on the assumed price mix by grade and region. Differences also come from whether the estimate treats de-icing as a distinct seasonal driver, and how the analyst handles countries where production reporting is limited.
Apparent consumption checks built from production and net trade, along with cross-checks against country level capacity and utilization signals, are the evidence used to keep Mordor Intelligence aligned to a physical demand pool that is reported in million tons rather than a blended revenue number.
Benchmark comparison
| Source | Market Size | Gaps in Research Methodology |
|---|---|---|
| Mordor Intelligence | USD 240.76 M (2025) | |
| Industry Research House A | USD 32.12 B (2025) | Reports the market in USD value, which can inflate or compress totals depending on assumed pricing, grade premiums, and the regional mix used for conversion from tonnage. |
| Business Publisher B | USD 19.11 B (2025) | Uses a value-based scope with its own grade and end-use mapping, and the implied price and volume pairing may differ by region, which shifts the 2025 total versus a volume-led model. |
The spread mainly comes from the unit of measurement and the pricing logic used to convert physical salt demand into revenue. When the definition stays tied to measurable flows like output and trade, and assumptions are validated through repeated checks, users get a market view that is easier to replicate and explain in planning discussions.


Key Questions Answered in the Report
What is the current volume of the sodium chloride market?
The sodium chloride market size is 253.18 million tons in 2026, rising to 325.60 million tons by 2031.
Which segment is growing fastest within the market?
Pharmaceutical use of ultra-pure salt is expanding at a 7.82% CAGR through 2031, the quickest among all applications.
Why is Asia-Pacific the largest regional consumer?
Robust chlor-alkali expansion, rising battery cathode capacity, and India’s large solar-salt base give Asia-Pacific 46.20% of global volume in 2025.
How are eco-friendly de-icers affecting salt demand?
Acetate and formate products captured 80% of U.S. airfield de-icing in 2024, trimming rock-salt sales and reducing growth by about 0.5 percentage point.
Page last updated on:


 Your data is secure and never sold or shared.


