Ionic Liquid Market Size and Share
Market Overview
| Study Period | 2021 - 2031 |
|---|---|
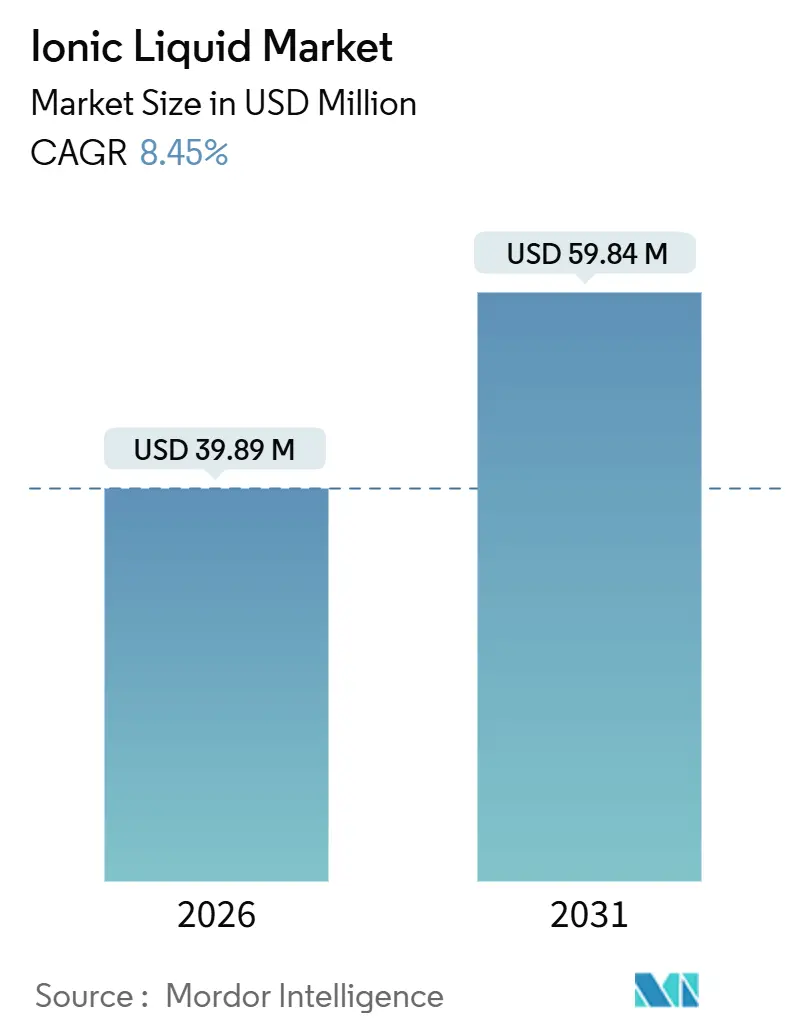
| Market Size (2026) | USD 39.89 Million |
| Market Size (2031) | USD 59.84 Million |
| Growth Rate (2026 - 2031) | 8.45% CAGR |
| Fastest Growing Market | Asia Pacific |
| Largest Market | Asia Pacific |
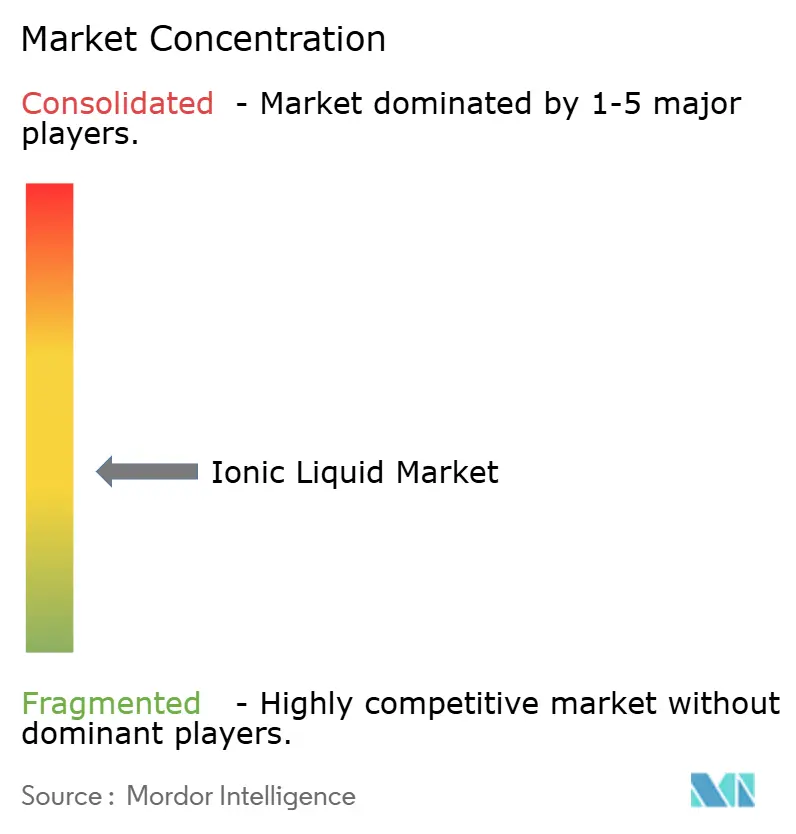
| Market Concentration | Medium |
Major Players *Disclaimer: Major Players sorted in no particular order Image © Mordor Intelligence. Reuse requires attribution under CC BY 4.0. | |
Ionic Liquid Market Analysis by Mordor Intelligence
The Ionic Liquid Market size is estimated at USD 39.89 million in 2026, and is expected to reach USD 59.84 million by 2031, at a CAGR of 8.45% during the forecast period (2026-2031). This expansion underscores the transition of ionic liquids from academic curiosities to production-scale enablers supporting electric-vehicle batteries, green-solvent programs, and precision electronics. Regulatory caps on volatile-organic-compound (VOC) emissions in the European Union, China, and the United States are accelerating solvent substitution, while demand from Asia-Pacific gigafactories for high-voltage electrolytes continues to intensify. Suppliers are differentiating through task-specific formulations that command price premiums exceeding USD 500 per kilogram, and continuous-flow production is beginning to trim manufacturing costs. Competitive rivalry remains high because the top five suppliers account for less than 40% ionic liquids market share, leaving space for regional specialists and captive production at downstream manufacturers.
Key Report Takeaways
- By application, Solvents and Catalysts led with 36.68% ionic liquids market share in 2025 and is expanding at an 8.58% CAGR through 2031.
- By type, the Cation segment held 58.23% revenue share in 2025, while the Anion segment posted the fastest growth at a 9.01% CAGR through 2031.
- By function, Process Chemicals accounted for 57.44% of the ionic liquids market size in 2025; Performance Chemicals are forecast to advance at a 9.56% CAGR to 2031.
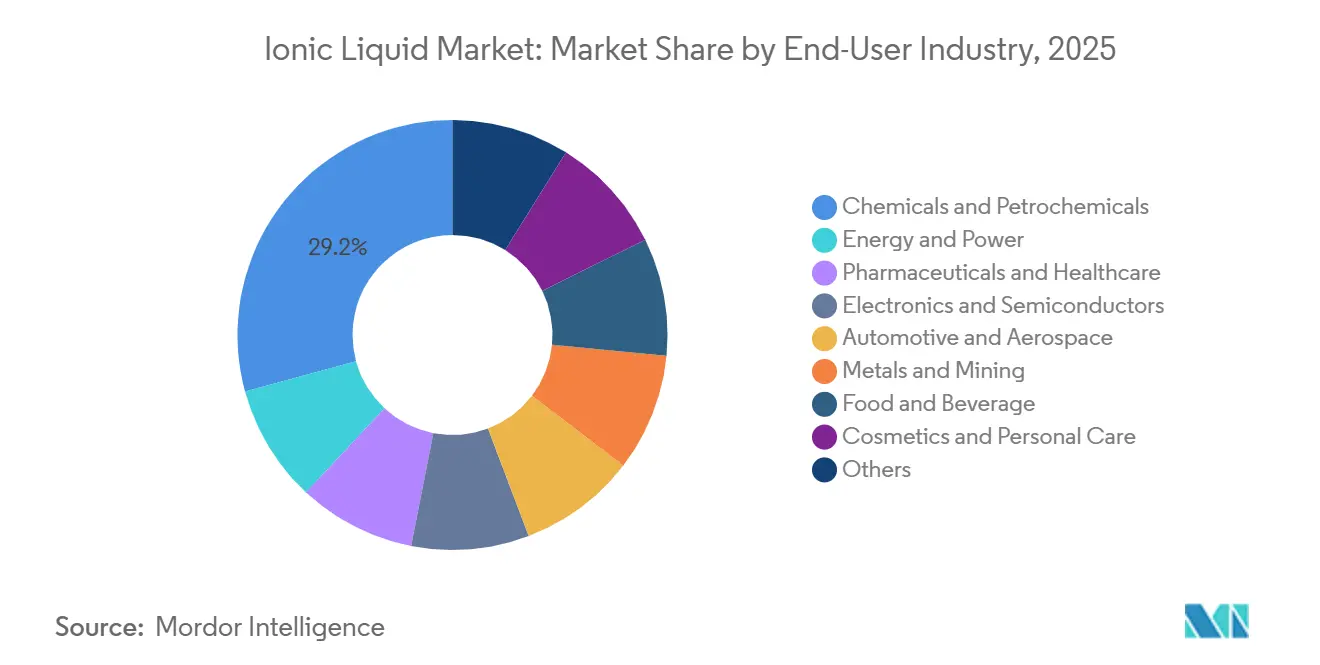
- By end-user industry, Chemicals and Petrochemicals captured 29.23% share in 2025; Energy and Power is on course for the highest 10.13% CAGR through 2031.
- By geography, Asia-Pacific dominated with a 47.13% share in 2025 and is projected to sustain a 10.12% CAGR to 2031.
Note: Market size and forecast figures in this report are generated using Mordor Intelligence’s proprietary estimation framework, updated with the latest available data and insights as of January 2026.
Global Ionic Liquid Market Trends and Insights
Drivers Impact Analysis*
| Driver | (~) % Impact on CAGR Forecast | Geographic Relevance | Impact Timeline | |
|---|---|---|---|---|
| Stringent VOC-emission caps catalyzing green-solvent uptake | +1.8% | European Union, North America, China | Medium term (2-4 years) | |
| Surging demand for high-voltage electrolytes from Asian EV gigafactories | +2.3% | Asia-Pacific core, spill-over to North America | Short term (≤ 2 years) | |
| Superior thermal and chemical stability enabling high-performance applications | +1.5% | Global | Long term (≥ 4 years) | |
| Electronics sector pull for antistatic and electrochemical devices | +1.2% | Japan, South Korea, Taiwan, spill-over to EU | Medium term (2-4 years) | |
| Green biorefinery process intensification with task-specific ILs | +1.0% | North America, European Union, Brazil | Long term (≥ 4 years) | |
| Source: Mordor Intelligence | ||||
Stringent VOC-Emission Caps Catalyzing Green-Solvent Uptake
The European Union cut permissible VOC emissions from coating operations to 50 g m⁻² in 2024, pushing formulators toward solvents with negligible vapor pressure, such as ionic liquids. Vapor pressures below 10⁻⁸ Pa eliminate fugitive emissions and help manufacturers sidestep costly oxidizers. China’s GB 37822-2019 regulation enforced an 80 g L⁻¹ VOC limit for interior paints in 2025, prompting a 22% rise in domestic ionic-liquid purchases[1]China Ministry of Ecology and Environment, “GB 37822-2019 Architectural Coatings Standard,” mee.gov.cn. The US Environmental Protection Agency updated its National Emission Standards in 2024 and will oblige legacy facilities to comply by 2027, reinforcing global demand for non-volatile alternatives. Automotive refinishing and industrial-maintenance coatings now specify ionic liquids that ensure substrate adhesion and fast cures while remaining VOC-free.
Surging Demand for High-Voltage Electrolytes from Asian EV Gigafactories
Asia-Pacific battery plants produced 1,200 GWh of lithium-ion cells in 2025, a 28% jump over 2024, with high-nickel cathodes operating above 4.5 V. Conventional carbonate electrolytes degrade at such voltages, whereas pyrrolidinium ionic liquids paired with fluorinated sulfonyl-imide anions retain stability to 5.2 V and enable cell energy density gains of 15-20%. Fast-charge programs above 3C on platforms such as CATL’s Qilin battery employ ionic-liquid co-solvents to suppress lithium plating. South Korea committed KRW 45 billion (USD 34 million) in 2025 to bolster domestic ionic-liquid output and curb reliance on Chinese intermediates[2]Ministry of Trade, Industry and Energy Korea, “Domestic Ionic-Liquid Supply-Chain Initiative,” motie.go.kr.
Superior Thermal and Chemical Stability Enabling High-Performance Applications
Operating windows from −80°C to +400°C position ionic liquids as irreplaceable heat-transfer media in concentrated solar power plants and as aerospace hydraulic fluids. Siemens Energy trialed ionic-liquid additives that cut stainless-steel corrosion by 40% and lengthened maintenance intervals at its Gemasolar site. Pharmaceutical syntheses employing ionic liquids reduced hazardous waste by 35% across three commercial processes in 2025. Perfluorinated variants deliver chemical inertness that meets stringent purity thresholds in uranium-hexafluoride handling and semiconductor plasma etching.
Electronics Sector Pull for Antistatic and Electro-Chemical Devices
Organic light-emitting diode production reached 720 million panels in 2025, utilizing ionic liquids as hole-injection layers that lower drive voltages by 0.8–1.2 V and extend luminance half-life to beyond 100,000 hours. Ionic-liquid copper-plating baths replaced chromic acid, eliminating hexavalent chromium waste while achieving ±2 µm thickness uniformity over 600 mm × 600 mm printed-circuit panels. Japan earmarked JPY 8 billion (USD 53 million) in 2025 for pilot lines at Hitachi Chemical and Mitsubishi Materials to validate ionic-liquid processes in advanced packaging.
Restraints Impact Analysis*
| Restraint | (~) % Impact on CAGR Forecast | Geographic Relevance | Impact Timeline | |
|---|---|---|---|---|
| Manufacturing cost > USD 500 kg⁻¹ vs. conventional solvents | −1.5% | Global | Short term (≤ 2 years) | |
| Limited eco-toxicity data delaying REACH registrations | −0.8% | European Union, spill-over to North America | Medium term (2-4 years) | |
| HF-feedstock volatility constraining fluorinated-anion supply | −0.6% | Global, acute in Asia-Pacific | Short term (≤ 2 years) | |
| Source: Mordor Intelligence | ||||
Manufacturing Cost more than USD 500 kg⁻¹ vs. Conventional Solvents
Raw materials for imidazolium-bis(trifluoromethylsulfonyl)imide cost USD 380-420 kg⁻¹ before purification, whereas N-methyl-2-pyrrolidone averages USD 2 kg⁻¹. Multistep recrystallization adds 12–18% to processing costs, and fluorinated-anion precursors trade at USD 85-110 kg⁻¹ with 16-week lead times. Continuous-flow plants demonstrated by Evonik in 2024 cut unit costs to USD 290-340 kg⁻¹, yet capital expenditure for 100-t yr⁻¹ capacity tops USD 18 million. Until volumes scale past 500 t yr⁻¹, plastics and lubricant markets remain price sensitive.
Limited Eco-Toxicity Data Delaying REACH Registrations
Fewer than 30 ionic-liquid formulations had complete REACH dossiers by December 2025. Imidazolium cations exhibit EC50 values of 10-100 mg L⁻¹ in Daphnia magna assays, triggering “harmful to aquatic life” labeling. Fluorinated anions persist in activated sludge for more than 180 days, complicating biodegradation assessments. A EUR 4.5 million industry consortium launched in 2024 aims to close data gaps for 12 high-volume products by 2027.
*Our forecasts treat driver/restraint impacts as directional, not additive. The impact forecasts reflect baseline growth, mix effects, and variable interactions.
Segment Analysis
By Application: Catalysis Anchors Volume, Energy Storage Drives Margin
Solvents and catalysts accounted for 36.68% revenue in 2025 and will grow at an 8.58% CAGR. Whether stabilizing palladium complexes or pretreating biomass, they form the volume backbone of the ionic liquids market. Energy storage applications, though smaller, will grow with a significant CAGR as redox-flow batteries and hybrid supercapacitors adopt ionic-liquid electrolytes that operate from –40°C to +70°C without auxiliary heating. Process fluids, such as heat-transfer, hydraulic, and lubricant grades, face cost competition from mineral oils priced an order of magnitude lower. Plastics uptake sits largely in antistatic additives for high-value resins, where the ionic liquids market size for engineering polymers is projected to expand modestly, given current price floors near USD 500 kg⁻¹.
Bio-refineries stand out as the fastest-growing niche. Task-specific formulations dissolve lignocellulosic biomass at lower temperatures, raising sugar yields by up to 30% and meeting US Department of Energy cost targets for cellulosic ethanol. Gas-separation membranes, electrochromic windows, and actuator fluids together face lengthy commercialization paths. Overall, applications with direct sustainability benefits and regulatory pull show the strongest momentum within the ionic liquids market.


By Ionic Species: Cation Dominance Meets Anion Innovation
Cation-based products held 58.23% revenue in 2025, anchored by proven imidazolium and pyrrolidinium cores and extensive toxicity data easing approvals. Yet anion-centric innovation drives future growth at a 9.01% CAGR as fluorinated anions widen electrochemical windows and cut viscosity. Bis(trifluoromethylsulfonyl)imide enables lithium-ion conductivities above 10 mS cm⁻¹ at 25 °C, facilitating 8–12% quicker charging in electric-vehicle packs. Phosphonium cations, though less than 5% of volume, are capturing attention for applications above 200 °C where imidazolium decomposes. Suppliers now market modular anion libraries to fine-tune properties, signaling a shift from cation-driven standardization to anion-enabled performance differentiation within the ionic liquids market.
By Function: Task-Specific ILs Command Premium Pricing
Process chemicals, comprising general solvents and reaction media, still generate 57.44% revenue but face price pressure as first-generation patents expire and low-cost Asian producers enter. The functional split is reshaping supplier focus from volume to value, with global majors retreating from commodity segments and doubling down on custom synthesis for pharmaceutical and electronics clients. Performance chemicals, designed for single-function tasks such as CO₂ capture or metal extraction, are growing at a 9.56% CAGR. Functional groups like hydroxyl or amine increase selectivity and justify 50–80% price premiums. BASF’s Basionics line absorbs up to 1.0 mol CO₂ per mol ionic liquid at 40 °C and 1 bar, trimming regeneration energy by 30%.
By End-User Industry: Energy Sector Leads Growth, Chemicals Anchor Volume
Chemicals and petrochemicals contributed 29.23% of 2025 sales, leveraging non-volatile ionic liquids to simplify product separation and slash fugitive emissions. The energy sector will log the fastest 10.13% CAGR as batteries, flow cells, and solar-thermal plants scale. Pharmaceuticals gain from ionic-liquid reaction media that reduce solvent waste by 35%. Electronics deploy ionic-liquid electrolytes, plating baths, and antistatic coatings, supported by Japanese and South Korean investments in advanced displays and packaging. Aerospace and automotive uptake remains limited by multiyear qualification cycles, while metals and mining pilot ionic liquids for rare-earth recovery with efficiencies topping 92%. Together, these sectors reinforce the broadening scope of the ionic liquids market.
Geography Analysis
Asia-Pacific dominated revenue with 47.13% in 2025 and is on a 10.12% CAGR track through 2031. China produced 620 t of ionic liquids in 2025, representing 54% of output, underpinned by vertically integrated supply chains that shave 25–30% off production costs. Domestic policies funding gigafactory electrolytes, semiconductors, and pharmaceutical APIs strengthen demand visibility. South Korea earmarked KRW 45 billion for supply-chain security in 2025, while Japan’s life-sciences sector adopted ionic liquids in 12 commercial active-pharmaceutical-ingredient syntheses, cutting hazardous waste by 28%.
In North America, the US demand benefits from Department of Energy biomass projects and Environmental Protection Agency solvent regulations. Occidental Chemical’s HF facility, slated for 2027, will mitigate fluorinated-anion bottlenecks and shift the regional ionic liquids market size upward. Canada’s oil sands employ task-specific variants for lower-temperature bitumen extraction, whereas Mexico’s EV supply chain is qualifying ionic-liquid thermal-interface materials.
In Europe, Germany, France, and the United Kingdom lead adoption, although limited REACH registrations restrict new-product launches. Continuous-flow synthesis demonstrated by Fraunhofer in 2025 reduced European costs to USD 305-350 kg⁻¹. Brazil anchors South American growth by integrating ionic liquids into sugarcane bagasse biorefineries, while Saudi Arabia pilots them for natural-gas sweetening. Collectively, South America and the Middle East & Africa offer headroom once regional pilot programs convert to commercial scale.


Competitive Landscape
The Ionic Liquid market is moderately fragmented. Missing synthesis standards and dense intellectual-property portfolios force buyers to dual-source or build captive capacity, sustaining fragmentation. Patent filings for ionic-liquid electrolytes rose 18% in 2025, with Chinese applicants accounting for 52%, hinting at future regional shake-ups. Commodity producers compete mainly on price and scale, whereas specialty players leverage application know-how to secure premium margins inside the ionic liquids market.
Ionic Liquid Industry Leaders
Evonik Industries AG
Iolitec Ionic Liquids Technologies GmbH
Merck KGaA
Solvay
BASF
- *Disclaimer: Major Players sorted in no particular order

Recent Industry Developments
- July 2025: In Henan Province, China, operations began for the world's inaugural thousand-ton-scale project producing ionic liquid-based regenerated cellulose fibers. Spearheaded by the Institute of Process Engineering (IPE) under the Chinese Academy of Sciences, this initiative sets a global precedent as the first large-scale production of regenerated cellulose fibers utilizing ionic liquids.
- June 2025: Solaveni, a German fine chemical manufacturer and a spinoff of Polish perovskite PV module maker Saule Technologies, began commercializing a protic ionic liquids technology. This technology is said to facilitate the creation of stable, water-based halide perovskite inks, making them suitable for scalable thin film manufacturing processes.


Research Methodology Framework and Report Scope
Market Definitions and Key Coverage
Our study defines the ionic liquid market as the aggregated value of salts that are liquid below 100 deg C and built around bulky organic cations (for example, imidazolium, phosphonium, pyridinium) paired with inorganic or organic anions, sold at >= 95 % purity for use as solvents, catalysts, electrolytes, specialized lubricants, and related process or performance chemicals.
Scope Exclusion: Deep eutectic solvents and molten salts above 100 deg C are outside this assessment.
Segmentation Overview
- By Application
- Solvents and Catalysts
- Process and Operating Fluids
- Plastics
- Energy Storage
- Bio-refineries
- Others
- By Type
- Cation
- Anion
- By Function
- Process Chemicals
- Performance Chemicals (Task-specific Ionic Liquids)
- By End-user Industry
- Chemicals and Petrochemicals
- Energy and Power
- Pharmaceuticals and Healthcare
- Electronics and Semiconductors
- Automotive and Aerospace
- Metals and Mining
- Food and Beverage
- Cosmetics and Personal Care
- Others
- By Geography
- Asia-Pacific
- China
- India
- Japan
- South Korea
- Thailand
- Indonesia
- Malaysia
- Vietnam
- Rest of Asia-Pacific
- North America
- United States
- Canada
- Mexico
- Europe
- Germany
- United Kingdom
- France
- Italy
- Spain
- Russia
- Rest of Europe
- South America
- Brazil
- Argentina
- Colombia
- Rest of South America
- Middle East and Africa
- Saudi Arabia
- United Arab Emirates
- South Africa
- Qatar
- Nigeria
- Egypt
- Rest of Middle East and Africa
- Asia-Pacific
Detailed Research Methodology and Data Validation
Primary Research
Discussions with process chemists, battery electrolyte formulators, and bulk chemical distributors across Asia-Pacific, North America, and Europe tested secondary findings, revealed real-world ASP dispersion, and gauged substitution intent in catalytic routes. Surveys with R&D directors quantified likely penetration in next-generation solid-state batteries, which fed directly into the demand pool.
Desk Research
Our analysts first mapped the supply landscape through publicly available customs flows on UN Comtrade, Eurostat PRODCOM, and China Customs to size trade in high-purity precursor salts; this clarified regional manufacturing intensity. Regulatory documents from the U.S. EPA, ECHA's REACH registry, and Japan's METI helped us judge demand created by tightening VOC limits and new battery-grade specifications. Scholarly meta-reviews on the IUPAC Green Chemistry portal and citation trends extracted via Google Scholar provided uptake clues in synthesis and energy storage. Company 10-Ks and investor decks supported average selling price (ASP) discovery, while paid datasets such as D&B Hoovers (financials) and Questel (patent families) sharpened competitive benchmarks. The sources cited are illustrative; many more publications and databases supported data gathering and validation.
Market-Sizing & Forecasting
A top-down and bottom-up hybrid model underpins the numbers. We began with top-down reconstruction of regional production and net trade, applied purity yield factors, and then allocated volumes to end uses through penetration-rate estimates tested in interviews. Bottom-up cross-checks, supplier roll-ups, and sampled ASP × volume calculations flagged anomalies that were iteratively reconciled. Key model drivers include: 1) announced nameplate capacity for >= 99 % imidazolium ILs, 2) average pack-level electrolyte loading per EV kWh, 3) patent publication momentum in task-specific ILs, 4) regional VOC threshold tightening, and 5) historical ASP inflation tied to fluorinated anion feedstocks. Multivariate regression anchored the 2025-2030 forecast, with scenario analysis around battery adoption shaping upside and downside cases. Data gaps in smaller geographies were bridged by applying weighted regional proxies validated with distributor feedback.
Data Validation & Update Cycle
Outputs pass three rounds of analyst review that compare totals with independent trade, price, and patent signals. Variances beyond preset bands trigger model reruns. Reports refresh annually; interim updates roll out when material events, such as plant closures, major regulatory shifts, or step-change technology wins, occur. A final pre-publication sweep ensures clients receive the most current view.
Why Our Ionic Liquid Baseline Commands Reliability
Published estimates often diverge; definitions, purity thresholds, and end-use inclusion choices vary, and currency conversions or update cadences compound the spread.
Key gap drivers include some publishers bundling deep eutectic or molten-salt chemistries, others embedding aggressive price escalators without triangulating against spot ASPs, and a few extending forecasts far beyond validated capacity pipelines, which inflates totals.
Benchmark comparison
| Market Size | Anonymized source | Primary gap driver |
|---|---|---|
| USD 39.14 M (2025) | Mordor Intelligence | - |
| USD 57.9 M (2024) | Global Consultancy A | Includes lab-scale IL blends and applies uniform 10 % y-y ASP rise |
| USD 55.35 M (2025) | Industry Journal B | Counts pilot-stage deep eutectic solvents within scope |
| USD 790 M (2025) | Regional Consultancy C | Broadly aggregates ionic-liquid systems, additives, and downstream formulations |
In short, by restricting the scope to true sub-100 deg C ionic liquids, grounding prices in verified transaction ranges, and updating models each year, Mordor Intelligence delivers a balanced, transparent baseline that decision-makers can trace back to clear variables and reproducible steps.


Key Questions Answered in the Report
What is the projected value of the ionic liquids market in 2031?
The ionic liquids market size is expected to reach USD 59.84 million by 2031 based on an 8.45% CAGR during 2026-2031.
Which region will lead future demand for ionic liquids?
Asia-Pacific is forecast to remain the largest and fastest-growing region, registering a 10.12% CAGR through 2031.
Why are ionic liquids gaining traction in electric-vehicle batteries?
Pyrrolidinium and fluorinated-anion ionic liquids widen electrochemical stability windows to 5.2 V, raising battery energy density by up to 20% while suppressing lithium dendrites.
What is the main cost barrier to wider ionic-liquid adoption?
Batch synthesis still exceeds USD 500 kg⁻¹, roughly two orders of magnitude higher than conventional aprotic solvents such as N-methyl-2-pyrrolidone.
How are regulatory agencies influencing ionic-liquid demand?
VOC emission limits in the European Union, China, and the United States are encouraging solvent substitution with non-volatile ionic liquids, accelerating market uptake in coatings and chemical synthesis.
Page last updated on:


