Infused Drugs Market Size and Share
Market Overview
| Study Period | 2020 - 2031 |
|---|---|
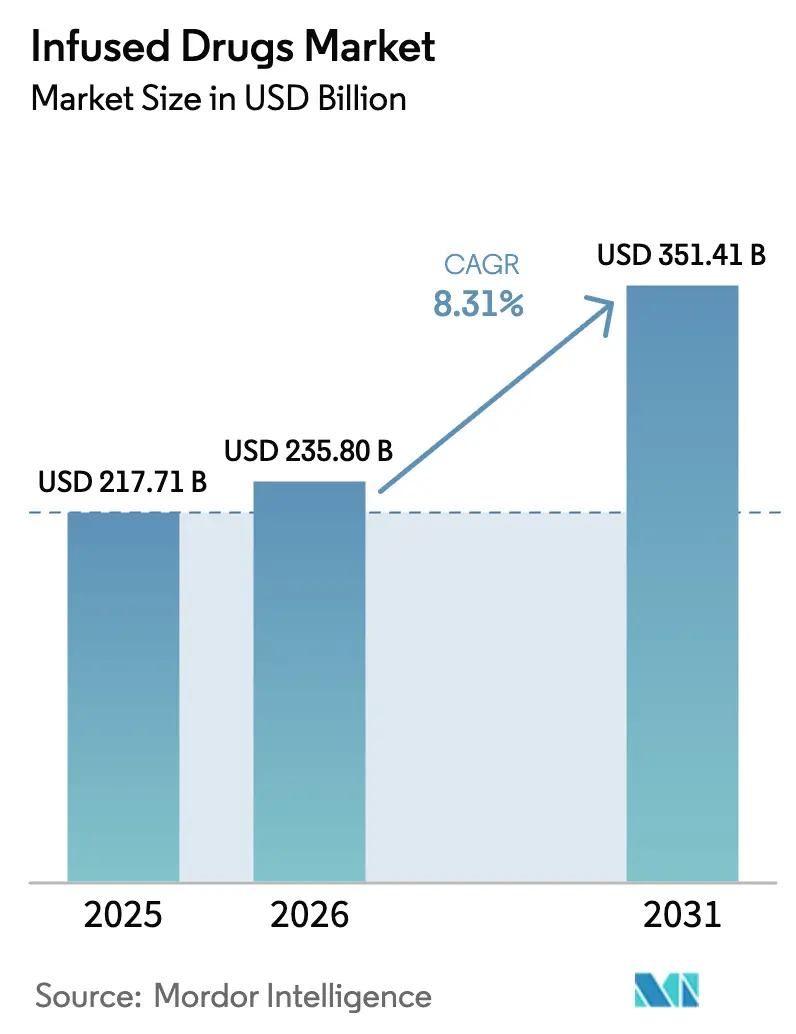
| Market Size (2026) | USD 235.8 Billion |
| Market Size (2031) | USD 351.41 Billion |
| Growth Rate (2026 - 2031) | 8.31% CAGR |
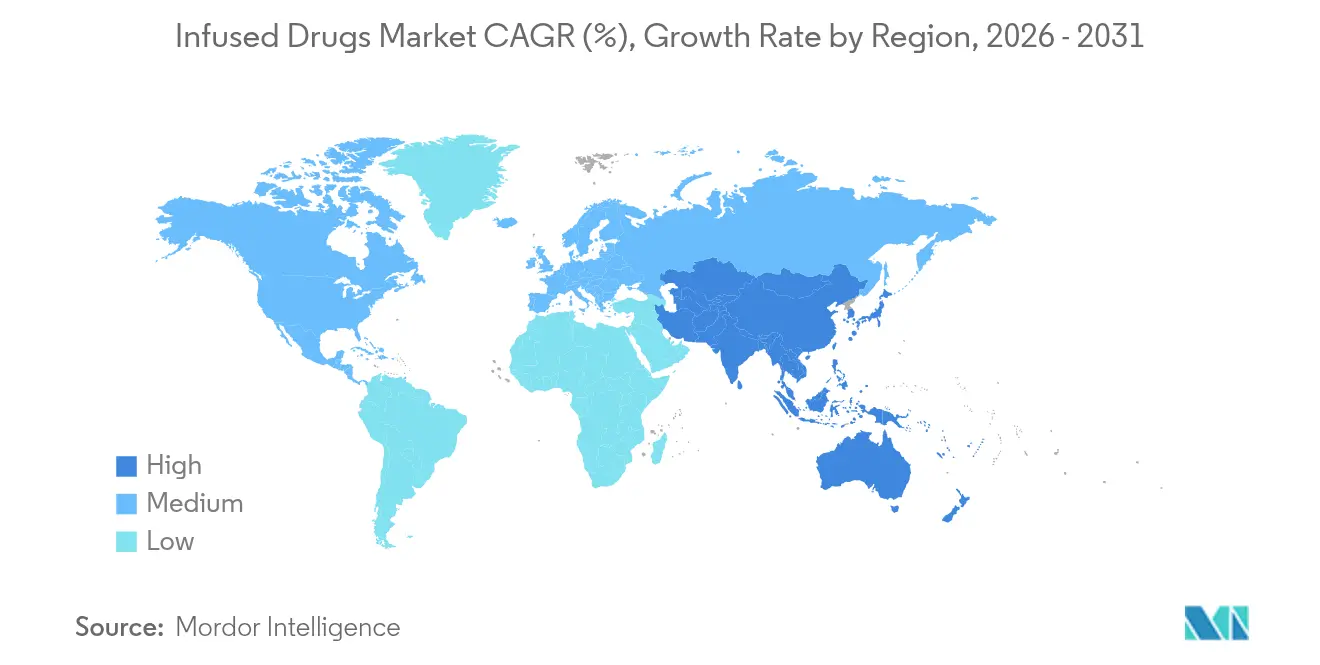
| Fastest Growing Market | Asia Pacific |
| Largest Market | North America |
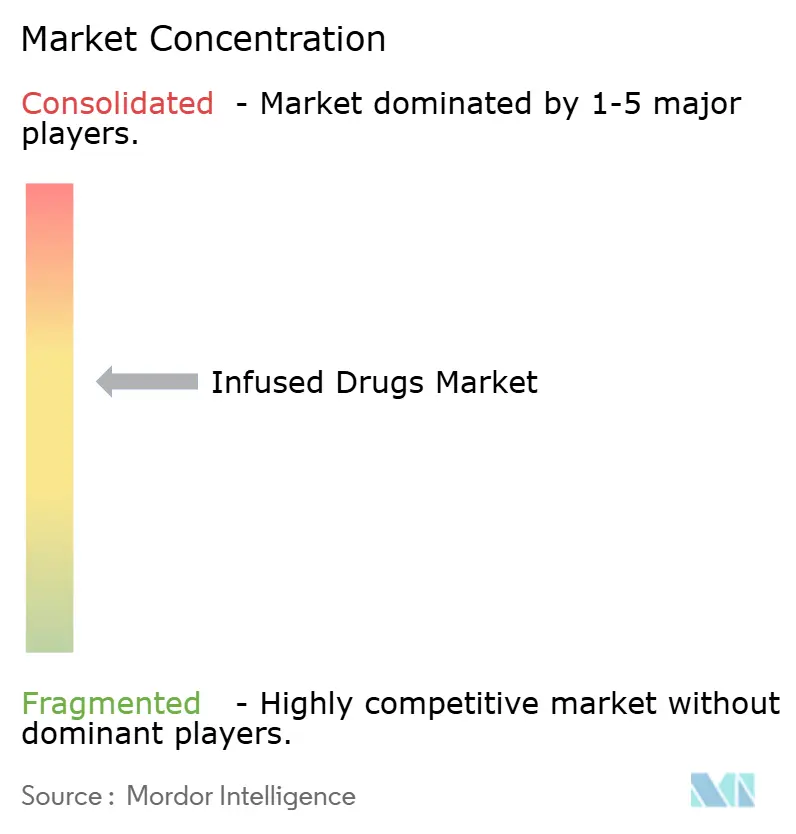
| Market Concentration | Medium |
Major Players *Disclaimer: Major Players sorted in no particular order Image © Mordor Intelligence. Reuse requires attribution under CC BY 4.0. | |
Infused Drugs Market Analysis by Mordor Intelligence
The infused drugs market size is expected to grow from USD 217.71 billion in 2025 to USD 235.8 billion in 2026 and is forecast to reach USD 351.41 billion by 2031 at 8.31% CAGR over 2026-2031. Growth stems from the swing toward biologics and advanced therapy medicinal products, wider adoption of home infusion models, and steady reimbursement tailwinds. A rising chronic disease burden, an aging population, and a robust pipeline of high-value specialty biologics are expanding treatment volumes and prompting new delivery settings. Technology advances—most notably AI-driven protocol optimisation and smart pump interoperability—support safety gains and throughput efficiencies that are pivotal for providers. Intensifying cost pressure and workforce shortages remain central hurdles, yet the infused drugs market continues to attract investment as scale and service breadth prove decisive.
Key Report Takeaways
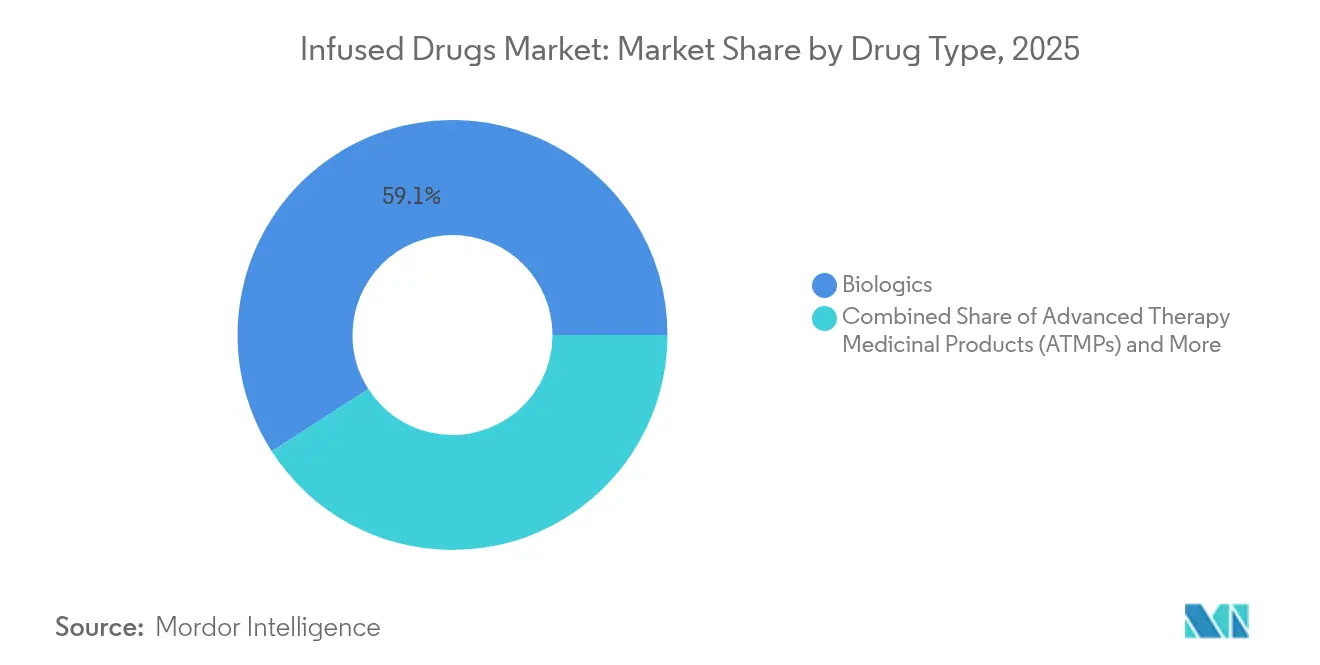
- By drug type, biologics held 59.10% of infused drugs market share in 2025; advanced therapy medicinal products are forecast to chart a 14.65% CAGR through 2031.
- By therapeutic area, oncology commanded 42.05% revenue share of the infused drugs market size in 2025, while neurology is set to expand at an 11.3% CAGR to 2031.
- By delivery setting, hospital in-patient infusion retained 63.05% share in 2025; home infusion is the fastest riser at 13.2% CAGR to 2031.
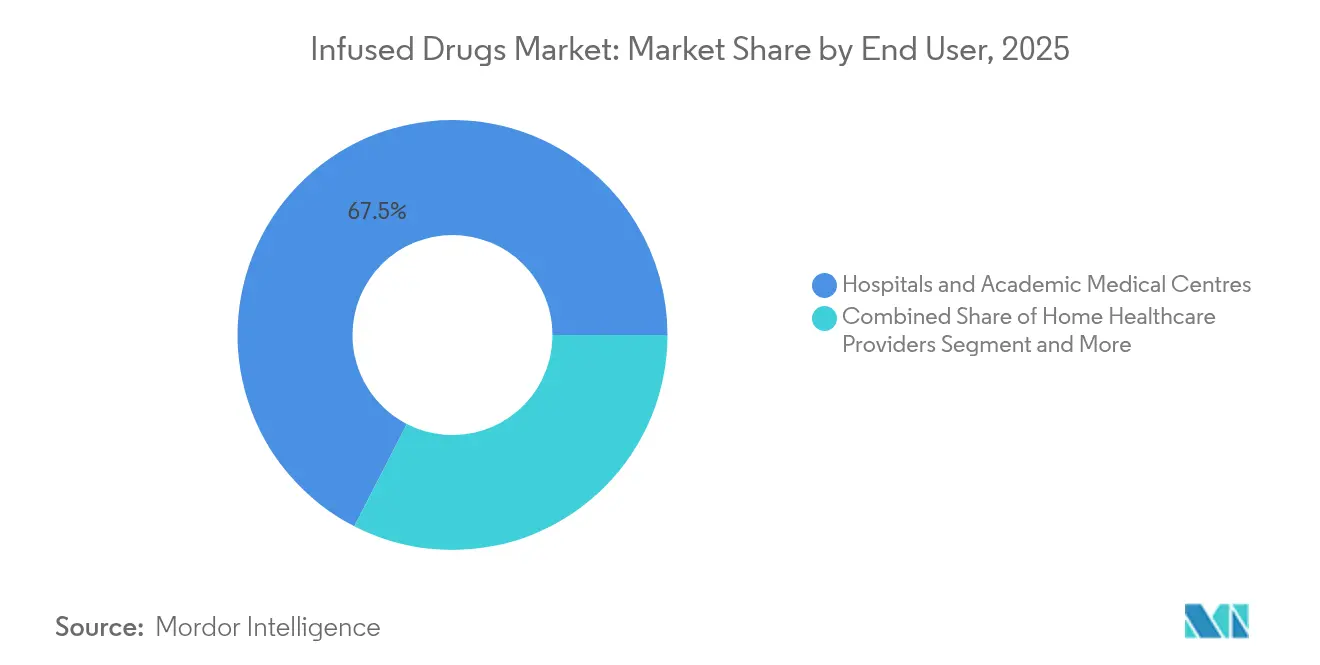
- By end user, hospitals and academic medical centers accounted for 67.45% of the infused drugs market size in 2025; home healthcare providers are projected to grow at 12.15% CAGR.
- By distribution channel, direct hospital procurement led with 53.60% of infused drugs market share in 2025; specialty pharmacy and 503B outsourcing facilities will accelerate at 14.25% CAGR through 2031.
- By geography, North America commanded 38.20% of the market size in 2025, whereas Asia-Pacific is anticipated to accelerate at an 9.35% CAGR through 2031.
Note: Market size and forecast figures in this report are generated using Mordor Intelligence’s proprietary estimation framework, updated with the latest available data and insights as of 2026.
Global Infused Drugs Market Trends and Insights
Drivers Impact Analysis*
| Driver | (~) % Impact on CAGR Forecast | Geographic Relevance | Impact Timeline |
|---|---|---|---|
| Rise In Chronic Disease Prevalence | +1.8% | Global, with highest impact in North America and Europe | Long term (≥ 4 years) |
| Rapidly Expanding Geriatric Population | +1.2% | Global, particularly APAC and North America | Long term (≥ 4 years) |
| Pipeline Of Specialty Biologics Requiring Infusion | +1.5% | North America & EU, spill-over to APAC | Medium term (2-4 years) |
| CMS Reimbursement Boost For Home-Infused Specialty Drugs | +0.9% | North America, with policy influence on other regions | Short term (≤ 2 years) |
| 503B Compounding Outsourcing Facilities Scaling Oncology Admixture Capacity | +0.7% | North America, expanding to select EU markets | Medium term (2-4 years) |
| AI-Driven Protocol Optimisation Reducing Chair-Time And Expanding Centre Throughput | +0.6% | Global, with early adoption in developed markets | Short term (≤ 2 years) |
| Source: Mordor Intelligence | |||
Rise in Chronic Disease Prevalence
Widespread chronic conditions now affect more than three-quarters of US adults, pushing treatment complexity upward and cementing infusion therapy’s role in disease management. Multimorbidity heightens the need for combination regimens, often anchored by monoclonal antibodies or small-volume chemotherapeutics that deliver optimal bioavailability only through infusion. Health-system budgets feel the strain of chronic illness care, yet efficiency gains tied to home infusion and value-based reimbursement keep the infused drugs market in expansion mode. Oncology providers benefit most, as infusion-centred regimens dominate first-line treatment algorithms.
Rapidly Expanding Geriatric Population
Increasing life expectancy adds waves of older patients whose autoimmune, cardiovascular, and neurodegenerative conditions rely on biologic infusions. Elderly cohorts prefer treatment close to home, spurring investment in portable pumps, remote monitoring, and streamlined protocols. Providers able to co-manage polypharmacy and comorbidity enjoy a clear volume advantage, reinforcing the infused drugs market’s pivot toward multidisciplinary, home-ready care models.
Pipeline of Specialty Biologics Requiring Infusion
Eight novel cell and gene therapies cleared US regulators in 2024, and double-digit annual approvals are forecast for 2025. Each newly approved therapy demands specialised cold-chain, admixture, and chair-time resources that bolster infrastructure spend. Orphan designations dominate the pipeline, underscoring small yet high-value patient segments willing to accept intensive infusion schedules. CDMOs are rapidly scaling vial-fill capacity, and 503B outsourcers are upgrading sterile suites, reinforcing the infused drugs market’s biologics-first trajectory.
CMS Reimbursement Boost for Home-Infused Specialty Drugs
A 2.9% rate lift for hospital outpatient services and expanded Medicare coverage for complex home infusions are tilting volumes away from inpatient wards[1]Centers for Medicare & Medicaid Services, “CY 2025 Hospital Outpatient Prospective Payment System Final Rule,” cms.gov. Reimbursement parity catalyses provider investment in nurse training, virtual observation platforms, and last-mile logistics, fostering sizeable home infusion gains and redistributing revenue streams across the infused drugs market.
Restraints Impact Analysis*
| Restraint | (~) % Impact on CAGR Forecast | Geographic Relevance | Impact Timeline |
|---|---|---|---|
| Systemic Side-Effects & Infusion Reactions | -0.8% | Global, with higher impact in emerging markets | Medium term (2-4 years) |
| High Treatment Cost & Payor Pressure | -1.2% | Global, particularly acute in US and EU | Short term (≤ 2 years) |
| Shortage Of Certified Infusion Pharmacists & Nurses | -0.9% | Global, most severe in North America | Long term (≥ 4 years) |
| Rising Cybersecurity Risk To Smart-Pump Fleets | -0.4% | Global, with higher impact in developed markets | Short term (≤ 2 years) |
| Source: Mordor Intelligence | |||
High Treatment Cost & Payor Pressure
Median launch prices for specialty drugs reached USD 300,000 in 2024, prompting insurers to trim benefits and pursue outcomes-based contracts. Payors scrutinise gene-therapy value propositions, leveraging biosimilar competition to blunt expenditure growth. Providers in the infused drugs market are adopting risk-sharing arrangements while emphasising real-world evidence that supports durable clinical outcomes and mitigates budget impact.
Shortage of Certified Infusion Pharmacists & Nurses
Escalating complexity in biologics handling collides with an already thin labour pool. Certified nurses and pharmacists are essential to manage infusion-related reactions, pharmacovigilance, and digital pump interfaces. Workforce scarcity inflates personnel costs, limits capacity expansion, and could slow rollout of new service lines, tempering infused drugs market acceleration until training pipelines shorten the gap.
*Our forecasts treat driver/restraint impacts as directional, not additive. The impact forecasts reflect baseline growth, mix effects, and variable interactions.
Segment Analysis
By Drug Type: Biologics Reshape Treatment Paradigms
Biologics captured 59.10% of infused drugs market share in 2025, reflecting clear clinical superiority in autoimmune and oncologic indications. Advanced therapy medicinal products are poised for 14.65% CAGR to 2031, underlining the next growth wave. Small molecules retain selective importance where rapid cytotoxic action is required.
Manufacturers are enlarging mammalian-cell bioreactors and single-use fill-finish lines to meet swelling demand, while provider organisations are upgrading cold-chain and sterility protocols. This infrastructure buildout cements the infused drugs market as a biologics-centric ecosystem. Moving forward, pay-for-performance contracts will favour providers who align therapeutic precision with fiscal accountability.


By Therapeutic Area: Oncology Leadership Amid Neurological Expansion
Oncology held 42.05% of the infused drugs market size in 2025, a function of high-volume immunotherapy regimens and the need for vigilant adverse-event management. Neurology’s 11.3% CAGR underscores fresh approvals in genetic and neurometabolic disorders.
Infusion centres now maintain on-site genomic testing and immune-cell labs to administer CAR-T or bispecific regimens safely. Updated infusion standards embed neurologic assessment scales, reinforcing cross-functional clinician training. Competitive advantage accrues to providers that seamlessly integrate oncologic and neurologic protocols, broadening case-mix and elevating the infused drugs market profile.
By Delivery Setting: Home Infusion Momentum Accelerates
Hospital inpatient wards still account for 63.05% of 2025 revenues, yet home infusion volumes are trending at 13.2% CAGR. Remote monitoring wearables transmit physiological data to command centres, enabling prompt intervention and adherence tracking.
Payers champion home-based care for cost containment, and patients welcome lower disruption. As Medicare reimbursement normalises across settings, health systems re-engineer care pathways, embedding pharmacist consultation and logistics planning into discharge processes. The resulting throughput relief enriches inpatient capacity while sustaining overall infused drugs market growth.
By End User: Specialty Providers Gain Competitive Edge
Hospitals and academic centres owned 67.45% of 2025 revenue, anchoring complex case management. Home healthcare organisations, growing at 12.15% CAGR, differentiate through flexible scheduling and patient-centric coaching.
Specialty clinics build reputational capital in discrete disease domains, capturing referral flows when outcomes outpace larger systems. Technology platforms that synchronise dosing records with EHRs allow distributed teams to deliver uniform quality. The infused drugs market increasingly rewards nimble operators that balance niche expertise with scalable safety infrastructure.
By Distribution Channel: Specialty Pharmacy Transformation
Direct hospital procurement governed 53.60% of 2025 sales, yet specialty pharmacy and 503B outsourcing facilities are expanding at 14.25% CAGR. Outsourcers mitigate drug scarcity by custom batching oncology admixtures, while specialty pharmacies refine cold-chain logistics and therapy-specific adherence services.
Stringent FDA oversight propels consolidation, advantaging well-capitalised players with advanced sterility analytics. Integration between pharmacy services and provider networks advances real-time utilisation visibility, optimising inventory turns and reinforcing reliability across the infused drugs market supply chain.
Geography Analysis
North America retained 38.20% of 2025 revenue, buoyed by robust reimbursement, accelerated drug approvals, and technology adoption. The FDA’s steady cadence of biologic and gene-therapy clearances sustains clinical pipeline depth, while CMS payment updates unlock faster migration to home settings. Mature EHR infrastructure supports AI-driven infusion analytics, cementing the region’s leadership within the infused drugs market.
Europe follows with entrenched universal coverage and an emphasis on cost-effectiveness evaluation. Coordinated action between the European Commission and EMA to streamline ATMP assessment may compress time-to-market and widen patient access. Germany, France, and the United Kingdom dominate revenue, but Southern Europe’s gradual uptake of specialty biologics adds incremental lift. Health technology assessments ensure budgetary discipline yet continue to endorse high-value therapies that satisfy unmet need, stabilising infused drugs market momentum.
Asia-Pacific offers the steepest growth at 9.35% CAGR. Rapid urbanisation, insurance expansion, and ageing demographics converge to expand procedure volumes. China and Japan spearhead biologic adoption, while India and South Korea make strides through domestic manufacturing incentives and public-private partnerships. Diverse regulatory environments require adaptive commercial models, yet ongoing harmonisation improves multi-country product launches, amplifying infused drugs market penetration.

Competitive Landscape
The infused drugs market shows moderate fragmentation. Big Pharma players such as AstraZeneca, Pfizer, and Roche leverage R&D heft and global commercial channels to defend share. Device innovators including Baxter, Fresenius Kabi, and B. Braun pursue connected-pump platforms that cut programming errors and feed real-time data to hospital analytics engines.
Digital-first start-ups devise AI dosing algorithms that trim chair time and predict adverse reactions, securing hospital partnerships through demonstrable error reductions. Consolidation is active, highlighted by the USD 7 billion Mallinckrodt-Endo merger aimed at scale plus distribution synergy. Quality credentials and cybersecurity readiness have become essential tender criteria as regulators intensify post-market surveillance. Providers and suppliers attuned to these imperatives will capture greater share of the infused drugs market.
Infused Drugs Industry Leaders
Sanofi SA
Amgen, Inc.
Teva Pharmaceutical Industries Ltd.
AstraZeneca plc
Bristol-Myers Squibb
- *Disclaimer: Major Players sorted in no particular order

Recent Industry Developments
- May 2025: FDA granted accelerated approval to telisotuzumab vedotin-tllv for advanced non-squamous NSCLC.
- April 2025: B. Braun Medical received FDA approval for piperacillin-tazobactam in its DUPLEX system, halving medication errors and shaving 4 minutes per dose.


Global Infused Drugs Market Report Scope
As per the scope of the report, IV infusion puts medicine, blood, or fluid directly into the bloodstream. This makes the treatment fast and powerful. The infused drugs market is segmented by drug, therapeutic area, and geography. By drug, the market is segmented into small molecules and biologics. In terms of therapeutic areas, the market is segmented into oncology, gastrointestinal diseases, rheumatoid arthritis, immune deficiencies, cardiology, neurology, diabetes, and other therapeutic areas. By geography, the market is segmented into North America, Europe, Asia-Pacific, Middle East and Africa, and South America. The market report also covers the estimated market sizes and trends for 17 countries across major regions globally. The report offers values in USD for the above segments.
| Small Molecules |
| Biologics |
| Advanced Therapy Medicinal Products (ATMPs) |
| Oncology |
| Auto-immune & Inflammatory Diseases |
| Metabolic Disorders |
| Neurology |
| Cardiovascular & Rare Diseases |
| Hospital In-patient Infusion |
| Hospital Out-patient / Ambulatory Infusion Centres |
| Home Infusion |
| Hospitals & Academic Medical Centres |
| Specialty Infusion Providers & Stand-alone Clinics |
| Home Healthcare Providers |
| Direct Hospital Procurement |
| Specialty Pharmacy & 503B Outsourcing Facilities |
| Retail & Online Pharmacies |
| North America | United States |
| Canada | |
| Mexico | |
| Europe | Germany |
| United Kingdom | |
| France | |
| Italy | |
| Spain | |
| Rest of Europe | |
| Asia-Pacific | China |
| Japan | |
| India | |
| South Korea | |
| Australia | |
| Rest of Asia-Pacific | |
| Middle East and Africa | GCC |
| South Africa | |
| Rest of Middle East and Africa | |
| South America | Brazil |
| Argentina | |
| Rest of South America |
| By Drug Type | Small Molecules | |
| Biologics | ||
| Advanced Therapy Medicinal Products (ATMPs) | ||
| By Therapeutic Area | Oncology | |
| Auto-immune & Inflammatory Diseases | ||
| Metabolic Disorders | ||
| Neurology | ||
| Cardiovascular & Rare Diseases | ||
| By Delivery Setting | Hospital In-patient Infusion | |
| Hospital Out-patient / Ambulatory Infusion Centres | ||
| Home Infusion | ||
| By End User | Hospitals & Academic Medical Centres | |
| Specialty Infusion Providers & Stand-alone Clinics | ||
| Home Healthcare Providers | ||
| By Distribution Channel | Direct Hospital Procurement | |
| Specialty Pharmacy & 503B Outsourcing Facilities | ||
| Retail & Online Pharmacies | ||
| Geography | North America | United States |
| Canada | ||
| Mexico | ||
| Europe | Germany | |
| United Kingdom | ||
| France | ||
| Italy | ||
| Spain | ||
| Rest of Europe | ||
| Asia-Pacific | China | |
| Japan | ||
| India | ||
| South Korea | ||
| Australia | ||
| Rest of Asia-Pacific | ||
| Middle East and Africa | GCC | |
| South Africa | ||
| Rest of Middle East and Africa | ||
| South America | Brazil | |
| Argentina | ||
| Rest of South America | ||


Key Questions Answered in the Report
What is the current size of the infused drugs market?
The infused drugs market stands at USD 235.8 billion in 2026, with expectations to reach USD 351.41 billion by 2031 at a 8.31% CAGR.
Which drug class holds the largest share in the infused drugs market?
Biologics dominate with a 59.10% share, reflecting strong efficacy in oncology and autoimmune diseases.
How fast is home infusion expected to grow?
Home infusion is forecast to record a 13.2% CAGR through 2031 as reimbursement parity and technology enable safe administration outside hospitals
Which region shows the quickest growth?
Asia-Pacific leads growth with a 9.35% CAGR due to expanding healthcare infrastructure and rising chronic disease prevalence
What are the main challenges facing the infused drugs market?
High therapy costs, payor pressure, and shortages of specialised infusion staff are the principal constraints on market expansion.
Page last updated on:


