Market Overview
| Study Period | 2020 - 2031 |
|---|---|
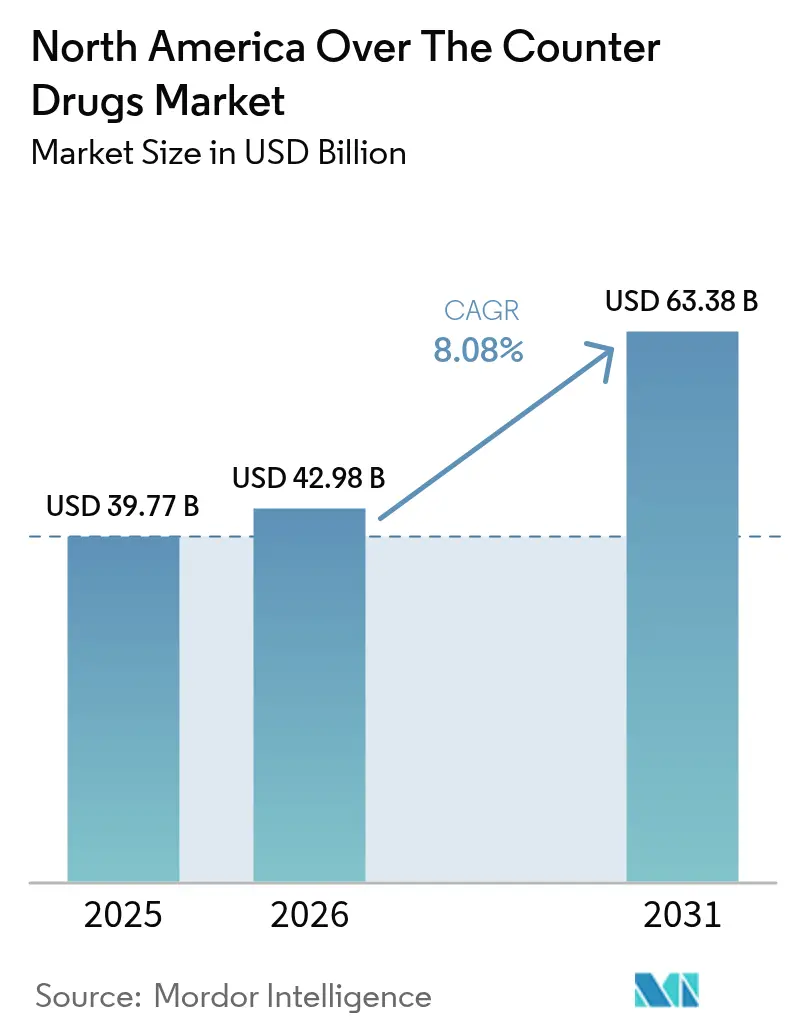
| Base Year Market Size (2025) | USD 39.77 Billion |
| Market Size (2026) | USD 42.98 Billion |
| Market Size (2031) | USD 63.38 Billion |
| Growth Rate (2026 - 2031) | 8.08% CAGR |
| Fastest Growing Market | Asia Pacific |
| Largest Market | North America |
Major Players *Disclaimer: Major Players sorted in no particular order Image © Mordor Intelligence. Reuse requires attribution under CC BY 4.0. | |
North America Over The Counter Drugs Market Analysis by Mordor Intelligence
The North America over the counter drugs market size in 2026 is estimated at USD 42.98 billion, growing from 2025 value of USD 39.77 billion with 2031 projections showing USD 63.38 billion, growing at 8.08% CAGR over 2026-2031. The acceleration rests on widespread self-medication, streamlined regulatory pathways, and digital access models that increase product visibility and price transparency. Demographic ageing sustains demand for chronic‐care remedies, while e-commerce reshapes how consumers discover, compare, and replenish non-prescription therapies. Simultaneously, FDA monograph modernization creates a clear route for prescription-to-OTC switches that broaden therapeutic scope and foster competition. Supply-chain localization initiatives, prompted by pandemic-era shortages, are also moving forward as manufacturers seek to limit exposure to Asian API hubs.
Key Report Takeaways
- By product type, cough & cold medicines led with 27.75% revenue share in 2025, while weight-loss products are projected to post a 9.32% CAGR through 2031.
- By distribution channel, retail pharmacies kept 60.85% of the North America Over the Counter drugs market share in 2025; online pharmacies are set to rise at an 17.95% CAGR to 2031.
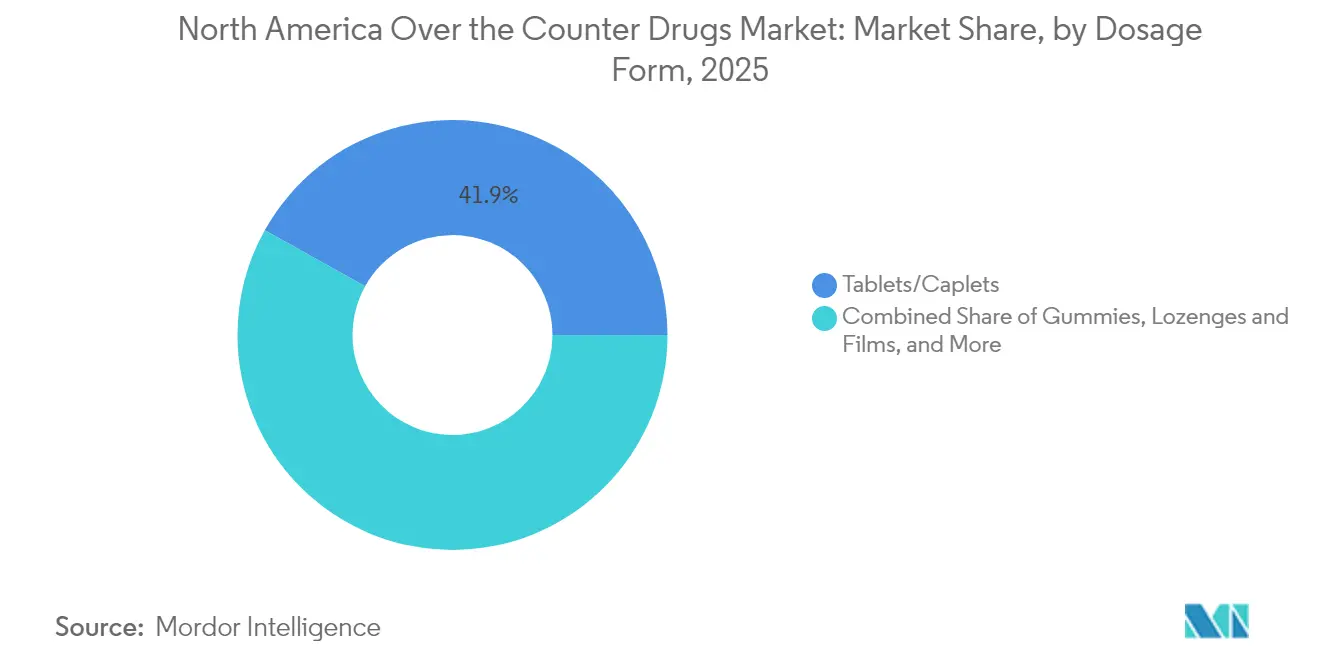
- By dosage form, tablets & caplets accounted for 41.90% of the North America Over the Counter drugs market size in 2025; gummies are forecast to expand at 11.92% CAGR
- By route of administration, oral products commanded 73.55% share of the North America OTC drugs market size in 2025 and are advancing at a 9.35% CAGR.
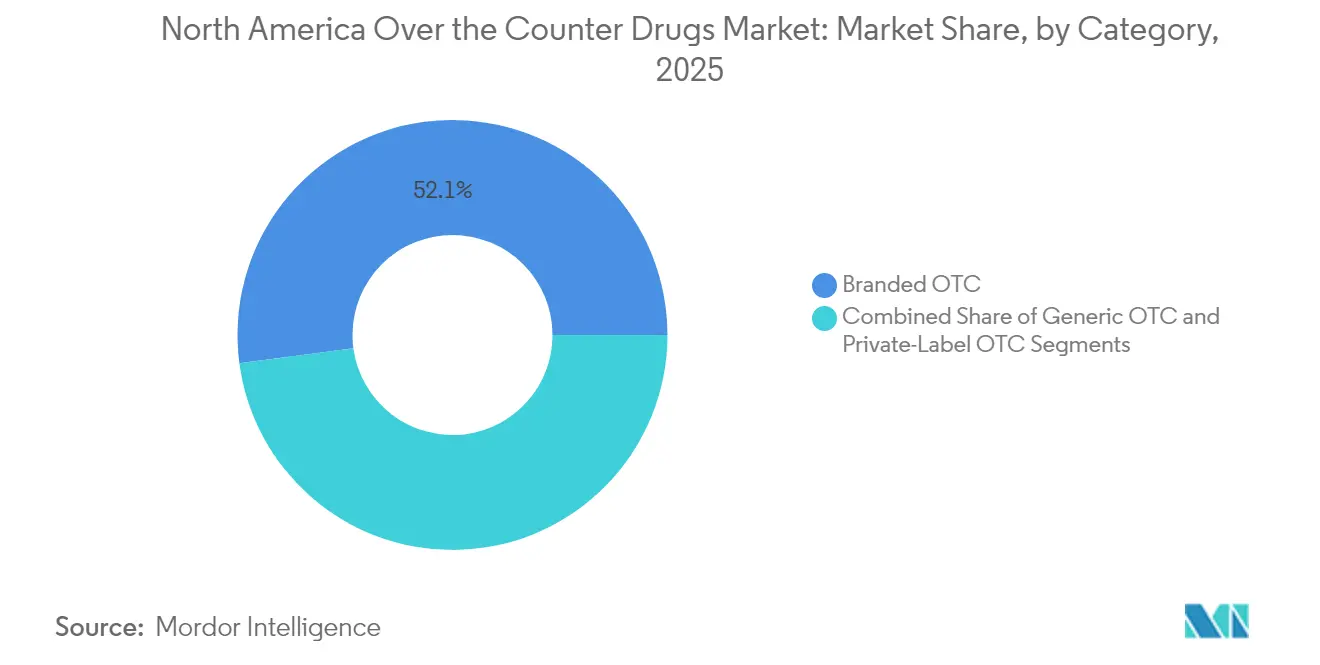
- By category, branded OTC items held 52.10% share in 2025; private-label alternatives are growing at 8.32% CAGR.
- By geography, the United States captured 73.00% revenue share in 2025, whereas Canada represents the fastest-growing territory at 6.86% CAGR.
Note: Market size and forecast figures in this report are generated using Mordor Intelligence’s proprietary estimation framework, updated with the latest available data and insights as of 2026.
North America Over The Counter Drugs Market Trends and Insights
Drivers Impact Analysis*
| Driver | % Impact on CAGR Forecast | Geographic Relevance | Impact Timeline |
|---|---|---|---|
| Shift Toward Self-Medication & Preventive Healthcare | +1.80% | Global, with strongest adoption in US urban centers | Medium term (2-4 years) |
| Rx-To-OTC Switch Approvals (Naloxone, Oral Contraceptive) | +1.20% | North America, with regulatory spillover to Mexico | Short term (≤ 2 years) |
| Expansion Of E-Commerce & Digital Pharmacy Platforms | +2.10% | North America, led by US metropolitan areas | Medium term (2-4 years) |
| Aging Population with Chronic Self-Care Needs | +1.50% | North America, concentrated in US and Canada | Long term (≥ 4 years) |
| Growth of Hispanic Consumer Demand For Herbal OTCs | +0.70% | US Southwest, California, Texas, Florida | Medium term (2-4 years) |
| AI-Driven Personalized OTC Recommendations | +0.40% | North America, early adoption in tech-forward regions | Long term (≥ 4 years) |
| Source: Mordor Intelligence | |||
Shift Toward Self-Medication & Preventive Healthcare
Eighty-one percent of adults now select OTC medicines as first-line relief, saving the health system USD 146 billion annually. Pandemic-era telehealth adoption familiarized consumers with self-triage and rising primary-care wait times, reinforcing the habit. Millennials and Generation Z show the strongest comfort with symptoms of self-management, fueling demand for condition-specific formulations and dosage innovations that prioritize convenience and taste. Manufacturers respond through smaller pack sizes and multi-symptom SKUs that align with home-medicine-cabinet behavior. The result is steady volume growth across pain, digestive, and immune-support lines within the North America OTC drugs market.
Rx-to-OTC Switch Approvals
The FDA cleared OTC-status naloxone in 2023 and the first daily oral contraceptive, Opill, in 2024. These landmark switches strip away prescriber barriers for public-health-critical therapies and establish a regulatory template for future transitions, including migraine abortives and cholesterol-lowering low-dose statins. The policy tailwind enlarges the North America OTC drugs market by introducing high-value categories traditionally reserved for prescription channels, spurring investment in consumer education and adherence packaging.
Expansion of E-Commerce & Digital Pharmacy Platforms
The North America OTC drugs market benefits as pure-play platforms leverage price transparency, auto-refill tools, and same-day delivery. CVS Health reported 6.6% 2024 segment growth after expanding digital fulfilment.[3]CVS Health, “Full-Year 2024 Financial Results,” cvshealth.com However, reimbursement compression is forcing chain pharmacies to close under-performing stores, reallocating staff toward clinical services. The blended model pushes manufacturers to harmonise pack design and e-commerce imagery, ensuring shelf and screen appeal.
Aging Population with Chronic Self-Care Needs
The 65+ cohort shows the highest per-capita OTC consumption, especially for pain, gastrointestinal, and cardiovascular support. These demographics value trusted brands and easy-open packaging, raising margins for established names in the North American OTC drugs market. Chronic disease overlaps drive use of non-prescription adjuncts such as low-dose aspirin or fibre supplements that complement prescription regimens. Age-tailored product innovation includes high-contrast labelling, arthritic-friendly lids, and once-daily extended-release formats, fostering loyalty and predictable reorder cycles.
Restraints Impact Analysis*
| Restraint | % Impact on CAGR Forecast | Geographic Relevance | Impact Timeline |
|---|---|---|---|
| Substance Misuse of Analgesics & Cough Medicines | -0.90% | North America, concentrated in rural and urban centers | Short term (≤ 2 years) |
| FDA Monograph Modernization Delays | -0.60% | United States, with regulatory spillover effects | Medium term (2-4 years) |
| API Supply-Chain Disruptions from Asia | -1.10% | North America, affecting generic and branded products | Short term (≤ 2 years) |
| PBM Margin Pressure Limiting Shelf Space for SMEs | -0.80% | United States, impacting independent manufacturers | Medium term (2-4 years) |
| Source: Mordor Intelligence | |||
Substance Misuse of Analgesics & Cough Medicines
Dextromethorphan and loperamide misuse prompted FDA package-size limits and age-verification programs, targeting adolescent abuse hotspots. The DEA recorded 84,076 drug-overdose deaths in 2024, and non-prescription products were present in a rising share of incidents. Retailers relocating high-risk SKUs behind the counter can cut impulse sales, trimming volume growth in the North American OTC drugs market. Manufacturers must balance tamper-proof features with user convenience to prevent consumer backlash.
API Supply-Chain Disruptions from Asia
Seventy-two percent of FDA-registered API plants sit outside the United States, mostly in China and India, and 80% of top generic molecules have no domestic source. Port congestion, export curbs, or geopolitical friction can stall production lines within weeks, triggering stock-outs and retailer fines in the North American OTC drugs market. Federal incentives aim to reshore critical ingredients, but capacity build-outs require multi-year capital outlays. In the interim, companies are dual-sourcing and increasing strategic inventory to protect service levels.
*Our forecasts treat driver/restraint impacts as directional, not additive. The impact forecasts reflect baseline growth, mix effects, and variable interactions.
Segment Analysis
By Product Type: Weight-Loss Lines Accelerate Volume Growth
Cough & cold medicines generated the most significant revenue slice at 27.75% in 2025, underscoring seasonal resilience and household replenishment patterns. Weight-loss and dietary OTCs, buoyed by public interest in GLP-1 analogues, deliver the highest 9.32% CAGR, lifting the North American over-the-counter drugs market size for metabolic care solutions. Formulators focus on stimulant-free blends, plant extracts, and satiety fibers to comply with evolving safety expectations. Analgesics still anchor basket value but face stricter labelling around acetaminophen hepatic risk. Dermatology creams and gastrointestinal remedies round out portfolios that address lifestyle-linked conditions across all age cohorts.
Second-order dynamics highlight cross-category innovation. Seattle Gummy secured the first IND for an allergy treatment in gummy form, signaling delivery-format convergence. As a result, cough relief chews and fiber gummies migrate toward areas previously dominated by tablets, supporting adherence and driving incremental sales within the North America OTC drugs market.


By Distribution Channel: Online Momentum Reshapes Shelf Strategy
Retail pharmacies preserved a 60.85% share in 2025 by offering pharmacist guidance and insurance-linked footfall. Yet online pharmacies’ 17.95% CAGR captures the loyalty of digital natives seeking 24/7 availability and subscription savings, steadily redirecting flows from storefront to screen. Hospitals keep a niche role for discharge packs and acute-care bundles. Convenience stores extend assortments to monetise quick-trip missions, serving commuters and rural deserts underserved by large chains.
Traditional chains respond by offering same-day delivery and curbside pick-up and integrating loyalty apps that transfer couponing to mobile wallets. These omnichannel moves aim to hold basket size inside the North American OTC drugs market and defend against pure-play entrants that wield algorithmic pricing and AI-driven counselling. Pharmacy staff are being redeployed into vaccination and point-of-care testing, a differentiator that online platforms cannot replicate at scale.
By Dosage Form: Gummies Bring Taste to Therapy
Tablets & caplets remain the workhorse with a 41.90% share, offering cost-efficiency and stability. Gummies, chewable, and orally disintegrating formats post a 11.92% CAGR as taste and texture override price sensitivity for pediatrics and seniors. The FDA’s June 2025 administrative order lets manufacturers migrate tablet monographs to chewable without full re-filing, unlocking speed-to-market for flavor innovations and boosting revenues across the North American OTC drugs market.
Aenova’s EUR 8 million gummy plant expansion exemplifies capacity bets on this trend. Liquids and syrups sustain pediatric respiratory care, while sprays, drops, and topicals tackle site-specific delivery where speed and localized effect matter. As taste-masking, sugar-free bases, and clean-label colors mature, gummies are poised to capture share from less palatable formats, lifting overall consumer adherence metrics.
By Route of Administration: Oral Dominance Continues
Oral products control 73.55% of 2025 sales with a parallel 9.35% CAGR, reflecting consumer familiarity and manufacturing economies. Swallowing aids, scoring lines, and micro-tablet technology further improve acceptance. Topicals grow through analgesic gels and anti-itch creams that bypass systemic exposure. Nasal sprays capitalize on quick onset for allergy relief, while ophthalmic solutions answer screen fatigue. Rectal and vaginal routes play limited but essential roles in haemorrhoid and vaginal health niches, sustaining stable though smaller contributions to the North American OTC drugs market.
Regulatory momentum that shifts low-dose statins or antihistamines to OTC could reinforce oral volume dominance. Nonetheless, sublingual films and buccal melts are gathering attention for speed and convenience, signaling that administration diversity will continue to broaden the appeal of non-prescription care.
By Category: Private-Label Edges into Premium Sets
Branded products preserved a 52.10% slice in 2025, benefiting from trust, advertising heft, and physician recall. Private-label lines, however, grow at 8.32% CAGR as retailers exploit shelf analytics and in-house sourcing to undercut national brands without compromising quality. Perrigo’s dedicated self-care focus after divesting generics shows that high-volume contract supply can be lucrative when paired with retailer exclusivity.
Shelf reset cycles increasingly position store brands at eye level, eroding brand visibility. PBMs amplify the shift by steering rebates and preferring tier placements toward lower-cost alternatives. In response, brand owners emphasize patented ingredients, child-resistant packs, and consumer-education campaigns that explain differentiated time-release technologies. The tug-of-war keeps pricing disciplined yet sparks innovation that ultimately enlarges the North American OTC drugs market.
Geography Analysis
The United States retains a commanding 73.00% share of the North America OTC drugs market, underpinned by the world’s largest consumer-health economy. The FDA collected USD 32 million in 2024 user fees that speed monograph reviews. January 2025 ACNU finalization further lowers Rx-to-OTC barriers, opening new volume streams once safety profiles align with self-selection criteria. Retail OTC sales hit USD 43.4 billion in 2023, and 96% of U.S. shoppers believe these products empower self-care.Challenges persist around PBM margin expansion, which climbed to 31% in 2022 and squeezes pharmacy profitability, prompting shelf rationalization that can penalize emerging labels.
Canada records the quickest growth at 6.86% CAGR through 2031 as its single-payer system steers non-urgent conditions toward OTC routes. Regulatory alignment with U.S. monograph reforms accelerates product clearances and encourages cross-border supply synergies. Ageing demographics and rising out-of-pocket costs intensify self-treatment for arthritis, heartburn, and cognitive health, expanding category breadth within the Canada slice of the North America OTC drugs market. Manufacturers leverage bilingual packaging and pharmacist-led counselling programs to nurture trust and drive product trial.
Mexico presents an emerging opportunity in the North America OTC drugs market. OTCs account for 14% of its pharmaceutical spend, and U.S. exports reached USD 875 million in 2022, reflecting strong bilateral trade. COFEPRIS approval timelines remain a hurdle, but new expedited pathways for innovative therapies show promise. Economic sensitivity favors low-cost generics and herbal preparations, yet urban middle-class segments exhibit growing appetite for branded multisymptomatic and pediatric SKUs. Nearshore manufacturing interest is rising as companies seek to mitigate API shipping risk and leverage USMCA rules-of-origin benefits.
Competitive Landscape
The North America over the counter drugs market remains moderately fragmented. Johnson & Johnson, Bayer, GSK, and Pfizer wield extensive brand portfolios, scaled advertising, and physician relationships that sustain category leadership. Private-label specialist Perrigo services major retailers, supplying equivalence-tested SKUs that match national-brand quality at lower price points, thereby capturing margin while boosting retailer loyalty. Reckitt’s USD 145 million Mucinex plant in North Carolina showcases investment in domestic supply that shortens lead times and improves origin transparency.
Digital capability is a critical differentiator. Larger groups deploy AI recommendation engines that guide shoppers to symptom-matched baskets, though recent testing found only 21% of chat outputs met professional accuracy standards. Strategic partnerships with telehealth portals and wellness apps allow incumbents to capture first-touch demand and increase basket depth. Meanwhile, pure-play online pharmacies apply dynamic pricing and personalized promotions that chip away at brick-and-mortar share.
Supply-chain resilience is a shared priority after pandemic shortages. Companies diversify API sourcing, fortify inventory pipelines, and lobby for tax credits that incentivize U.S. ingredient production. Vertical integration across packaging and last-mile distribution reduces dependency on third parties and improves recall responsiveness, factors that bolster consumer trust and protect market share inside the North America OTC drugs market.
North America Over The Counter Drugs Industry Leaders
Sanofi
Johnson and Johnson
Novartis AG
Pfizer Inc
Bayer AG
- *Disclaimer: Major Players sorted in no particular order

Recent Industry Developments
- January 2025: The FDA finalized the ACNU rule, enabling prescription medicines to convert to OTC status under defined consumer self-screening conditions


Research Methodology Framework and Report Scope
Market Definitions and Key Coverage
Our study defines the North America over-the-counter (OTC) drugs market as all non-prescription medicines that carry an FDA or Health Canada OTC monograph or final order, plus approved Rx-to-OTC switch products that are sold through pharmacy, grocery, convenience, mass-merchandiser, and licensed e-commerce outlets across the United States, Canada, and Mexico.
Scope Exclusion: dietary supplements, herbal nutraceuticals, and consumer health devices such as thermometers or test kits are outside the scope.
Segmentation Overview
- By Product Type
- Cough, Cold & Flu Products
- Analgesics
- Dermatology Products
- Gastrointestinal Products
- Vitamins, Minerals & Supplements (VMS)
- Weight-loss / Dietary Products
- Ophthalmic Products
- Sleeping Aids
- Other Product Types
- By Distribution Channel
- Hospital Pharmacies
- Retail Pharmacies
- Online Pharmacies
- Convenience / Grocery Stores
- By Dosage Form
- Tablets & Caplets
- Liquids & Syrups
- Gummies & Chewables
- Sprays & Drops
- Topicals & Ointments
- By Route of Administration
- Oral
- Topical
- Nasal
- Ophthalmic
- Rectal / Vaginal
- By Category
- Branded OTC
- Private-label / Store Brands
- Generic OTC
- Geography
- United States
- Canada
- Mexico
Detailed Research Methodology and Data Validation
Primary Research
Mordor analysts interviewed formulators, chain pharmacists, independent drug store owners, online pharmacy managers, and regulatory consultants in all three countries. These discussions validated market drivers, typical pack sizes, e-commerce share shifts, and margin structures, filling gaps left by secondary data and grounding our model assumptions.
Desk Research
We begin with publicly available pillars such as FDA's National Drug Code directory, Health Canada Drug Product Database, CDC and Statistics Canada health expenditure series, CHPA sales dashboards, OECD trade statistics, and UN Comtrade shipment records. These datasets anchor product definitions, regional unit flows, and channel splits.
Company 10-Ks, quarterly calls, and investor decks are scraped through D&B Hoovers and Dow Jones Factiva, which let us cross-check brand revenue breakouts and average selling prices, while peer-reviewed journals and patent searches via Questel clarify pipeline switch candidates. The sources noted are illustrative; several other open and subscription assets were referenced for verification and clarification.
Market-Sizing & Forecasting
A top-down build starts with national consumer health expenditure and retail sell-out data, which are then adjusted for OTC penetration rates and Rx-to-OTC switch volumes. Select bottom-up checks, sampled brand revenue roll-ups, channel audits, and ASP × pack estimates help reconcile totals. Key variables include average pack price progression, incidence of self-medication episodes, number of approved switch products, digital pharmacy share, per-capita disposable income, and adult population growth. Forecasts draw on multivariate regression blended with scenario analysis to capture regulatory switch pipelines and macroeconomic swings, with gap handling through interpolation where pack-level data are sparse.
Data Validation & Update Cycle
Model outputs undergo automated variance scans against historical series, followed by analyst peer review. Any anomaly triggers re-contact with field respondents. Reports refresh annually; material events, such as major switch approval or regulation change, prompt interim updates, and every delivery includes a fresh validation pass.
Why Mordor's North America OTC Drugs Baseline Commands Reliability
Published figures often diverge because firms pick different market scopes, input series, and refresh cadences. We acknowledge this spread upfront and lay out why numbers vary.
Benchmark comparison
| Market Size | Anonymized source | Primary gap driver |
|---|---|---|
| USD 39.77 B (2025) | Mordor Intelligence | - |
| USD 74.83 B (2024) | Regional Consultancy A | Adds dietary supplements and functional foods to core OTC drugs |
| USD 20.78 B (2024) | Trade Journal B | Tracks only brick-and-mortar pharmacy sell-out, omits e-commerce and convenience stores |
| USD 52.8 B (2024, US only) | Global Consultancy A | Uses U.S. value as regional proxy and ignores Canada & Mexico adjustments |
The comparison shows that when scope creep or channel omissions are stripped away, Mordor's disciplined, transparently sourced model offers a balanced baseline that decision-makers can replicate and stress-test with confidence.


Key Questions Answered in the Report
What is the current size of the North America OTC drugs market?
The market generated USD 42.98 billion in 2026 and is on track to reach USD 63.38 billion by 2031, reflecting an 8.08% CAGR.
Which product category is growing fastest?
Weight-loss and dietary OTC products are projected to expand at 9.32% CAGR, the highest among all categories to 2031.
How significant is e-commerce in OTC sales?
Online pharmacies are forecast to grow at 17.95% CAGR, outpacing all other channels and reshaping purchasing patterns.
What impact does FDA monograph reform have on the market?
Monograph modernization and the ACNU rule shorten approval timelines and enable prescription-to-OTC switches, adding new revenue streams for manufacturers.
Why are supply-chain vulnerabilities a concern?
About 72% of FDA-registered API facilities operate outside the United States, so geopolitical or logistical disruptions in Asia can quickly cause North American stock-outs.
Are private-label OTC products overtaking branded lines?
Brands still hold 52.10% share, but private-label items are growing faster at 8.32% CAGR as retailers leverage price and shelf positioning to win shoppers.
Page last updated on:


