
Infrastructure Construction Market Size and Share
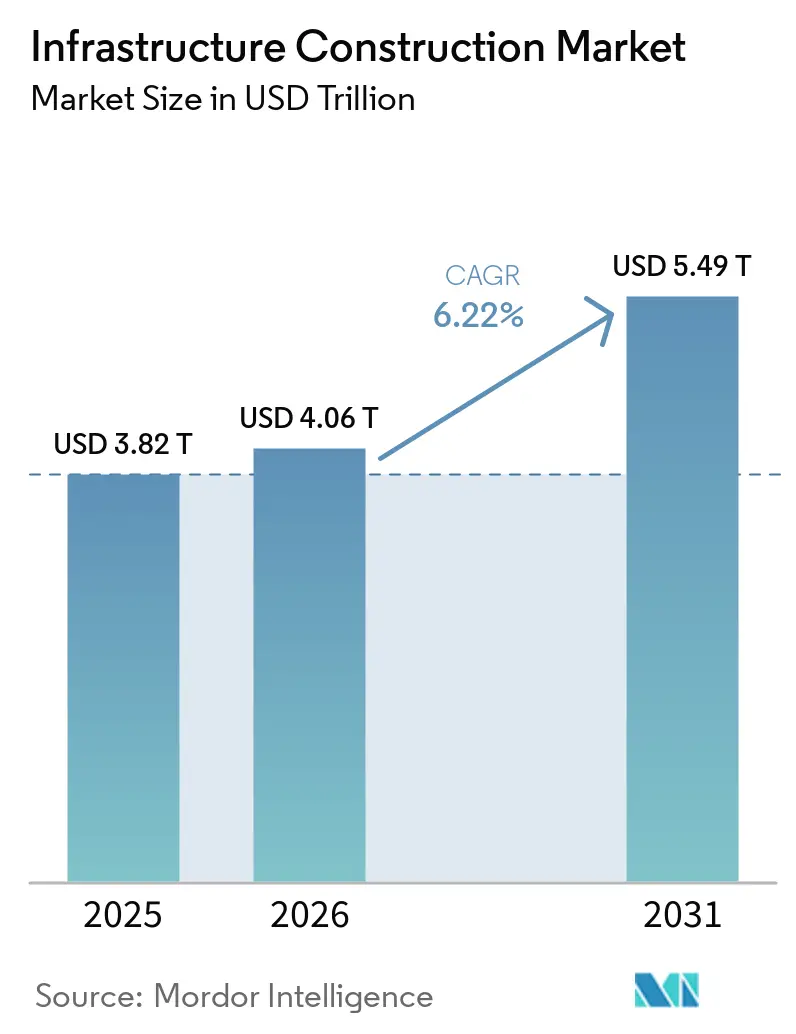
Infrastructure Construction Market Analysis by Mordor Intelligence
The infrastructure construction market size is expected to increase from USD 4.06 trillion in 2026 to USD 4.31 trillion in 2027 and reach USD 5.76 trillion by 2032, growing at a CAGR of 5.96% over 2027-2032.
Renewal needs and renewable power deployment expand demand for construction that upgrades existing assets and delivers new generating capacity. Proposed public investment in India provides a funding context for infrastructure programs, while cross-border transport funding in Poland and Moldova connects construction opportunities across national networks. Financing constraints, approval requirements and United States construction input-cost pressure that followed the June 2025 increase in steel and aluminum tariffs can limit the conversion of identified need into executable projects. Contractors able to price and sequence engineering, procurement and site work together are better placed on the projects that do reach construction.
Key Report Takeaways
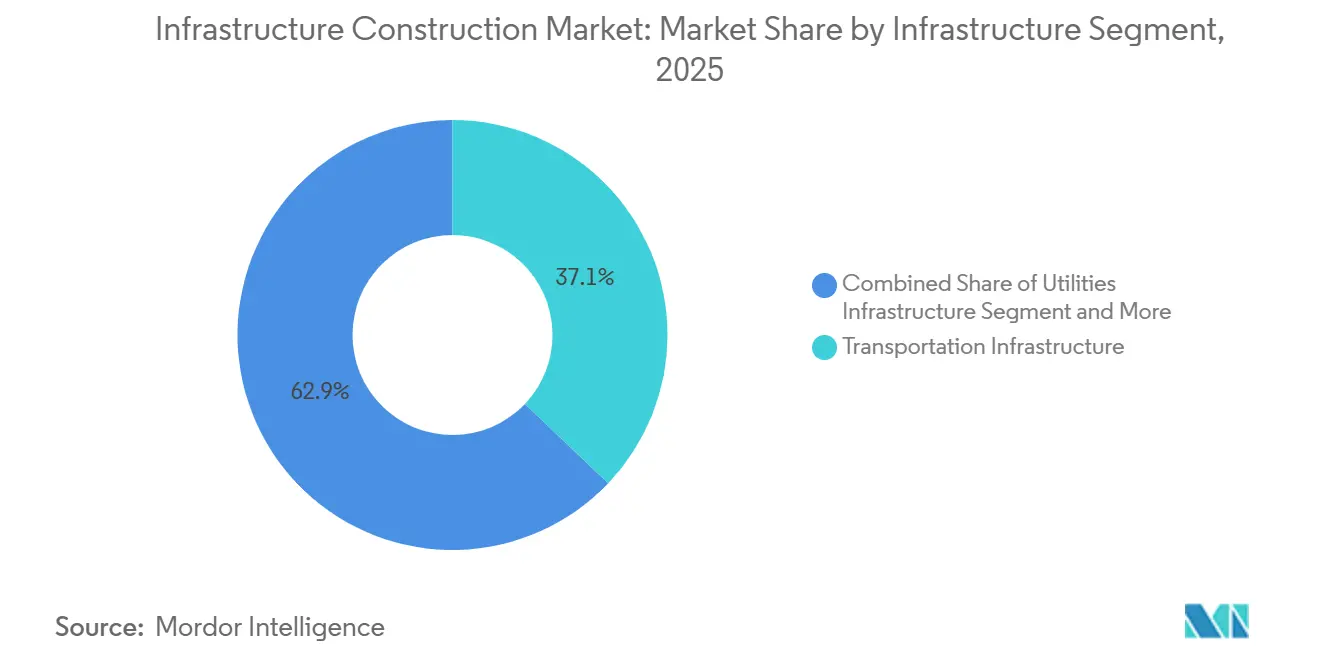
- Across infrastructure segments, transportation infrastructure led with a 37.29% infrastructure construction market share in 2026, and utilities infrastructure is the fastest-growing segment with a forecast CAGR of 6.62% over 2027-2032.
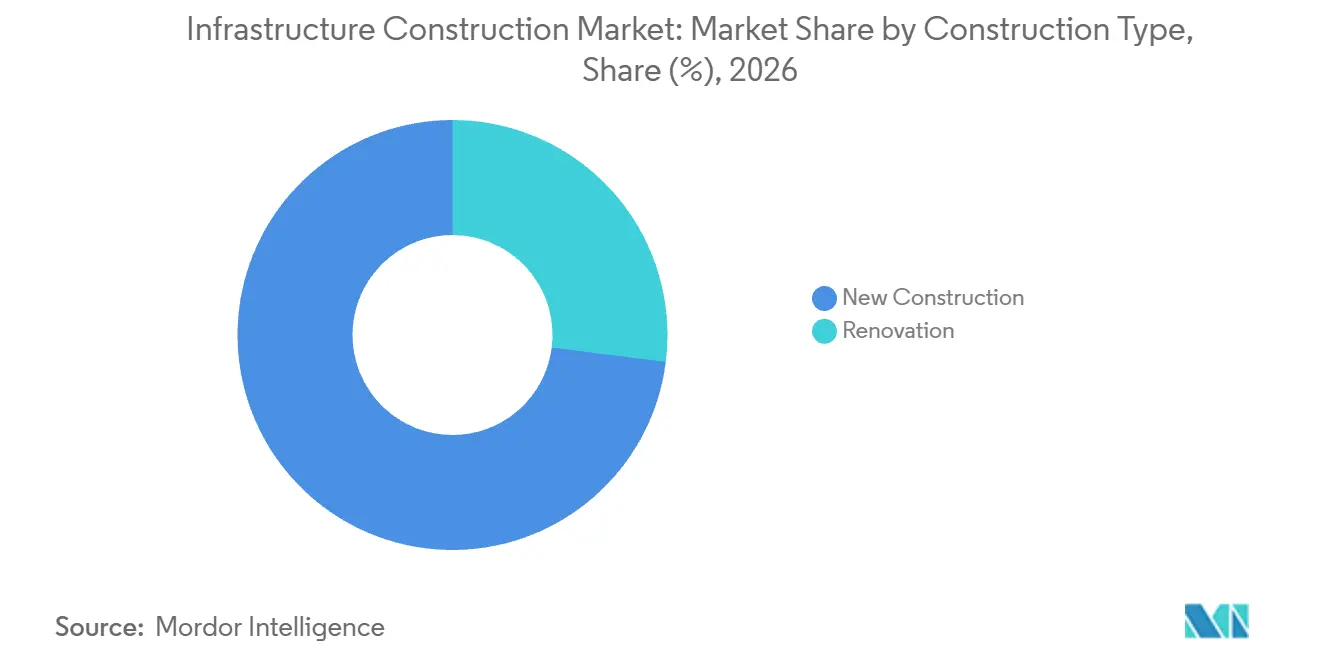
- By construction type, new construction accounted for a 73% share of the infrastructure construction market size in 2026, while renovation is the fastest-growing segment with a forecast CAGR of 6.75% over 2027-2032.
- For investment sources, public investment led with a 60.84% share of the market in 2026, and private investment is forecast to grow fastest at a 6.95% CAGR over 2027-2032.
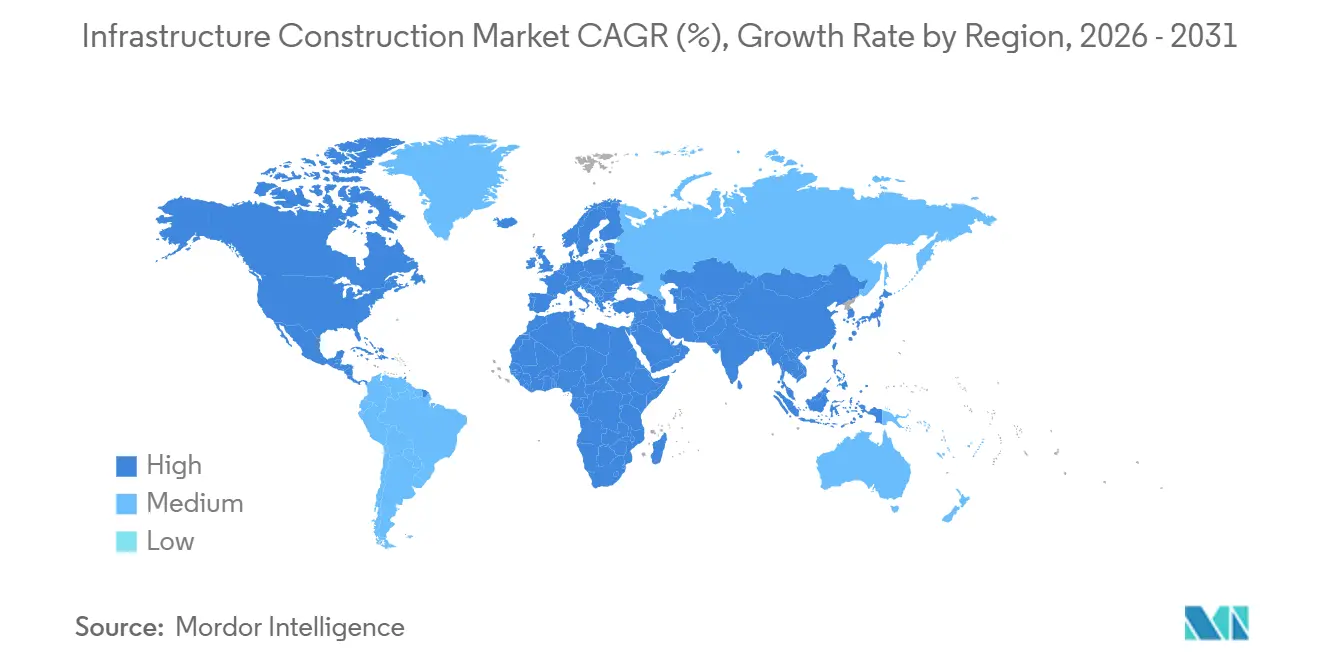
- Geographically, Asia-Pacific held the largest share at 46.14% in 2026, while the Middle East and Africa is forecast to grow fastest at a 7.1% CAGR over 2027-2032.
Note: Market numbers in this report are based on Mordor Intelligence's proprietary estimation framework, which combines nine months of actuals with Q4 projections for base year 2026.
Market Trends and Insights
Drivers Impact Analysis of Infrastructure Construction Market*
| Driver | (~) % Impact on CAGR Forecast | Geographic Relevance | Impact Timeline |
|---|---|---|---|
| Aging infrastructure renewal driving upgrades in transport, water, and power assets. | +2% | United States of America | Medium term (2-4 years) |
| Public capex, stimulus, and PPPs expanding long-term project pipelines. | +2.5% | Poland, Slovakia, Romania, Ukraine and Moldova | Medium term (2-4 years) |
| Energy transition spend boosting renewables, grids, storage, and EV charging builds. | +2.2% | China, United States and European Union | Long term (≥ 4 years) |
| Urban transit and logistics corridor expansion supporting major mobility infrastructure. | +1.6% | Mointy and Kyzylzhar | Long term (≥ 4 years) |
| Climate resilience spending increasing flood, coastal, and water-system projects. | +0.8% | Chattogram and Sylhet | Long term (≥ 4 years) |
| Source: Mordor Intelligence | |||
Aging infrastructure renewal driving upgrades in transport, water, and power assets.
Aging water assets create construction demand that extends beyond replacing individual pipes. The American Water Works Association projects USD 2.1 trillion to USD 2.4 trillion in US drinking-water infrastructure needs over 2026-2050, in 2025 dollars.[1] Aging infrastructure is among the cost drivers, alongside regulatory compliance, resilience, cybersecurity, operations and maintenance, and more complex water sources. For utility owners, these overlapping requirements make renewal a question of which capabilities a rebuilt system must deliver. Contractors can therefore address replacement work alongside the associated treatment and resilience requirements rather than treating every intervention as a standalone excavation. The 2026-2050 range far exceeds earlier estimates focused mainly on buried-pipe replacement, so pipe-only rehabilitation would leave other identified drinking-water infrastructure needs unaddressed.
Public capex, stimulus, and PPPs expanding long-term project pipelines.
Cross-border construction pipelines benefit when a funding program supports linked infrastructure across national boundaries. In November 2025, the European Commission handed over Connecting Europe Facility grant agreements for transport projects in Poland, Slovakia, Romania, Ukraine and Moldova. The funding supported cross-border projects and the EU-Ukraine Solidarity Lanes. For project owners, this mechanism connects individual national assets with a transport route that requires more than one segment to function. Contractors can address packages whose commercial rationale depends on cross-border connectivity, with grant agreements providing a concrete funding step before construction delivery. The agreements cover projects in 5 countries, so one funding program spans several national jurisdictions.
Energy transition spend boosting renewables, grids, storage, and EV charging builds.
Renewable power deployment creates construction demand with a pronounced concentration in solar generation. The International Renewable Energy Agency reported a record 692 GW of renewable power capacity additions worldwide in 2025, expanding the renewable capacity stock by 15.5%.[2] Solar accounted for nearly three-quarters of additions, with 510 GW added, while wind contributed 159 GW. For project owners, the deployment challenge includes turning generating equipment into installed assets, creating a delivery role alongside equipment supply. The concentration gives solar construction specialists access to a substantial deployment workload without requiring them to offer every type of energy-transition infrastructure.
Urban transit and logistics corridor expansion supporting major mobility infrastructure.
Rail-corridor construction can create value by removing a detour rather than merely adding track alongside an existing route. In February 2026, the World Bank approved a USD 846 million guarantee to mobilize USD 1.41 billion in commercial financing for a Kazakhstan rail project. The project will finance a new 322.3-kilometer greenfield line between Mointy and Kyzylzhar on the Middle Corridor. The planned link was designed to shorten the corridor by 149 kilometers, relieve congestion and enable double-stack container operations. For freight users, those objectives connect civil construction with route length and train-loading capability. The USD 846 million guarantee intended to mobilize USD 1.41 billion in commercial financing shows how a multilateral backstop can bring lenders into a greenfield line of this size.
Restraints Impact Analysis of Infrastructure Construction Market*
| Restraint | (~) % Impact on CAGR Forecast | Geographic Relevance | Impact Timeline |
|---|---|---|---|
| Funding gaps, fiscal pressure, and high rates limiting project affordability. | -1.4% | United States of America | Medium term (2-4 years) |
| Permitting, land acquisition, and regulatory delays slowing execution. | -1% | North Warwickshire Borough | Medium term (2-4 years) |
| Cost inflation, supply volatility, and labor shortages pressuring delivery and margins. | -0.7% | United States of America | Short term (≤ 2 years) |
| Source: Mordor Intelligence | |||
Funding gaps, fiscal pressure, and high rates limiting project affordability.
Construction need does not automatically translate into financeable work for contractors. International project finance, mainly focused on infrastructure, fell 16% in value in 2025 compared with 2024.[3] The American Society of Civil Engineers estimated a USD 3.7 trillion investment gap across all 18 US Report Card infrastructure categories for 2024-2033 if Congress continued recent funding levels. The two indicators show different constraints, with investors reluctant to make long-term financing commitments for large infrastructure projects and the conditional US gap measuring needs beyond forecast investment. For public owners and private sponsors, the commercial bottleneck is committed funding that turns proposed assets into construction packages. UNCTAD described the 2025 decline as the fourth consecutive year of downturn in international project finance, indicating sustained pressure on financing for large infrastructure projects.
Permitting, land acquisition, and regulatory delays slowing execution.
Separate planning permission can become a legal requirement for revised works even where a project-specific statute authorizes them. On June 30, 2026, England's Court of Appeal ruled that HS2's Bromford Tunnel Extension and eastern portal lacked deemed permission under the High Speed Rail (London-West Midlands) Act 2017. The court held that the Act authorized the revised works but that separate planning permission was required. The ruling was under appeal as of October 2026, with linked cases listed for a Supreme Court hearing. When North Warwickshire Borough Council sought permission to appeal, the tunnel extension was largely complete and the council had taken no enforcement action. For HS2's delivery body, substantial physical completion did not resolve the revised design's consent basis, so legal exposure extended beyond early project authorization.
*Our forecasts treat driver/restraint impacts as directional, not additive. The impact forecasts reflect baseline growth, mix effects, and variable interactions.
Infrastructure Construction Market Segment Analysis
By Infrastructure Segment:
Transport Scale and Multiyear Utility BuildsTransportation infrastructure accounted for a 37.29% share of the infrastructure construction market size in 2026. US public highway and street construction spending totaled USD 141.9 billion in 2025, compared with USD 143.2 billion in 2024. That substantial annual workload supports the largest segment's scale even when a major construction category is broadly steady. For public highway buyers, the commercial task includes delivering construction programs across successive annual cycles, giving execution capacity value beyond new project announcements. With annual road spending broadly steady, contractors seeking more work must capture a larger part of existing programs rather than rely on a rising spending total.
Utilities infrastructure is the fastest-growing segment, with a forecast CAGR of 6.62% over 2027-2032. In August 2025, India's Cabinet Committee on Economic Affairs approved investment in Arunachal Pradesh's 700 MW Tato-II hydroelectric project, with an estimated 72-month completion period. A joint venture of North Eastern Electric Power Corporation Ltd. and the Arunachal Pradesh government was to implement the project. Because the approval includes Indian government budgetary support for roads, bridges and an associated transmission line, the planned scope covers site access and grid connection as well as the 700 MW plant.

By Construction Type:
New Routes and Adaptive Asset ReuseNew construction represented a 73% infrastructure construction market share in 2026. Viet Nam targets a December 2027 construction start for its North-South high-speed railway, with total investment capital of USD 67.34 billion. The planned route extends approximately 1,541 kilometers from Ngoc Hoi station in Ha Noi to Thu Thiem station in Ho Chi Minh City. For the largest segment, a project of that geographic scale creates scope for linked construction packages, with the owner needing a complete connection across the alignment. With construction targeted to start in December 2027, the USD 67.34 billion program gives contractors a forward pipeline around which to time preparation for later bidding.
Renovation is the fastest-growing segment, with a forecast CAGR of 6.75% over 2027-2032. Bangladesh Bridge Authority signed a contract on May 13, 2026, with a China Communications Construction Company Ltd and China Road and Bridge Corporation joint venture. The contract covered renovating, widening and strengthening the Jamuna Bridge deck in Tangail to use its abandoned rail lane. That scope shows how renovation can expand an existing asset's usefulness by changing how part of its structure is used. For owners, the construction decision combines capacity adaptation with structural strengthening, creating work for contractors able to integrate a new function into an existing bridge.
By Investment Source:
Public Delivery and Shared Project FinancingPublic investment was the largest segment, accounting for a 60.84% share of the infrastructure construction market in 2026. US public highway and street construction spending was USD 150.6 billion at a seasonally adjusted annual rate in August 2026. This substantial publicly financed workload illustrates how government owners support demand for physical construction through their road programs, giving public budgets a direct role in the scale of work available to contractors. Contractors in this segment win work through public owners' award processes, which ties their order books to government program timing.
Private investment is the fastest-growing segment, with a forecast CAGR of 6.95% over 2027-2032. The UK government confirmed La Caisse, Centrica, EDF and Amber Infrastructure as equity participants alongside its own public stake in Sizewell C in July 2025. Financial close on November 4, 2025, locked in the construction project's financing structure, risk-sharing arrangements and delivery model. The arrangement illustrates how private investment can participate in a capital-intensive utility build through a shared funding structure. With the financing structure settled, contractors face a defined risk-sharing and delivery model against which to assess their construction commitments.
Geography Analysis
Asia-Pacific Infrastructure Construction Market
Asia-Pacific accounted for a 46.14% share of the infrastructure construction market size in 2026. China State Railway Group reported CNY 248.5 billion (about USD 36.5 billion) in railway fixed-asset investment during January-May 2026. India's FY2026-27 proposal included INR 12.2 trillion (USD 134.5 billion) in public capital expenditure and an infrastructure focus on Tier II and Tier III cities with over 500,000 people. For contractors, these programs call for separate railway and urban delivery capabilities, so a broad regional presence alone does not match the different work each owner funds.
Middle East and Africa Infrastructure Construction Market
The Middle East and Africa is the fastest-growing geography, with a forecast CAGR of 7.1% over 2027-2032. The World Bank approved USD 900 million for Iraq's transport corridors in June 2026, covering planned road rehabilitation, upgrades and construction. In Madagascar, the Abu Dhabi Fund for Development reported in May 2026 that a 117-kilometer dual-lane road and 7 bridges it oversaw were 80% complete. This mix favors a staged approach to entry, with contractors matching mobilization to newly approved programs and completion capability to road works already well advanced.
North America includes Mexico's September 2025 award to a consortium of Grupo Carso subsidiary Operadora CICSA and FCC Construcción for the 111-kilometer Saltillo-Santa Catarina passenger-rail segment, with equal consortium stakes. In Europe, the joint venture of Bechtel Corp. and ENKA opened Serbian Morava Corridor sections in July 2026, bringing more than 100 of 112 kilometers into service, with one section remaining. In South America, Brazil's private companies supplied most transport and logistics infrastructure investment through concessions and public-private partnerships in 2025. The examples distinguish public procurement, a partial corridor opening and a concession-based investment channel within their respective countries. A contract award in Mexico, a partial corridor opening in Serbia and concession financing in Brazil sit at different points of the project cycle, so contractors face different routes to participation in each country.
Mordor Intelligence provides coverage of the infrastructure construction market across other key regional markets, including Middle East and Africa, each with their regulatory frameworks and demand patterns. Detailed country-level analysis extends to Saudi Arabia, China, Brazil, and Canada incorporating local coverage and market participation, as required.
Regulatory Framework and Outlook
This comparison covers selected jurisdictions from the perspective of contractors delivering transport and related civil infrastructure. The United States and Germany columns focus on federal transport or railway procedures, while China's column addresses environmental assessment for qualifying construction projects. Brazil's framework distinguishes qualifying maintenance and improvement works from projects subject to prior environmental licensing. A contractor needs to classify each project before committing to a construction sequence because its scope determines which licensing, exemption or assessment duties apply.
Regulatory Table of Infrastructure Construction Market
| Decision factor | United States | Brazil | Germany | China | Saudi Arabia |
|---|---|---|---|---|---|
| Primary authority | Federal Highway Administration, Federal Railroad Administration and Federal Transit Administration | Competent federal, state, Federal District and municipal environmental authorities | Federal Railway Authority for federal railway operating facilities | Ministry of Ecology and Environment for classification; competent environmental-review authorities | National Center for Environmental Compliance (NCEC) |
| Key instruments or direction | National Environmental Policy Act procedures finalized September 1, 2026 | Law No. 15,190, in force February 4, 2026, including a scoped maintenance exemption | Infrastructure Future Act, mostly effective July 29, 2026; nature-law amendment scheduled February 1, 2027 | Ecological Environment Code effective August 15, 2026; December 2025 draft assessment-classification revision | Environmental Permitting Regulation and Category I construction-permit service |
| Commercial effect | Clearance before final design, construction-material purchases or construction for covered actions, with legal and regulatory exceptions | Prior licensing for resource-using or potentially polluting projects; qualifying maintenance or improvement at existing facilities or within rights-of-way is exempt; other applicable permits remain required | Framework aims at shorter planning and approval procedures for important transport projects | Assessment before construction for projects affecting the environment; December 2025 draft proposed full reports for railway modifications with new permanent land occupation in sensitive areas or significant increases in train speed or frequency | Low-impact Category I applicants need a plan from an NCEC-licensed provider and pay fees; NCEC may request additional requirements |
| Current policy attractiveness | Medium | Medium | High | Medium | Medium |
| Future direction of policy attractiveness | No change | No change | Easing | Hardening | No change |
| Source: Mordor Intelligence | |||||
The US agencies finalized their 2025 interim NEPA rule with minor technical changes effective September 1, 2026, so clearance duties for covered transportation actions carry forward, while Saudi Category I applicants must submit environmental management plans from NCEC-licensed providers, pay applicable fees and meet additional requirements if requested, supporting Medium and No change for both jurisdictions. Brazil's Medium rating and No change direction reflect its operative licensing framework, which exempts qualifying maintenance while preserving other applicable permits. Germany's High rating reflects the Infrastructure Future Act, which mostly took effect on July 29, 2026, and shortens planning and approval procedures for important new transport projects, and its Easing direction rests on that streamlining, while the Federal Nature Conservation Act amendment is scheduled for February 1, 2027 and conservation standards remain relevant. China's Medium rating reflects pre-construction assessment, while its Hardening direction reflects the December 2025 draft's proposed full reports for the specified railway modifications, if adopted.
Value Chain Stages
The value chain compares how engineering, procurement, materials supply and construction capture revenue while managing different delivery interfaces. Bechtel Corp. provides engineering, procurement and construction (EPC), along with project-management services, within its project-delivery business. Holcim supplies low-carbon cement, circular aggregates, ready-mix concrete and surfacing, placing physical material production alongside these delivery services.
Value Chain Analysis Table of Infrastructure Construction Market
| Primary activity | Key participants | Value capture | Bottleneck | Resilience response |
|---|---|---|---|---|
| Engineering and design | Engineering service providers such as Bechtel Corp. | Engineering and design service fees | Alignment between design decisions and construction requirements | Review construction interfaces before releasing designs |
| Procurement and delivery coordination | Project procurement contractors such as Bechtel Corp. | Procurement-management service fees | Sequencing purchases and deliveries across project requirements | Coordinate supplier schedules with construction milestones |
| Materials production and supply | Building-material producers such as Holcim | Low-carbon cement, circular aggregates, concrete and surfacing sales | Matching material specifications to the planned work | Align product specifications and delivery batches with the design |
| Construction and project management | EPC contractors such as Bechtel Corp. | Construction-contract revenue and project-management fees | Coordination of logistics, local requirements and workforce needs | Integrate logistics and workforce planning with site execution |
| Source: Mordor Intelligence | ||||
Integration can capture value by resolving interfaces that individual material sales leave with the project owner. Engineering and procurement services create an opportunity to manage those interfaces before construction, while material producers earn from the products supplied. If owners consolidate delivery responsibility, the additional service opportunity lies in coordinating the full build, extending the contractor's role across stages without requiring ownership of materials production.
Competitive Landscape
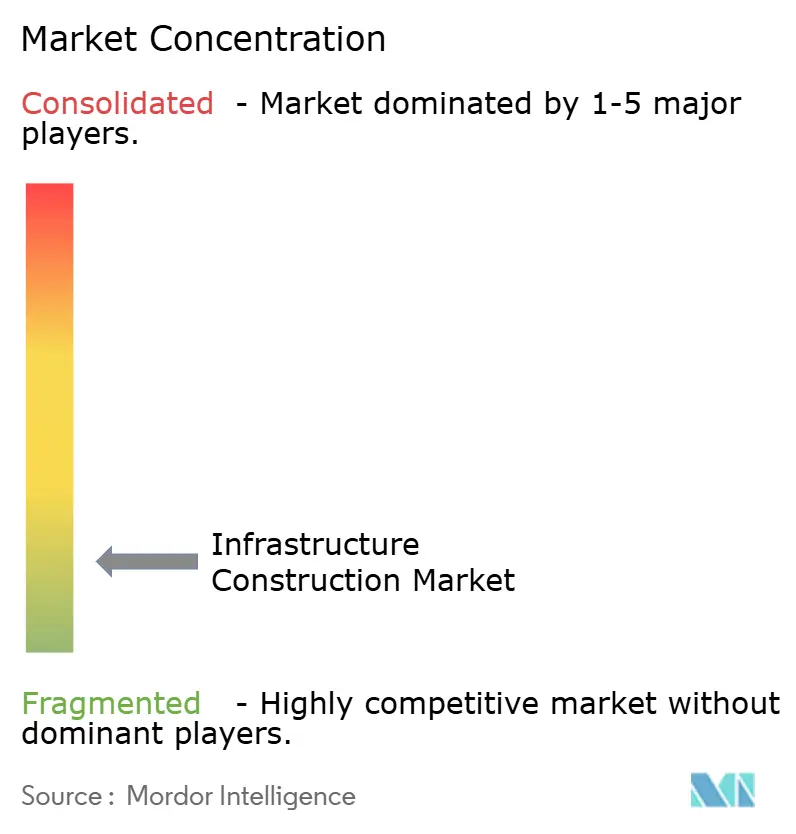
Leadership is shared among several large construction and engineering groups, including China State Construction Engineering Corp., China Railway Group Ltd, China Railway Construction Corp., VINCI SA and ACS Group. In 2025, China State Construction's infrastructure construction and investment new contract value grew 4.1%, while China Railway Group's company-wide newly signed contract value rose 1.3%. In July 2025, China Railway Construction Corp. subsidiaries reported winning pre-construction bids for 3 sections of the China-Kyrgyzstan-Uzbekistan Railway in Kyrgyzstan. The awards concerned general contracting for specified sections, excluding the advance construction section, with subsidiaries and a subsidiary consortium as the winning entities. For railway buyers, the subsidiary or consortium holding a section contract is the entity against which package delivery should be assessed.
VINCI Construction, a VINCI SA business, reported in the first half of 2025 work to replace more than 800 kilometers of railway and ballast across France through 2030. The program's length and duration make it a commercial example of competing for renewal work spread across an existing transport network. Renewal through 2030 makes the ability to redeploy crews and equipment between successive sections a competitive asset beyond winning the initial work.
ACS Group reported 26.9% foreign-exchange-adjusted growth in company-wide new orders in FY2025. VINCI says its companies must comply with country- and sector-specific contract, construction and technical rules wherever they provide services. For owners comparing large groups, growth in orders demonstrates commercial activity, while suitability for a particular construction package depends on meeting the rules applicable to that work. A VINCI bidder consequently needs to translate its wider construction capabilities into a contract and technical approach for the specific jurisdiction and sector, since group scale alone does not satisfy those obligations.
Infrastructure Construction Industry Leaders
-
China State Construction Engineering Corp.
-
China Railway Group Ltd
-
China Railway Construction Corp.
-
VINCI SA
-
ACS Group
- *Disclaimer: Major Players sorted in no particular order
Infrastructure Construction Market Companies Covered in this Report
- China State Construction Engineering Corp.
- China Railway Group Ltd
- China Railway Construction Corp.
- VINCI SA
- ACS Group
- Bechtel Corp.
- Larsen & Toubro
- Skanska AB
- Hochtief AG
- Bouygues Group
- Balfour Beatty
- Fluor Corp.
- Ferrovial SE
- Samsung C&T
- Kajima Corp.
- Webuild (Salini Impregilo)
- Obayashi Corp.
- GS Engineering & Construction
- PCL Construction
- AtkinsRéalis Group
Key Opportunities for Market Participants
The opportunities compare distinct construction needs within a planned railway program and a specified electricity-transmission tender. Bangladesh Railway's July 2026 procurement plan expected civil works, track materials, signaling and telecommunications, with financing from the Asian Infrastructure Investment Bank described as proposed. Its civil scope incorporated climate-resilient design measures for railway structures and drainage. In Sri Lanka, an August 2026 tender sought eligible physical bids for Lot A, an approximately 77-kilometer, 220 kV line, due October 22, 2026, with late submissions rejected.
Market Opportunities Table of Infrastructure Construction Market
| Opportunity | Why now | Buyer / lead segment | Recommended play | Main barrier | Likely beneficiaries |
|---|---|---|---|---|---|
| Climate-resilient rail civil works | July 2026 plan for expected railway, bridge and drainage procurement | Bangladesh Railway / transportation infrastructure | Combine rail civil works with resilient structures and drainage | Proposed financing and packaging of expected works | Rail civil contractors such as Larsen & Toubro |
| Railway systems integration | Planned track, signaling and telecommunications procurement | Bangladesh Railway / transportation infrastructure | Coordinate systems delivery with civil construction | Interfaces among track, signaling and telecommunications | Rail systems integrators such as Larsen & Toubro |
| Integrated transmission-line delivery | August 2026 tender with an October 22, 2026 bid deadline | National Transmission Network Service Provider Private Limited / utilities infrastructure | Offer design-through-commissioning line delivery | Integration with existing substations across the contract scope | Transmission EPC businesses such as Larsen & Toubro's Power Transmission & Distribution business |
| Source: Mordor Intelligence | |||||
The central opening is the integration of civil and technical work into infrastructure that an owner can commission. The railway program supports preparation of coordinated delivery packages, while the transmission tender calls for a bid against a defined construction scope. A transmission offer must price responsibility through commissioning, while railway package preparation should remain proportionate to financing that was only proposed.
Recent Industry Developments in Infrastructure Construction Market
- Sep 2026: The Bechtel-Westinghouse consortium and Polskie Elektrownie Jądrowe (PEJ), the Polish nuclear project company, agreed on main commercial terms for the engineering, procurement and construction (EPC) contract for Poland's first nuclear power plant, with contract negotiations to continue.
- Jul 2026: Bechtel Corp. and joint venture partner ENKA opened Sections 8 and 9 of Serbia's Morava Corridor Motorway, bringing more than 100 of its 112 kilometers into service.
- Feb 2026: Larsen & Toubro's Heavy Civil Infrastructure and Heavy Engineering businesses jointly won a Department of Atomic Energy order for the LIGO India Observatory in Maharashtra. The scope included high-precision civil works, manufacture and installation of an 8-kilometer beam tube, vacuum equipment and support-system integration, with a 48-month completion deadline.
Infrastructure Construction Market Report Scope and Research Methodology
Market Definition and Coverage
The Global infrastructure construction market measures annual spending on new construction and renovation work for infrastructure assets and systems. It covers projects funded publicly or privately across every country.
Scope exclusions: Routine infrastructure operation and maintenance services, standalone sales of construction materials and equipment, and operating revenue from completed infrastructure are excluded.
Segments Covered in This Report
- By Infrastructure Segment
- Transportation Infrastructure
- Utilities Infrastructure
- Social Infrastructure
- Extraction Infrastructure
- By Construction Type
- New Construction
- Renovation
- By Investment Source
- Public
- Private
- By Geography
- North America
- United States
- Canada
- Mexico
- South America
- Brazil
- Argentina
- Rest of South America
- Europe
- United Kingdom
- Germany
- France
- Italy
- Spain
- Rest of Europe
- Middle East and Africa
- Saudi Arabia
- United Arab Emirates
- Rest of Middle East and Africa
- Asia-Pacific
- China
- India
- Japan
- South Korea
- Australia
- Indonesia
- Rest of Asia-Pacific
- North America
Data Sources, Market Sizing, and Validation
Desk Research
Public sources such as the American Water Works Association's drinking-water needs assessment provide asset renewal and cost context, while the International Renewable Energy Agency's capacity statistics track global generation additions that can inform power construction demand. The World Bank's Private Participation in Infrastructure database records project investment across energy, telecommunications, transport, and water in low- and middle-income countries, and OECD public investment data provide a cross-check on government capital spending in member countries.
Company annual filings, 10-Ks, investor presentations, contract awards, budget documents, and reputable press coverage add evidence on contractor revenue, project timing, funding, and delivery costs. These sources are not exhaustive, and further sources inform collection, validation, and clarification.
Primary Interviews and Surveys
Interviews and structured surveys would target executives and functional leaders at infrastructure contractors, public and private asset owners, utilities, and project developers across APAC, EMEA, and the Americas. Respondents would check the interpretation of secondary evidence, the timing and value of project spending, and assumptions about funding, construction stages, and cost changes. Where accounts and published records differ or a material input lacks coverage, analysts would request clarification and triangulate it against contract, budget, and company disclosures before revising an estimate.
Distribution of primary research fieldwork respondents
| Company type | Respondent position | Region |
|---|---|---|
| Top tier: 30% | CXOs: 15% | APAC: 45% |
| Mid tier: 55% | Functional/Unit leaders: 35% | EMEA: 30% |
| Smaller Players: 15% | Managers: 50% | Americas: 25% |
Market-Sizing & Forecasting
The model starts top-down with annual global construction spending for infrastructure, then checks the total against regional budgets and project-level evidence. Government and private project allocations, contract awards and starts, work completed during the year, and construction cost indices indicate the size and timing of contractor-delivered work, while investment-source disclosures distinguish public funding from private capital. Project descriptions, budget allocations, and contract records show how spending is distributed across transportation, utilities, social, and extraction assets and between new construction and renovation, with each project counted once at the construction contract value for work performed. Where project-level values are available, sampled contract-value roll-ups checked against construction milestones provide a selective test of the top-down total and its comparison with published regional spending, and missing project values are bounded with comparable contract awards and disclosed budgets before reconciliation to the top-down total.
Scenario analysis carries the forecast forward using funded project pipelines, expected starts and completions, public and private capital plans, construction costs, and documented approval or delivery delays. Analysts would vary the timing of projects and funding conditions to show how these inputs change annual spending, while expert interviews would check variable-level assumptions and flag milestones or cost movements that public records have not captured.
Data Validation & Update Cycle
Analysts triangulate project spending against government budgets, contract awards, contractor disclosures, infrastructure investment series, and independent construction cost signals. They investigate outliers and year-to-year variances, resolve differences against source definitions and project timing, and complete source review, calculation review, and senior analyst review before sign-off. When an award, funding decision, schedule, scope, or cost assumption changes materially, analysts recheck source records and recontact respondents where the change affects a core input, while refreshing the model annually, updating it between cycles for material events, and checking it again in a fresh pre-delivery pass.
Mordor Intelligence's Infrastructure Construction Market Size Measured Against Other Published Estimates
Published estimates can differ in the transactions and products they count and the inputs used to model demand. The Global infrastructure construction market measures annual spending on new construction and renovation work for infrastructure assets and systems.
Key Gap Drivers include the study's defined coverage and market-specific modeling choices. Analysts would vary the timing of projects and funding conditions to show how these inputs change annual spending, while expert interviews would check variable-level assumptions and flag milestones or cost movements that public records have not captured.
Benchmark comparison
| Source | Market Size | Gaps in Research Methodology |
|---|---|---|
| Mordor Intelligence | USD 4.31 T (2027) | |
| Global Research Publisher A | USD 3.7 T (2026) | At its 2026 base, this estimate is 14.2% below this report's 2027 value of USD 4.31 T, 1 year later. Its 2026 estimate precedes the report's 2027 measurement, and its published outlook rises through 2030. |
| Global Research Publisher B | USD 1.92 T (2026) | At its 2026 base, this estimate is 55.5% below this report's 2027 value of USD 4.31 T, 1 year later. Its 2026 estimate precedes the report's 2027 measurement, and its published outlook rises through 2032. |
Mordor Intelligence's analysts triangulate project spending against government budgets, contract awards, contractor disclosures, infrastructure investment series, and independent construction cost signals.
Key Questions Answered in the Report
What is the infrastructure construction market size and growth outlook?
The size is expected to reach USD 4.31 trillion in 2027 and USD 5.76 trillion by 2032, with a 5.96% CAGR over 2027-2032.
What is driving demand for infrastructure construction?
Renewal needs, renewable power builds and public funding support demand. Renewable power capacity additions reached 692 GW worldwide in 2025.
Which infrastructure segment has the largest construction share?
Transportation infrastructure held the largest share at 37.29% in 2026. Utilities infrastructure is forecast to grow fastest at a 6.62% CAGR over 2027-2032.
Which companies are major infrastructure contractors?
Major participants include China State Construction Engineering Corp., China Railway Group Ltd, China Railway Construction Corp., VINCI SA and ACS Group.
What is the main challenge for infrastructure construction delivery?
Limited financing commitments constrain delivery. International project finance, mainly focused on infrastructure, fell 16% in value in 2025 compared with 2024.
Which region leads global infrastructure construction?
Asia-Pacific held the largest share at 46.14% in 2026. The Middle East and Africa is forecast to grow fastest at a 7.1% CAGR over 2027-2032.