Market Overview
| Study Period | 2020 - 2031 |
|---|---|
| Forecast Data Period | 2026 - 2031 |
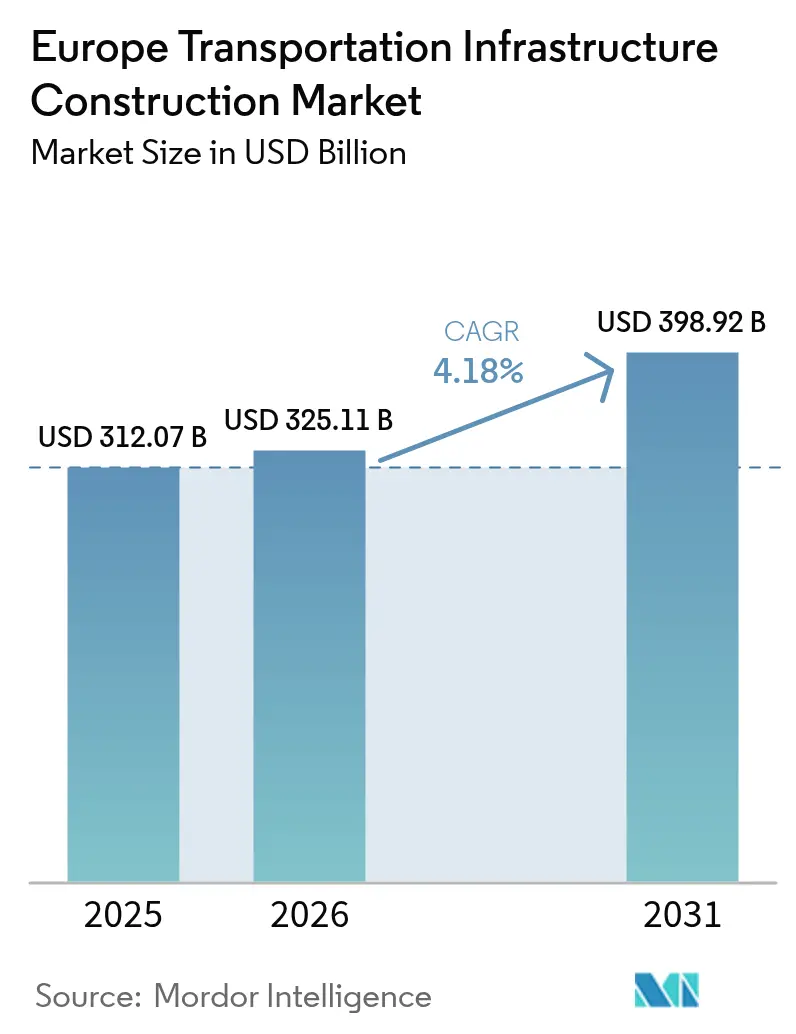
| Base Year Market Size (2025) | USD 312.07 Billion |
| Market Size (2026) | USD 325.11 Billion |
| Market Size (2031) | USD 398.92 Billion |
| Growth Rate (2026 - 2031) | 4.18% CAGR |
| Market Concentration | Low |
Major Players *Disclaimer: Major Players sorted in no particular order Image © Mordor Intelligence. Reuse requires attribution under CC BY 4.0. | |
Europe Transportation Infrastructure Construction Market Analysis by Mordor Intelligence
The Europe Transportation Infrastructure Construction Market size is expected to grow from USD 312.07 billion in 2025 to USD 325.11 billion in 2026 and is forecast to reach USD 398.92 billion by 2031 at 4.18% CAGR over 2026-2031.
Growth is grounded in the European Commission’s legally binding 2030 core TEN-T deadline that pushes member states to upgrade rail, road, bridge, and tunnel links on nine principal corridors, while simultaneous asset-rehabilitation mandates channel more than half of annual outlays into replacing structures built during the 1970s and 1980s. Public agencies remain anchor clients because the Connecting Europe Facility covers up to 50% of eligible costs on cross-border projects that private sponsors still deem risky, yet private capital is expanding steadily on availability-payment concessions for metro extensions and toll roads with predictable cash flows. Contractors with digital twin and BIM capabilities are achieving faster approvals and lower rework rates, positioning themselves for higher-margin bids as procurement rules now require supply-chain carbon-intensity disclosure on contracts above USD 54 million. Environmental permitting delays, labor shortages exceeding 8% for tunnel and bridge specialists in Germany and the Netherlands, and 22% swings in 2025 steel futures continue to temper the headline expansion, framing Europe’s current cycle as an execution-driven maintenance phase rather than a capacity boom.
Key Report Takeaways
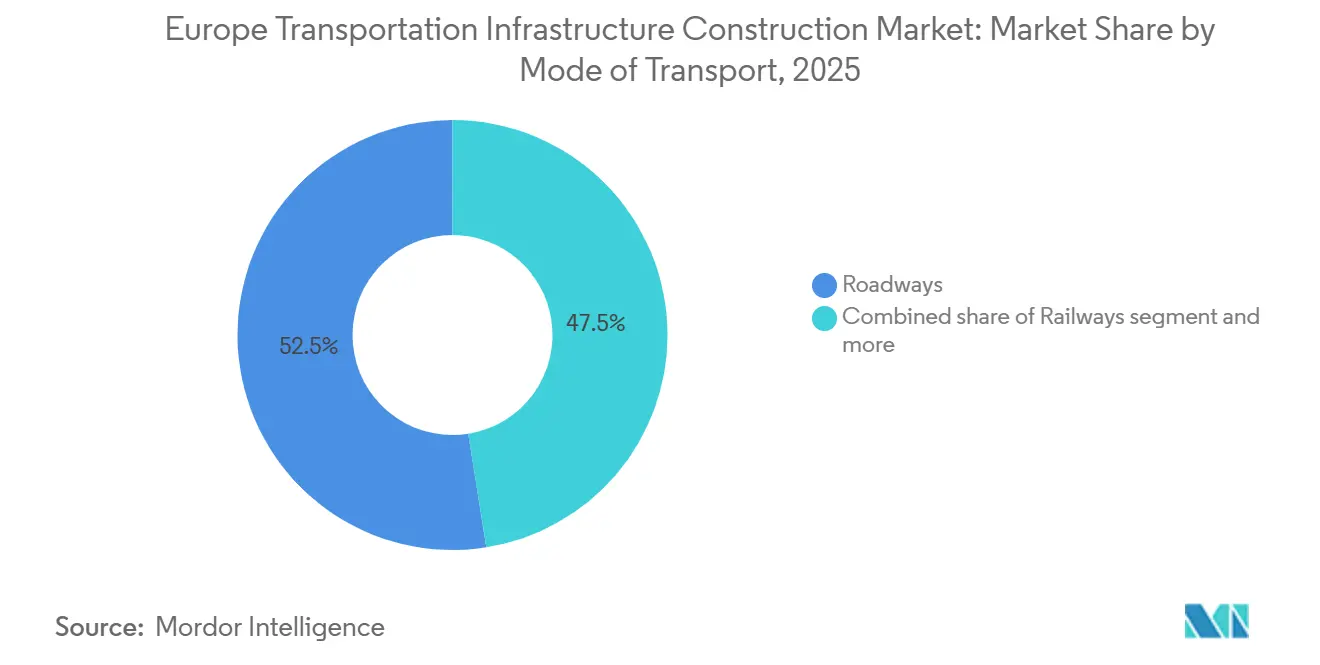
- By type, roadways led with a 52.5% share of the Europe transportation infrastructure construction market in 2025, while railways are projected to grow at a 4.91% CAGR through 2031.
- By construction type, renovation accounted for 53.1% of the Europe transportation infrastructure construction market in 2025, whereas new construction is advancing at a 4.78% CAGR to 2031.
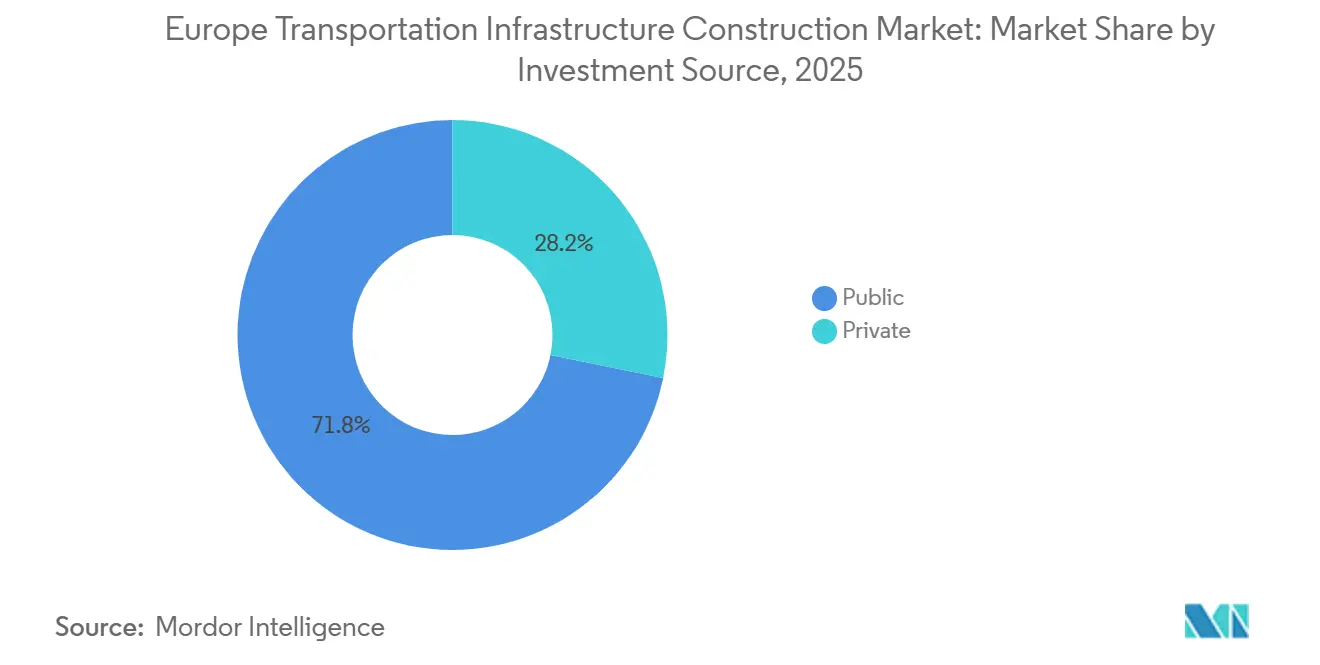
- By investment source, public funding captured 71.8% of the Europe transportation infrastructure construction market in 2025, even as private capital posts the fastest 4.82% CAGR through 2031.
- By geography, Germany held 25.8% of the Europe transportation infrastructure construction market in 2025, while Spain recorded the fastest 5.11% CAGR during 2026-2031.
Note: Market size and forecast figures in this report are generated using Mordor Intelligence’s proprietary estimation framework, updated with the latest available data and insights as of 2026.
Europe Transportation Infrastructure Construction Market Trends and Insights
Drivers Impact Analysis*
| Driver | (~) % IMPACT ON CAGR FORECAST | Geographic Relevance | Impact Timeline |
|---|---|---|---|
| EU TEN-T corridor upgrades are driving sustained rail, road, bridge, and tunnel project pipelines | +1.2% | Germany, France, Italy, Spain, Poland | Long term (≥ 4 years) |
| Aging transport assets are driving rehabilitation, safety upgrades, and replacement works | +1.0% | United Kingdom, Germany, France | Long term (≥ 4 years) |
| Connecting Europe Facility and national budgets supporting cross-border transport capex | +0.9% | Pan-European (Central & Eastern Europe focus) | Medium term (2–4 years) |
| Logistics and freight resilience priorities are accelerating port, intermodal, and rail capacity projects | +0.8% | Netherlands, Belgium, Germany, Spain | Medium term (2–4 years) |
| Urban mobility programs expanding metro, tram, and station modernization and construction | +0.7% | France, Germany, Spain | Short term (≤ 2 years) |
| Source: Mordor Intelligence | |||


EU TEN-T Corridor Upgrades Driving Sustained Rail, Road, Bridge, and Tunnel Project Pipelines
Binding 2030 core-network deadlines convert previously aspirational targets into enforceable obligations, channeling more than USD 130 billion toward nine corridors that together span 30,000 kilometers. Cross-border tunnel and bridge contracts, such as the 11-mile Fehmarn Belt link, are eliminating gauge and standard mismatches, trimming freight transit by two hours between Scandinavia and Central Europe. Multinational joint ventures have become the norm because they navigate divergent procurement statutes and environmental benchmarks more efficiently than smaller regional players. The credible threat of withholding cohesion funds keeps member states aligned with milestones, reinforcing pipeline visibility for contractors. As a result, rail electrification firms that also manage complex marine civil works sit at the center of forthcoming mega-tender shortlists.
Aging Transport Assets Driving Rehabilitation, Safety Upgrades, and Replacement Works
Almost 40% of highway bridges and 35% of rail viaducts predate 1980 and have reached the end of their 50-year design lives without full-cycle maintenance. Germany earmarks USD 16 billion through 2030 to address 4,000 structurally weak road bridges, and the United Kingdom launched a USD 4.4 billion emergency rail viaduct program in 2025. Rehabilitation under live traffic favors contractors holding night-work safety certifications and heavy-lift cranes needed for 48-hour modular deck swaps. Off-site fabrication widens margins for innovators because client agencies now pay premiums to minimize economic disruption. While renovation contracts can be price-squeezed, specialized firms still capture above-average returns when they pair construction with data-driven asset monitoring that anchors long-term performance fees.
Connecting Europe Facility and National Budgets Supporting Cross-Border Transport Capex
The USD 36.8 billion 2021-2027 Connecting Europe Facility transport envelope cushions up to half of eligible costs, enabling sponsors to pursue projects such as mountainous rail electrifications or port hinterland upgrades whose standalone IRRs fall short of investor hurdles[1]Connecting Europe Facility, “Transport Funding 2021-2027,” ec.europa.eu . Germany’s parallel USD 93 billion rail renewal program adds domestic certainty, while France’s 2025 decision to float green bonds for a USD 110 billion portfolio shows national treasuries pivoting toward EU priorities. Contractors adept at assembling blended-finance stacks of grants, debt, and equity are securing outsized wins because they de-risk capital structures for governments eager to crowd in private partners. With national and EU budgets now converging rather than competing, the historic problem of funding gaps that stalled earlier corridor phases is fading.
Logistics and Freight Resilience Priorities: Accelerating Port, Intermodal, and Rail Capacity Projects
Supply-chain disruptions that lengthened container dwell times by up to ten days in 2021-2022 spurred governments to diversify away from a handful of mega-ports. Funding now targets intermodal terminals and secondary gateways such as Valencia, Gdansk, and Piraeus, each tying expansion to inland rail spurs that pull cargo off congested highways. The Port of Rotterdam’s USD 1.3 billion automated terminal expansion, scheduled for 2028, will boost capacity by 3 million TEUs, while Spain is converting 840 miles of broad-gauge track to standard gauge to create a continuous freight spine from Algeciras to the French border. Integrated dredging-plus-rail packages suit contractors that bridge marine civil works and rail electrification, leaving single-discipline firms vulnerable to scope bundling.
Restraints Impact Analysis*
| Restraints | (~) % IMPACT ON CAGR FORECAST | Geographic Relevance | Impact Timeline |
|---|---|---|---|
| Permitting and environmental approvals extending pre-construction timelines | -0.6% | Germany, the Netherlands, and France | Medium term (2–4 years) |
| Skilled labor shortages and contractor capacity constraints are inflating schedules and costs | -0.5% | Germany, Netherlands, United Kingdom, Nordics | Short term (≤ 2 years) |
| Materials and energy price volatility is raising EPC risk and bid prices | -0.4% | Pan-European (steel- and cement-intensive markets) | Short term (≤ 2 years) |
| Source: Mordor Intelligence | |||
Permitting and Environmental Approvals Extending Pre-Construction Timelines
Stringent habitat assessments triggered by the EU Habitats Directive mean cross-border projects often lose three to five years before mobilization. The Lyon-Turin base tunnel spent eight years in paperwork, and 12 autobahn widenings are on hold after Germany’s top court insisted on proof of overriding public interest[2]Bundesverwaltungsgericht, “Judgment on Autobahn Environmental Review,” bundesverwaltungsgericht.de . Contractors shoulder standby costs, eroding IRRs, and hardening bid premiums. Some states now trial fast-track laws that let ministers override local objections, yet early court challenges suggest limited near-term relief. Consequently, greenfield mega-projects carry higher contingency allowances, while maintenance on existing alignments benefits from accelerated clearances.
Skilled Labor Shortages and Contractor Capacity Constraints Inflating Schedules and Costs
Median construction-worker age exceeds 45, and vocational enrollments fell 18% between 2015 and 2025, leaving 90,000 vacancies in Germany alone.[3]Zentralverband Deutsches Baugewerbe, “Skilled Labor Market Survey 2025,” zdb.de Wages for specialized trades jumped 12% in 2025, forcing public owners to raise cost ceilings or postpone tenders. Contractors import posted workers from Poland and Romania, but language and safety training gaps inflate rework and accident incidences. Mechanization—robotic rebar tying and automated paving—offers relief yet relies on OEM service hubs that remain sparse in mountainous or rural corridors. Labor tightness will linger through 2028 because apprenticeships require at least three years to yield certified tunnel and bridge specialists.
*Our forecasts treat driver/restraint impacts as directional, not additive. The impact forecasts reflect baseline growth, mix effects, and variable interactions.
Segment Analysis
By Type: Roadways Dominate, but Railways Accelerate
Roadways captured 52.5% of the Europe transportation infrastructure construction market share in 2025, reflecting decades of interstate and autobahn build-outs that still demand resurfacing and bridge replacements. Railways, however, deliver the fastest 4.91% CAGR through 2031 as the EU directs funds toward electrifying 75% of the core TEN-T network and de-dieselizing main lines by 2050. Within the Europe transportation infrastructure construction industry, Germany has committed USD 20 billion to electrify 1,800 kilometers of track, and France is targeting 2,400 kilometers, prioritizing routes that feed Atlantic and Mediterranean ports. Contractors with overhead-catenary capabilities and ETCS integration expertise benefit from premium margins since fewer bidders can offer end-to-end power, signaling, and civil packages. Road-focused firms find margins thinner because resurfacing frameworks reward scale and cost discipline rather than innovation.
Road demand is increasingly rehabilitation-driven: 4,000 German bridges need urgent intervention, and Austria’s ASFINAG awarded STRABAG a USD 820 million modular bridge and pavement upgrade that recycles 60% asphalt content, reducing embodied carbon by 22%. Ports and inland waterways contribute selectively; Antwerp-Bruges is spending USD 1.6 billion to deepen channels for 24,000-TEU ships, but the absolute capex remains small compared with highway and rail expenditure. Airports lag, hampered by flight-movement caps at hubs like Amsterdam Schiphol and still-pending litigation against Heathrow’s third runway. Collectively, these trends imply that the Europe transportation infrastructure construction market size allocation tilts toward projects that decarbonize freight and support modal shift rather than greenfield highway capacity.


By Construction Type: Renovation Commands a Majority Share
Renovation absorbed 53.1% of spending in 2025, highlighting the aging profile of Europe’s bridges, tunnels, and tracks that were largely built four to five decades ago. New construction posts a 4.78% CAGR yet starts from a smaller base dominated by cross-border tunnels such as the USD 8.9 billion Fehmarn Belt and urban metros like Warsaw Line 3. The Europe transportation infrastructure construction market size for renovation grows steadily because deferred maintenance during 2010-2020 austerity now collides with stricter safety codes that call for fire-suppression systems in every rail tunnel longer than one kilometer by 2028. National audit offices, notably Germany’s Bundesrechnungshof, flag bridge backlogs as fiscal liabilities, pressing ministries to front-load dollars before closures trigger supply-chain disruption.
Framework contracts covering inspections, pavement overlays, and drainage upgrades allow regional specialists to secure multi-year visibility, but margins compress as clients negotiate aggressively. Conversely, concession-style greenfield projects let multinational majors spread design innovation and cost savings across 20-30-year availability payments, protecting returns. VINCI’s 2024 Spain concession blends construction with 30 years of electrification maintenance, illustrating how integrated finance-plus-delivery outperforms unit-price renovation contracts. As more agencies adopt performance-based maintenance, contractors that combine data-rich monitoring with prefabricated modular solutions will edge ahead on both price and quality.
By Investment Source: Public Budgets Anchor, Private Capital Scales Selectively
Public funding provided 71.8% of outlays in 2025 and remains indispensable for non-revenue assets such as bridge safety upgrades. Private investment, however, is the fastest riser at a 4.82% CAGR through 2031 as agencies tap availability-payment PPPs that have now cleared state-aid hurdles under 2024 EU guidance. The Europe transportation infrastructure construction market share for PPP-financed assets is modest today, but headline transactions—including the USD 2.3 billion Polish A1 motorway and VINCI’s USD 2 billion Spanish electrification concession—signal investor appetite where revenue risk can be modeled. Banks and pension funds prize metrics such as average daily traffic or track-access fees that correlate tightly with GDP growth, enabling long-tenor debt at sub-200 basis-point spreads over swaps.
Traditional budget-funded rehabilitation attracts fierce price competition, squeezing margins and sometimes forcing tender cancellations when bids exceed cost ceilings. By contrast, PPP deals allow contractors to embed whole-life-cost efficiencies—modular bridges, predictive maintenance sensors—that lift IRRs without raising headline capex. The bifurcated funding landscape, therefore, drives strategic specialization: pure builders remain in price-driven public tenders, while balance-sheet-strong majors accumulate concessions that bundle construction with multi-decade O&M revenue.
Geography Analysis
Germany delivered 25.8% of Europe transportation infrastructure construction market activity in 2025, reflecting a fiscal model that earmarks fuel-tax inflows for multiyear plans, thus protecting capex from budget swings. Deutsche Bahn is channeling 68% of a USD 93 billion envelope into track renewals, bridge replacements, and ETCS signaling, confirming the national pivot toward asset stewardship over greenfield builds. The 11-mile Fehmarn Belt immersed tunnel to Denmark, slated for 2029, exemplifies selective capacity projects that unlock trans-Scandinavian freight savings of two hours per trip. Germany’s 90,000 skilled-labor shortfall is the most acute in Europe, prompting heavy mechanization investments such as automated paving trains and robotic rebar tying that temper schedule risk.
France, Spain, and Italy take divergent but complementary routes. France’s USD 110 billion modernization drive focuses on full electrification of Atlantic and Mediterranean corridors to shift 25% of freight off roads by 2030, and the Grand Paris Express adds 124 miles of driverless metro financed through Île-de-France regional taxes. Spain, the fastest grower at 5.11% CAGR, pours USD 8.3 billion into a continuous standard-gauge rail spine from Algeciras to the French border, repositioning Valencia and Barcelona ports as the EU’s southern gateways for Asian imports. Italy channels USD 28 billion under its National Recovery and Resilience Plan, with the Naples-Bari high-speed rail, due 2029, linking the south to Rome in under three hours and catalyzing regional redevelopment.
The rest of Europe blends moderate but strategic spending. Poland’s USD 2.3 billion A1 motorway PPP shifts availability-payment models eastward and augments the corridor that moves goods between Baltic states and Western Europe. The Netherlands allocates USD 3.5 billion through 2027 for Port of Rotterdam automation and inland waterway digitization that collectively raise capacity by 3 million TEUs. Belgium, despite land constraints, green-lights a USD 1.6 billion quay extension at Antwerp-Bruges, while Nordic states ring-fence funds for tunnel safety retrofits that meet new EU fire-suppression codes. Growth is therefore quickest where EU co-financing pairs with local political consensus, rewarding contractors versed in multi-jurisdiction funding stacks and stringent environmental compliance regimes.
Competitive Landscape
Competition remains moderately fragmented, with no single contractor controlling more than roughly 6% of regional revenue. Pan-European majors such as VINCI, Bouygues, and ACS Group bid across borders, whereas HOCHTIEF, Ferrovial, and Webuild leverage home-market frameworks to secure renewals and small-to-mid greenfield packages. Scale matters on concessions: VINCI’s January 2026 USD 2 billion, 30-year Spanish electrification award showcases how balance-sheet strength buys entry into availability-payment deals where cash flows are indexed to track-access charges. Digital capabilities differentiate bids as well; contractors implementing BIM and sensor-rich concrete shave 18%-22% off rework and therefore score higher on quality-price tenders.
A white-space pocket is a rapid bridge replacement that uses prefabricated decks lowered into place over weekend closures, an approach that HOCHTIEF’s USD 1.1 billion A3 autobahn contract demonstrates clearly. Traditional cast-in-place specialists struggle to match this speed, compressing their margins on public frameworks that now favor time-sensitive delivery. Procurement reforms enacted in December 2024 obligate bidders exceeding USD 54 million to disclose scope-3 carbon intensity, immediately advantaging firms with low-carbon concrete and certified green-steel suppliers. STRABAG’s network of twelve vocational academies also provides a labor hedge, enabling it to staff complex jobs without resorting to high-cost external agencies.
Looking forward, consolidation pressure will rise as concession-centric business models require capital depth and sophisticated risk management that smaller regional firms lack. Emergent modular bridge makers and IoT-driven maintenance startups may be acquisition targets for incumbents eager to integrate performance-based service layers. Competitive advantage is thus migrating from lowest-cost construction toward integrated finance, design, build, and operate platforms that can monetize the entire asset life cycle.
Europe Transportation Infrastructure Construction Industry Leaders
VINCI SA
ACS Group (Dragados)
Bouygues Construction
HOCHTIEF AG
Eiffage SA
- *Disclaimer: Major Players sorted in no particular order

Recent Industry Developments
- January 2026: VINCI Concessions secured a 30-year, USD 2 billion availability-payment concession to electrify 420 kilometers of Spain’s Mediterranean Corridor, with completion due 2029.
- December 2025: Webuild and Astaldi won a USD 2.5 billion contract to finish the Naples-Bari high-speed rail, including 12 kilometers of Apennine tunnels, by 2029.
- November 2025: Bouygues and Budimex formed a joint venture bidding USD 1.5 billion for Warsaw Metro Line 3, financed 40% by the Connecting Europe Facility.
- October 2025: HOCHTIEF landed a USD 1.1 billion A3 autobahn modular-bridge renewal plus ten-year performance maintenance deal, completing 47 structures by 2029.


Europe Transportation Infrastructure Construction Market Report Scope
By Type
| Roadways |
| Railways |
| Airways |
| Ports & Inland Waterways |
By Construction Type
| New Construction |
| Renovation |
By Investment Source
| Public |
| Private |
By Country
| United Kingdom |
| Germany |
| France |
| Italy |
| Spain |
| Rest of Europe |
| By Type | Roadways |
| Railways | |
| Airways | |
| Ports & Inland Waterways | |
| By Construction Type | New Construction |
| Renovation | |
| By Investment Source | Public |
| Private | |
| By Country | United Kingdom |
| Germany | |
| France | |
| Italy | |
| Spain | |
| Rest of Europe |


Key Questions Answered in the Report
How large will Europe’s transportation infrastructure construction market be by 2031?
The market is forecast to reach USD 398.92 billion by 2031, expanding from USD 325.11 billion in 2026.
Which segment is growing fastest within European transport construction?
Railways lead with a 4.91% CAGR through 2031, driven by EU electrification mandates and cross-border freight corridors.
Why do renovation projects command most spending?
Aging bridges and tunnels built before 1980 require systematic upgrades, so renovation already captures 53.1% of 2025 outlays and continues to outsize new builds.
What financing model is attracting private investors?
Availability-payment PPP concessions, such as VINCIÕs 30-year Spanish electrification deal, offer predictable cash flows without exposing investors to direct traffic risk.
Which country leads in spending, and which grows fastest?
Germany holds the largest share at 25.8%, while Spain posts the quickest growth at a 5.11% CAGR on the Mediterranean Corridor program.
How are contractors addressing Europe’s skilled labor shortage?
Leading firms run vocational academies, adopt robotic construction methods, and recruit posted workers from Eastern Europe to bridge an 8% vacancy gap in specialist roles.
Page last updated on:


