Market Overview
| Study Period | 2020 - 2031 |
|---|---|
| Forecast Data Period | 2026 - 2031 |
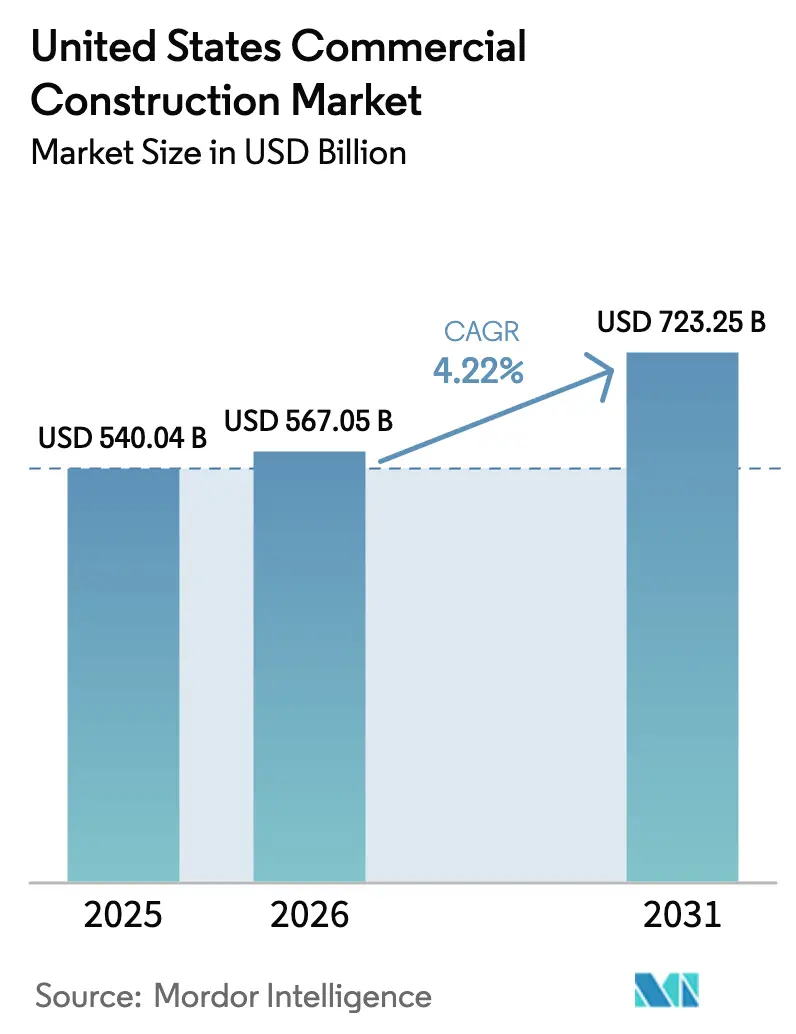
| Base Year Market Size (2025) | USD 540.04 Billion |
| Market Size (2026) | USD 567.05 Billion |
| Market Size (2031) | USD 723.25 Billion |
| Growth Rate (2026 - 2031) | 4.22% CAGR |
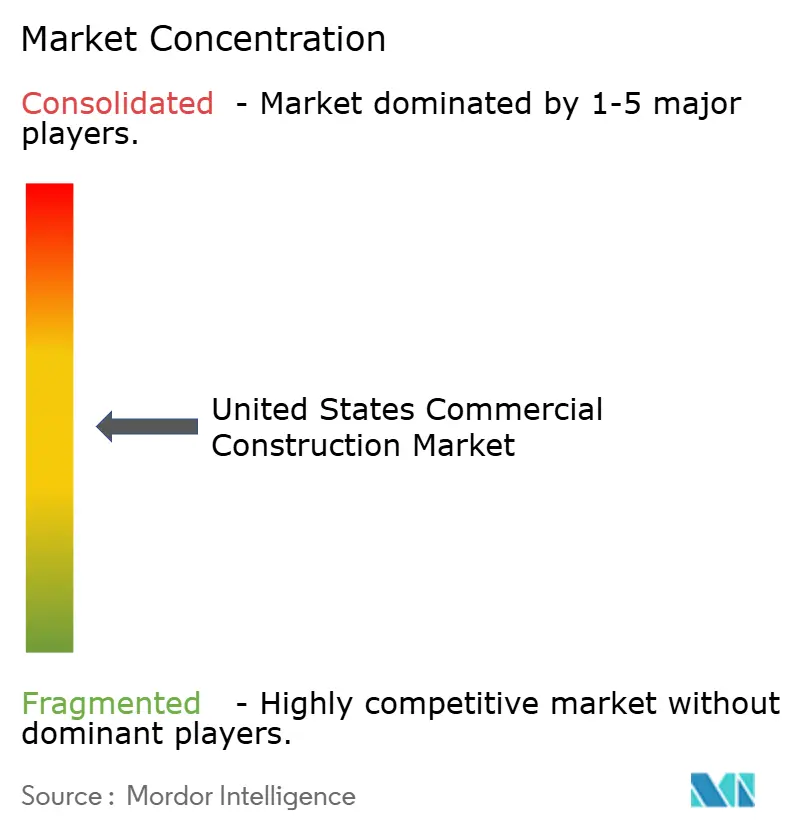
| Market Concentration | Medium |
Major Players *Disclaimer: Major Players sorted in no particular order Image © Mordor Intelligence. Reuse requires attribution under CC BY 4.0. | |
United States Commercial Construction Market Analysis by Mordor Intelligence
The United States commercial construction market size is estimated at USD 567.05 billion in 2026 and is projected to reach USD 723.25 billion by 2031 at a CAGR of 4.22% during the forecast period (2026-2031). Growth is supported by a mix of e-commerce warehouse expansion, hybrid workplace retrofits, accelerated data center buildouts for artificial intelligence compute, and federal infrastructure programs that catalyze transit-oriented commercial nodes. Competitive execution is shaped by labor scarcity and input inflation as wages and certain materials rose in 2025, a backdrop that favors contractors with early-purchase agreements, integrated MEP capabilities, and diversified geographic exposure. Project feasibility is also sensitive to financing conditions as lenders maintain tighter debt service coverage requirements, while policy-led sustainability standards push design teams toward LEED v5 and low-embodied-carbon specifications that are now common in public bids. The US commercial construction market is therefore balancing demand-side momentum with execution risks that require disciplined preconstruction, supply-chain hedging, and workforce strategies to protect margins and schedules.[1]https://www.agc.org/
Key Report Takeaways
- By commercial sector type, office construction led with a 35.1% share in 2025, while industrial and logistics are the fastest-growing at a 5.44% CAGR through 2031.
- By construction type, new construction accounted for 68.1% share of the US commercial construction market size in 2025, and renovation is projected to expand at a 5.20% CAGR during 2026-2031.
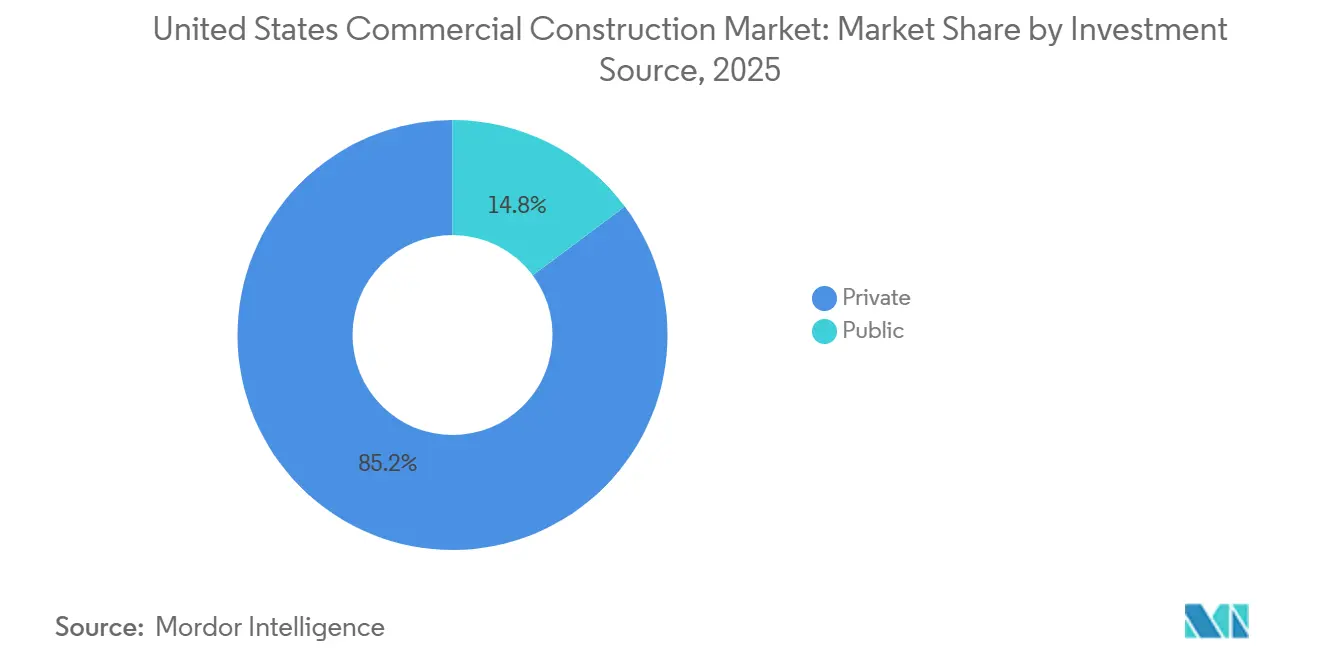
- By investment source, private spending held 85.2% in 2025, and public funding is set to grow at a 5.60% CAGR, aided by IIJA commitments.
- By states, Texas led with 17.0% in 2025, while Florida is forecast to post the fastest growth at a 5.45% CAGR during 2026-2031.
Note: Market size and forecast figures in this report are generated using Mordor Intelligence’s proprietary estimation framework, updated with the latest available data and insights as of January 2026.
United States Commercial Construction Market Trends and Insights
Drivers Impact Analysis*
| Drivers | (~) % Impact on CAGR Forecast | Geographic Relevance | Impact Timeline |
|---|---|---|---|
| Data center growth accelerating with new AI, cloud, and edge computing infrastructure. | +1.3% | National core markets (Northern Virginia, Texas, California, Illinois), expanding to the Midwest and Southeast | Long term (≥ 4 years) |
| E-commerce expansion fueling build-outs of warehouses, distribution centers, and fulfillment hubs. | +0.9% | National, with the strongest growth in Texas, California, Florida, Midwest logistics corridors | Medium term (2-4 years) |
| Public investment in transit and civic facilities sparking construction in infrastructure-adjacent zones. | +0.8% | National, with the highest concentration in states receiving IIJA funding (California, New York, Texas, Illinois) | Long term (≥ 4 years) |
| Office retrofit and redevelopment rising as employers seek more modern, hybrid-ready workplaces. | +0.7% | National, concentrated in major metros (New York, San Francisco, Chicago, Los Angeles) | Short term (≤ 2 years) |
| Hospitality and mixed-use projects are recovering, driven by strong travel and retail demand. | +0.6% | Florida, Nevada, Texas, major urban markets, and resort destinations nationwide | Medium term (2-4 years) |
| Green-building and ESG focus driving new commercial developments toward certified designs. | +0.5% | National, regulatory pressure strongest in California, New York, Washington; voluntary adoption accelerating nationwide | Long term (≥ 4 years) |
| Source: Mordor Intelligence | |||
E-Commerce Expansion Fuels Warehouse and Fulfillment Construction
E-commerce continues to steer location and product mix decisions as large retailers expand logistics footprints and push for speed-to-customer gains that require high-throughput facilities in core corridors. Amazon signed 31 million square feet of new leases in 2024, announced a USD 15 billion logistics expansion, adding nearly 80 facilities, and is positioned to capture around 25% of new industrial leasing in 2026. The U.S. delivered 146.6 million square feet of industrial space by mid-2025, with 341.8 million square feet under construction, while vacancy rose to 7.1% and signaled that supply was catching up to demand in select markets. Reshoring and nearshoring patterns amplify demand as 69% of U.S.-serving supply chains are projected to be Americas-based by 2026, up from 59%, supported by stronger U.S.-Mexico trade flows since 2018 and an upswing in nearshoring investment during early 2025. Within cold-chain logistics, online grocery is set to reach USD 100 billion in 2025, yet the nation’s 220 million square feet of refrigerated space trails demand by 75-100 million square feet, a gap that is prompting large-scale investments like New Cold’s USD 300 million expansion in Lebanon, Indiana. This divergence between standard warehouses and temperature-controlled facilities is sustaining rent premiums for specialized assets and rewarding developers with vertical integration or in-house MEP capabilities that manage complexity and cost.[2]https://www.commercialcafe.com/blog/us-industrial-2025-midyear-report
Hybrid Workplace Pressures Drive Office Retrofit and Adaptive Reuse
Corporate occupiers are channeling capital into quality over quantity to support hybrid models, wellness, and energy performance in their workspaces. Only 14% of the global workforce prefers a traditional corporate office, while 60% of organizations plan to increase spending on design, fit-out, and refurbishment, a shift that favors adaptive reuse and targeted upgrades. Retrofit pathways can cost 30-50% less than ground-up builds and speed occupancy, illustrated by JPMorgan’s 270 Park Avenue, a 2.5 million square foot all-electric skyscraper delivered in October 2025 that demonstrates high-performance design at scale. Conversion economics are strengthening as Gensler estimates around 34% of US office buildings can be repurposed to residential use at 30-40% below new-build costs, with Historic Tax Credits mobilizing billions in private capital for older downtown assets. Even as the national office vacancy rate reached 18.6% in late 2025, LEED-certified Class A properties command rent premiums that reinforce the business case for high-performance retrofits and high-quality tenant improvements. These dynamics keep retrofit pipelines active and position adaptive reuse as a resilient lever in the US commercial construction market through the forecast window.[3]https://www.gensler.com/research-insight/gensler-research-institute/global-workplace-survey
Data Center Construction Accelerates Amid AI and Cloud Compute Demand
AI, cloud, and edge workloads are reshaping location, design, and grid interface requirements for mission-critical projects. U.S. data center capacity is projected to grow roughly 10% annually through 2030 to reach the mid-30 gigawatt range, and nationwide electricity consumption attributed to data centers could rise from around 4% in 2025 to 7.5% by decade end. Mega-campuses are multiplying, including a USD 15 billion program for Vantage in Wisconsin and a USD 4 billion Microsoft project in Mount Pleasant, while sector construction spending is projected to peak at USD 89 billion in 2026, up sharply from 2022. Power delivery is the bottleneck as ERCOT expects double-digit demand growth in Texas by 2026, grid operators expand 345-kilovolt and 765-kilovolt corridors, and the Department of Energy advances plans to add or upgrade 100,000 miles of transmission this decade. Execution risk is most evident in utility interconnections and permitting, where 12-24 month timelines are common and local entitlements can add months to preconstruction before notice to proceed, especially for projects that require additional on-site power or storage. These projects remain a central growth engine for the US commercial construction market as developers adjust capital stacks to reflect longer lead times for power and procure switchgear, transformers, and cooling systems earlier in the schedule.
Public Infrastructure Investment Sparks Transit-Adjacent Commercial Growth
The Infrastructure Investment and Jobs Act provides USD 1.2 trillion over five years, which includes USD 550 billion in new federal spending as states move projects through procurement and contracting cycles. By late 2025, the Department of Transportation reported USD 411.5 billion in announced grants and USD 343.3 billion obligated with USD 189.1 billion outlaid, a cadence that signals an acceleration phase in 2026. Highway programs are driving more than 70,000 new federal-aid commitments and pushed contract awards up 36% in 2023 versus 2021, while the General Services Administration allocates USD 3.4 billion to modernize Land Ports of Entry that support cross-border commerce. Transit-adjacent commercial is clustering around catalysts like New York’s SPARC Kips Bay and Willets Point, which leverage public dollars to draw private investment for mixed-use hubs with proximity to rail and subway links. State-level momentum includes a USD 39.92 billion TxDOT budget for fiscal 2026-2027 that underpins backlogs and aligns with a broader decade-long transportation program that sustains contractor activity across Texas. ESG policy is also shaping specifications as California’s climate disclosure mandates take effect in 2026, reinforcing decarbonization and resilience requirements in municipal procurement.
Restraints Impact Analysis*
| Restraints | (~) % Impact on CAGR Forecast | Geographic Relevance | Impact Timeline |
|---|---|---|---|
| Skilled labor shortages and wage pressure slowing project delivery and increasing costs. | -0.7% | National, most acute in Sunbelt states (Texas, Florida, Arizona) with rapid population growth | Short term (≤ 2 years) |
| Tight lending conditions and rising interest rates hindering financing of speculative projects. | -0.6% | National, most pronounced in high-vacancy office markets (San Francisco, Chicago, New York) | Medium term (2-4 years) |
| High material and freight inflation compressing margins and delaying budgets. | -0.5% | National, with regional cost variations (New York, San Francisco most expensive; coastal cities face freight premiums) | Medium term (2-4 years) |
| Permitting delays and zoning restrictions prolonging pre-construction phases. | -0.3% | Most severe in California, New York, Illinois; sporadic delays in fast-growing Sunbelt metros | Long term (≥ 4 years) |
| Source: Mordor Intelligence | |||
Skilled Labor Shortages and Wage Pressure Slowing Project Delivery and Increasing Costs
Meeting 2026 demand requires recruiting 499,000 new workers after a shortfall year where most firms reported difficulty filling craft roles and an aging workforce pointed to higher retirements through the decade. Employers report the tightest gaps in specialized trades and estimating, which creates scheduling bottlenecks and increases reliance on overtime, incentives, and per diem policies that push project labor costs higher. Average hourly earnings in construction reached USD 38.76 by March 2025 and were up 4.5% year over year, while the sector paid more than manufacturing and transportation to compete for talent and retain crews on critical paths. Mission-critical work, such as data centers, pays premium rates that can pull electricians and HVAC technicians off other commercial sites and exacerbate staffing challenges for hospitals, schools, and civic projects. These pressures are broad-based, and they have led to measurable delays and potential output losses that reinforce the case for prefabrication, improved field productivity tools, and targeted training pipelines.
Financing Constraints and Loan Maturities Slow Speculative Development
Interest rates remained elevated through 2025 as the Federal funds rate held in the 4.25-4.50% range, and lenders tightened underwriting by asking for higher equity and debt service coverage above 1.25. Under these terms, a USD 100 million project financed over 10 years can add more than USD 15 million in interest expense compared to the low-rate era, which reduces feasibility for speculative starts in office and select retail formats. A loan maturity wall of USD 600 billion in 2024 and USD 500 billion in 2025 forced many owners to refinance at higher rates, and some downtown projects struggled to pencil, prompting ownership transitions on weaker assets. Hospitality financing conditions improved marginally as rate expectations eased, which supported selective new construction and acquisition pipelines in late 2025 and early 2026. Capital costs remain a key swing factor for the US commercial construction market in 2026 as developers weigh interest rate paths, absorption risks, and tighter loan structures against favorable long-term demand in data centers, logistics, and public works.
*Our forecasts treat driver/restraint impacts as directional, not additive. The impact forecasts reflect baseline growth, mix effects, and variable interactions.
Segment Analysis
By Commercial Sector Type: Industrial & Logistics Claims Fastest Expansion
Office construction held 35.1% of the US commercial construction market share in 2025, supported by hybrid workplace upgrades and adaptive reuse strategies that often deliver occupancy sooner and at lower cost than new towers. Growth is uneven across office segments as companies prioritize high-performance buildings with modern systems and certifications that align with tenant expectations and ESG commitments. Within the US commercial construction industry, the industrial and logistics segment is the fastest-growing, with a 5.44% CAGR through 2031 as fulfillment needs, reshoring momentum, and cold-chain expansion continue to absorb new space and sustain build-to-suit activity. Developers are tracking the split between commodity warehouses and specialized facilities such as temperature-controlled storage and high-power data centers that command premium rents but require early procurement and more complex MEP coordination. This segmentation is converging near rail, highway, and power infrastructure, further tightening site selection filters in core markets.
The demand profile is reinforced by Amazon’s multi-year expansion and broader leasing momentum among third-party logistics, which shape land prices, entitlement timelines, and construction schedules in high-growth corridors. Industrial deliveries and the pipeline reported by mid-2025 were high by historical standards, while vacancy increases indicated a healthier balance in certain submarkets that may moderate rent growth but still favor well-located assets. Data center spending is projected to peak at USD 89 billion in 2026 and has become a core driver of mission-critical work that shapes contractor backlogs and subtrade availability. These conditions keep industrial and logistics at the center of the US commercial construction market, with risk management focused on grid access, long-lead equipment, and entitlements for large-format projects.


By Construction Type: Renovation Gains Momentum Over New Builds
New construction accounted for 68.1% share of the US commercial construction market size in 2025, supported by data centers, industrial facilities, and select hospitality and mixed-use towers across high-demand metros. Renovation is growing faster at a 5.20% CAGR during 2026-2031 as owners seize the cost and time advantages of repurposing existing assets, often with support from Historic Tax Credits that have catalyzed significant private investment over time. Within the US commercial construction industry, retrofit programs are expanding in office, hospitality, and education as corporate and public owners target lower embodied carbon, improved energy performance, and healthier interiors aligned with LEED v5. Brand-mandated hotel property improvement plans and office fit-outs with flexible floor plates are further lifting renovation pipelines and contracting opportunities for interior specialists. Contractors are planning for abatement and structural upgrades common in older buildings, which require disciplined preconstruction to de-risk budgets and timelines.
City-led conversions and incentive programs in New York and Chicago underscore how municipal policy can unlock downtown reuse at scale by combining zoning with tax-increment financing and targeted grants. Large owners also demonstrate the viability of high-performance retrofits, exemplified by marquee projects that align with electrification and carbon goals now common in institutional portfolios. As procurement moves toward whole-building life-cycle assessments, renovation programs that preserve structure and reduce embodied carbon gain an edge in public bids and corporate governance reviews. The US commercial construction market is therefore set to see renovation capture a larger share of pipeline dollars through 2031, with supply chains adapting to the material and system profiles common in deep retrofits.
By Investment Source: Public Funding Surges on Infrastructure Act
Private investment constituted 85.2% of spending in 2025 across offices, industrial, hospitality, and data center builds financed by REITs, private equity, and corporate balance sheets. Public funding is the fastest-growing source with a 5.60% CAGR through 2031 due to IIJA allocations that continue to move into contract awards and outlays for highways, bridges, transit, and ports. Within the US commercial construction industry, these public projects create spillovers for transit-adjacent mixed-use developments as states and cities rezone nodes to capture private capital near rail stations and interchanges. Federal Land Ports of Entry and other civic facilities are also mobilizing design-build teams and specialty contractors, adding to a baseline of work that stabilizes backlogs through 2026. The public cycle helps offset tightening private credit conditions in select property types and supports regional contractors that specialize in transportation and civic work.
Obligation and outlay data confirm acceleration, with USD 411.5 billion in announced grants, USD 343.3 billion obligated, and USD 189.1 billion outlaid by late 2025, which implies strong bid opportunities for the year ahead. FHWA reports more than 70,000 new federal-aid project commitments and higher-than-average growth in contract values compared with pre-IIJA norms, reinforcing a durable foundation for vertical construction near upgraded corridors. Cities like New York are using public investments to leverage private development in life sciences and housing, which supports construction labor continuity and materials planning across the cycle. State programs in Texas add to this momentum with a USD 39.92 billion TxDOT budget that underwrites multi-year highway work and keeps heavy civil capacity engaged. Procurement compliance and Buy America rules remain important schedule variables, which contractors address through early submittals and supplier vetting to reduce lead-time risks on federally funded work.
Geography Analysis
Texas leads with 17.00% in 2025 on the strength of hyperscale data centers, semiconductor fabrication plants, and a USD 39.92 billion TxDOT budget for fiscal 2026-2027 that sustains construction backlogs tied to corridor upgrades. Florida is the fastest-growing state at a 5.45% CAGR from 2026 to 2031, powered by hospitality recoveries and convention center expansions that feed adjacent retail and mixed-use activity. California holds the second-largest share as nonresidential spending advances and IIJA inflows add visibility to public project pipelines across transportation and education infrastructure. New York’s three-year construction spending plan and MTA allocations are tilting the mix toward nonresidential projects while NYCEDC initiatives like SPARC Kips Bay draw private capital into transit-connected clusters. Illinois is scaling mixed-use, institutional, and bridge programs in Chicago that reinforce multi-year activity across commercial and heavy civil scopes.
The US commercial construction market is benefiting from diversified geographic engines where Sunbelt states absorb logistics and manufacturing demand while coastal markets move public infrastructure and select high-specification towers. Texas continues to capture mega-capital projects that require grid, water, and highway coordination, which supports both vertical and horizontal contractors in 2026. Florida’s hotel and entertainment pipeline remains active, and selective supply responses support project returns even as labor and materials stay tight in certain metro areas. California’s pivot toward civic and education projects reflects permitting complexity and cost structures in private development, yet maintains a consistent workload for large general contractors and specialty subs. New York and Illinois both demonstrate how public investment and zoning can catalyze private mixed-use and life sciences proposals around station areas and corridor upgrades.
States beyond the top tier are gaining share in specific niches. Wisconsin and Virginia are building data center capacity as utility plans and land availability align with campus-scale projects that require long lead times and early procurement of key electrical components. Arizona, Georgia, and North Carolina are securing advanced manufacturing investments due to incentive programs and ease of permitting compared with select coastal markets, which shifts supply chains and subcontractor networks toward these corridors. The US commercial construction market size tied to Florida is projected to expand at a 5.45% CAGR through 2031, reflecting durable tourism and convention demand layered on top of roadway and port investments. Texas maintains a stable growth path as semiconductor, biomanufacturing, and data center ecosystems deepen and reinforce commitments to infrastructure and power projects. New York’s public-private model is set to continue as agencies focus on signal modernization, accessibility, and station-area placemaking that unlocks mixed-use towers in boroughs with strong transit.
Competitive Landscape
The US commercial construction market remains fragmented as the top 50 firms account for less than 10% of total revenue, yet consolidation is increasing with a rise in private equity-backed roll-ups targeting specialized trades and regional leaders. The ENR Top 400 reported combined revenue growth in 2024, and the largest firms expanded backlogs in mission-critical, healthcare, and education, with Turner reporting USD 20.2 billion in 2024 revenue and a USD 12.6 billion data center backlog. Bechtel, Kiewit, and Whiting-Turner maintained leading positions, while HITT Contracting scaled rapidly by expanding into mission-critical and industrial, a reflection of demand concentration in data centers and advanced manufacturing. Contractors with vertical integration in MEP and sitework are better positioned to manage lead times and mitigate rework, which has become a differentiator in tight labor and material markets.
Firms are also investing in technology to close field-office data gaps and reduce waste. Cloud-based project management, reality capture, and digital twins are becoming standard, with leading companies experimenting with robotics for layout and repetitive tasks that improve consistency and safety. Hensel Phelps launched a venture platform to pilot construction technologies for high-risk scopes, while Windover demonstrated the operational value of digital twins on campus-scale projects. These capabilities are relevant for data center and hospital programs that require rigorous commissioning and systems integration, a theme that is remaking preconstruction and quality control at scale. Process discipline and early procurement are also more common as tariff regimes keep risk elevated across metals and electrical components, which pushes contractors to add North American suppliers and renegotiate pass-through clauses.
Regional competitive dynamics are shifting as Sunbelt metros see deeper bid benches and more cross-market entries from coastal firms. Nashville reported shrinking subcontractor backlogs and greater bid coverage, while Seattle and Portland saw general contractors expand into nearby markets to defend share and balance exposure. Large awards in Texas, including USD 889 million and USD 746 million interstate reconstruction projects for Balfour Beatty, demonstrate how heavy civil work can anchor backlogs and mobilize multiyear teams. Data center megaprojects in the Mid-Atlantic and Midwest are also concentrating activity with multi-billion-dollar campus contracts that require mission-critical specialists and deep vendor networks. The US commercial construction market remains open for consolidation in specialized trades and for scaled general contractors that can operate across regions, navigate compliance, and deliver at speed for owners with complex programs.
United States Commercial Construction Industry Leaders
Turner Construction Company
The Whiting-Turner Contracting Company
STO Building Group
DPR Construction
Clark Construction Group
- *Disclaimer: Major Players sorted in no particular order

Recent Industry Developments
- December 2025: Turner Construction, DPR Construction, and M. A. Mortenson began construction on Meta's Richland Parish Data Center in Louisiana, a custom-designed four-million-square-foot campus representing more than USD 10 billion in investment by Meta, with over USD 200 million in local infrastructure improvements; construction on the AI buildings is scheduled to begin in late summer 2025, and the project will support over 500 operational jobs.
- October 2025: AECOM Hunt and Turner Construction Company formed the AECOM Hunt-Turner Joint Venture and were selected as construction managers for the new Huntington Bank Field in Cleveland, Ohio (67,500-seat enclosed stadium), with Independence Construction and DiGeronimo Companies joining the JV; enabling work began October 1, 2025, formal groundbreaking is scheduled for early 2026, and the stadium is on track to open in 2029, creating over 6,000 construction jobs.
- September 2025: Hensel Phelps secured a USD 700 million contract for an airport expansion project at Boise, Idaho, involving 10 new gates, with construction underway and completion targeted for the end of the decade.
- September 2025: Whiting-Turner received two major Coast Guard contracts: USD 137 million for base work in Seattle, Washington (upgrading ship berths, demolishing buildings, stabilizing waterfronts), and USD 69 million for hangar construction in Kapolei, Hawaii .


Research Methodology Framework and Report Scope
Market Definitions and Key Coverage
Our study defines the United States commercial construction market as all spending tied to erecting, expanding, or refurbishing income-generating non-residential buildings, office towers, shopping centers, logistics hubs, industrial plants, hotels, and medical complexes, booked at contract award inside U.S. borders. We value each project at the contract amount in the year work commences, giving buyers a clear, like-for-like baseline.
Scope exclusion: civil infrastructure such as roads, bridges, utilities, and energy facilities sits outside this definition.
Segmentation Overview
- By Commercial Sector Type
- Office
- Retail
- Industrial & Logistics
- Others
- By Construction Type
- New Construction
- Renovation
- By Investment Source
- Public
- Private
- By States
- Texas
- California
- Florida
- New York
- Illinois
- Rest of US
Detailed Research Methodology and Data Validation
Primary Research
Our team spoke with general contractors, specialty subcontractors, project financiers, and state permitting officials across Sunbelt, Midwest, and Coastal hubs. Their insights on bid rates, contingency buffers, and start dates sharpened assumptions drawn from desk work.
Desk Research
We began with public datasets from the U.S. Census Bureau Value of Construction Put in Place files, Bureau of Labor Statistics cost indices, BEA fixed-asset accounts, Federal Reserve lending surveys, and briefs from AIA, NAIOP, and AGC. Mordor analysts then mined company 10-Ks, investor decks, and municipal bond prospectuses to map future pipelines and refine cost splits. Paid portals, D&B Hoovers and Dow Jones Factiva, supplied contractor financials and award notices. This roster is illustrative; many other feeds supported data collection, validation, and clarification.
Market-Sizing & Forecasting
A top-down model converts quarterly Census spending and permit statistics into the 2024 revenue baseline, then cross-checks results with selective bottom-up rollups, sampled contract values multiplied by representative floor area. Key drivers we track include class-A office vacancy, e-commerce share of retail sales, steel rebar prices, state capital budgets, and data-center megawatt additions. Multivariate regression links these indicators to historic spend and projects results through 2030, adjusting weights whenever bottom-up checks deviate by more than two percent.
Data Validation & Update Cycle
Each model passes anomaly scans, peer review, and a senior sign-off. Figures refresh every year, with interim updates whenever new legislation, price shocks, or mega-project news materially shift inputs.
Why Mordor's US Commercial Construction Baseline Earns Buyer Confidence
Published estimates often diverge because firms select different building lists, soft-cost mark-ups, and refresh cadences. Gaps we observe elsewhere include narrower project scope, uniform escalation factors, and reliance on announced work without cancellation tests; our six-variable model and frequent updates avoid these pitfalls.
Benchmark comparison
| Market Size | Anonymized source | Primary gap driver |
|---|---|---|
| USD 567.05 B | Mordor Intelligence | - |
| USD 585.20 B | Regional Consultancy A | Renovation activity excluded; uniform escalation applied |
| USD 570.30 B | Trade Journal B | Counts announced projects only; ignores cancellation risk |
| USD 104.42 B | Global Consultancy C | Focuses on major CBDs; omits industrial and healthcare builds |
2024 value used where 2025 figure is unavailable.
These contrasts show that once scope and cost logic are leveled, Mordor's disciplined variable tracking yields a balanced, transparent baseline that decision-makers can replicate and stress-test quickly.


Key Questions Answered in the Report
What is the US commercial construction market size and growth outlook through 2031?
The US commercial construction market size is USD 567.05 billion in 2026 and is projected to reach USD 723.25 billion by 2031 at a 4.22% CAGR, supported by logistics, data centers, retrofits, and public infrastructure work.
Which segments lead, and which are growing the fastest in the US commercial construction market?
Office led with 35.10% in 2025 while industrial and logistics is the fastest-growing at a 5.44% CAGR during 2026-2031 on e-commerce and reshoring demand.
How are data centers influencing the US commercial construction market in 2026?
Data centers are driving mission-critical backlogs as sector spending is projected to peak in 2026, and utility interconnections shape schedules and site selection.
How does IIJA funding affect private commercial development opportunities?
Federal grants, obligations, and outlays are flowing into highways, transit, and ports, which catalyze transit-adjacent mixed-use towers and stabilize contractor backlogs.
Which states are most attractive for commercial projects right now?
Texas leads with 17.00% in 2025 on hyperscale and semiconductor pipelines while Florida posts the fastest growth at a 5.45% CAGR due to hospitality and convention expansions.
What are the main execution risks for the US commercial construction market in 2026?
The biggest risks are labor shortages, materials and tariff pressures, tighter lending terms, and permitting delays that extend preconstruction and increase carrying costs.
Page last updated on:


