Market Overview
| Study Period | 2020 - 2031 |
|---|---|
| Forecast Data Period | 2026 - 2031 |
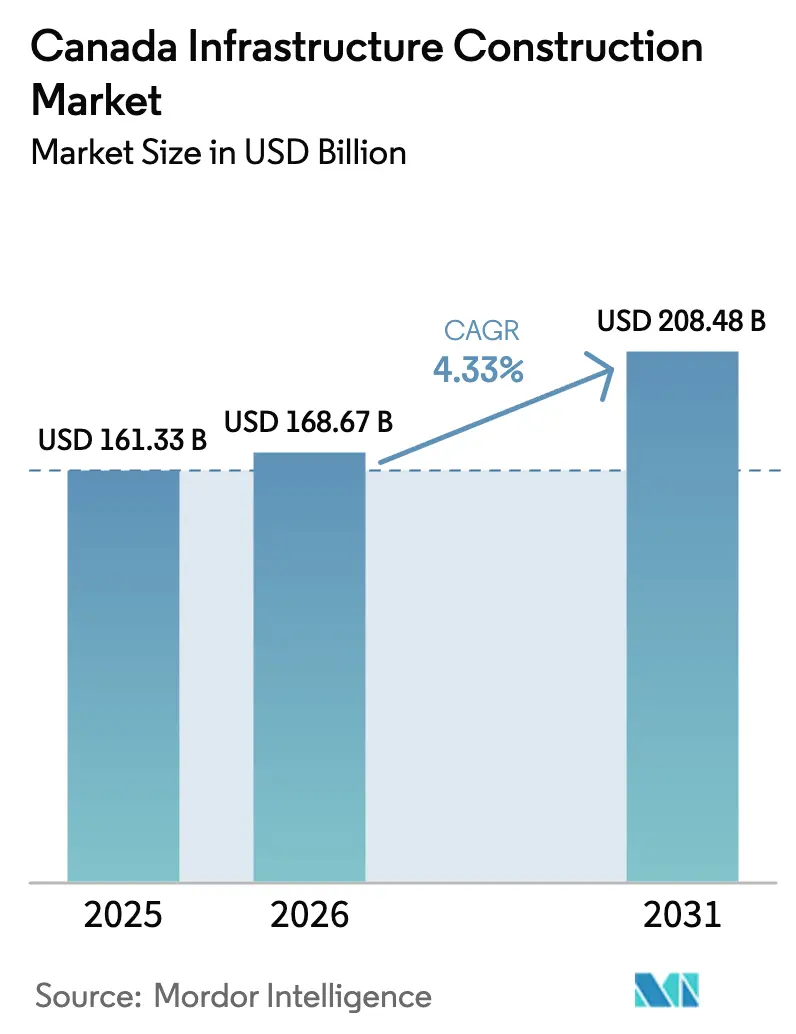
| Base Year Market Size (2025) | USD 161.33 Billion |
| Market Size (2026) | USD 168.67 Billion |
| Market Size (2031) | USD 208.48 Billion |
| Growth Rate (2026 - 2031) | 4.33% CAGR |
| Market Concentration | Medium |
Major Players *Disclaimer: Major Players sorted in no particular order Image © Mordor Intelligence. Reuse requires attribution under CC BY 4.0. | |
Canada Infrastructure Construction Market Analysis by Mordor Intelligence
The Canada infrastructure construction market size is projected to expand from USD 161.33 billion in 2025 and USD 168.67 billion in 2026 to USD 208.48 billion by 2031, registering a 4.33% CAGR between 2026 and 2031. Federal capital programs anchored by the Investing in Canada Plan and clean-electricity investment tax credits are underwriting transit corridors, grid upgrades, and Arctic logistics, giving contractors line-of-sight on multi-year revenues that smooth bid pipelines. Compressed permitting cycles from the Major Projects Office are shortening financial-close timelines, lowering carrying costs for engineering-procurement-construction firms and encouraging earlier mobilization[1]Government of Canada, “Major Projects Office,” canada.ca. Hyperscale data-center demand is rewriting power-sector cap-ex priorities as utilities in Ontario, Québec, and British Columbia race to deliver 100-plus-megawatt interconnections for cloud and AI workloads. Together, these forces are amplifying near-term construction activity, while long-term decarbonization targets ensure sustained demand across transit, power, and digital corridors.
Key Report Takeaways
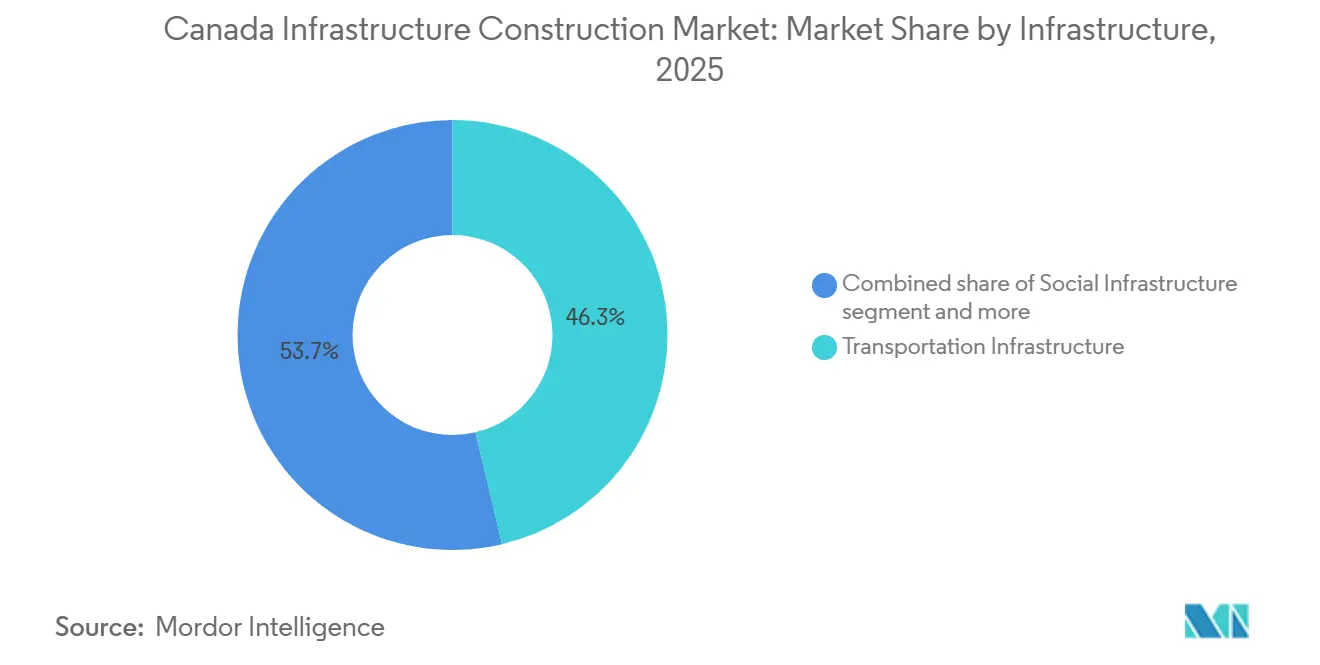
- By infrastructure type, transportation led with 46.30% of Canada's infrastructure construction market share in 2025; utilities and digital infrastructure are advancing at a 9.80% CAGR through 2031.
- By construction type, new construction accounted for 71.40% share of the Canada infrastructure construction market size in 2025, while renovation and retrofit are climbing at a 7.20% CAGR to 2031.
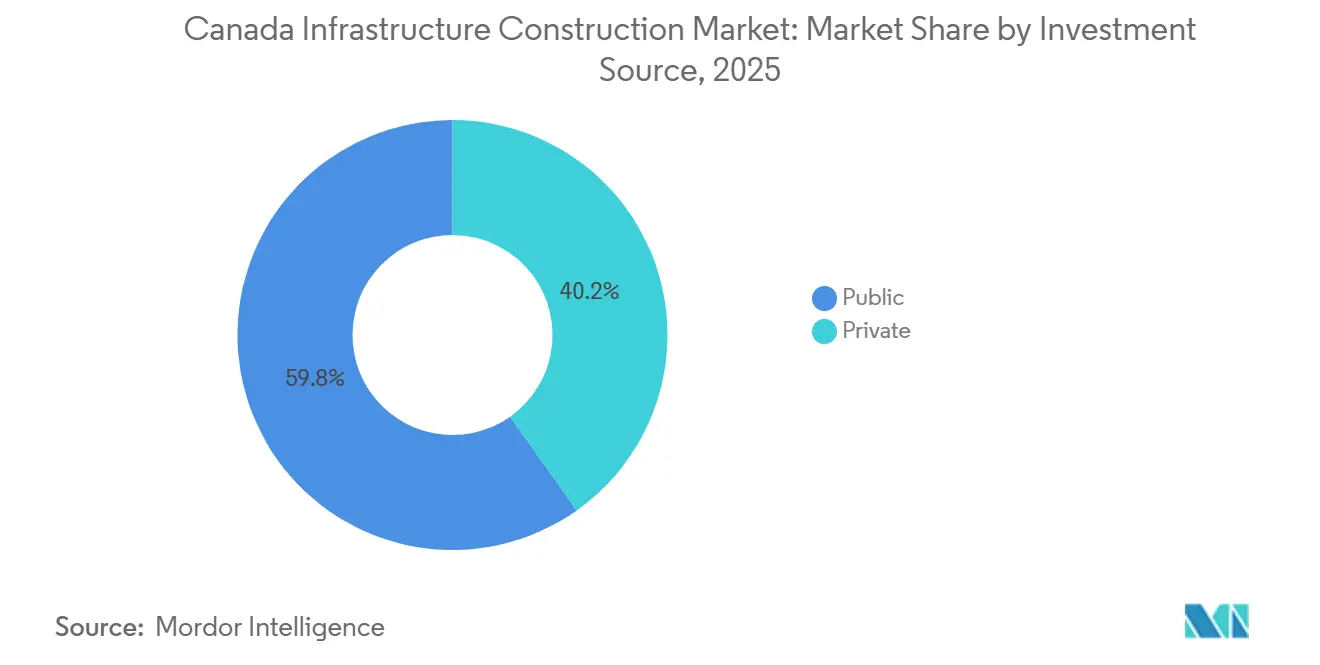
- By investment source, public funding held a 59.80% share of the Canada infrastructure construction market size in 2025; private capital records the quickest expansion at a 6.50% CAGR through 2031.
- By geography, Ontario captured 38.70% share of the Canada infrastructure construction market size in 2025, whereas Alberta shows the fastest 5.9% CAGR during 2026-2031.
Note: Market size and forecast figures in this report are generated using Mordor Intelligence’s proprietary estimation framework, updated with the latest available data and insights as of January 2026.
Canada Infrastructure Construction Market Trends and Insights
Drivers Impact Analysis*
| Drivers | (~) % Impact on CAGR Forecast | Geographic Relevance | Impact Timeline |
|---|---|---|---|
| Sustained federal capital programs (Investing in Canada Plan, Build Communities Strong Fund, National Trade Corridors Fund) | +1.2% | National, with concentration in Ontario, Québec, British Columbia | Long term (≥ 4 years) |
| Urban rapid-transit megaproject pipeline in Toronto, Montréal, Vancouver and emerging HSR corridor | +0.9% | Ontario (Toronto), Québec (Montréal), British Columbia (Vancouver), emerging Ottawa-Montréal corridor | Medium term (2-4 years) |
| Surging data-center/AI power demand driving grid & digital-infrastructure build-outs | +0.8% | Ontario, Québec, British Columbia (hyperscaler hubs) | Short term (≤ 2 years) |
| Net-zero building codes & clean-electricity tax credits accelerating green and resilient construction | +0.7% | National, early adoption in British Columbia, Ontario, Québec | Medium term (2-4 years) |
| "One-project-one-review" Major Projects Office cutting average permitting time by up to 18 months | +0.5% | National, particularly benefiting large-scale energy, mining, and transportation projects | Short term (≤ 2 years) |
| Arctic & Northern corridor investments (Arctic Infrastructure Fund, Port of Churchill upgrades) unlocking northern build-out | +0.4% | Northern territories, northern Manitoba, northern Ontario, northern Québec | Long term (≥ 4 years) |
| Source: Mordor Intelligence | |||
Sustained Federal Capital Programs Fueling Multi-Year Pipeline Visibility
Canada's long-term construction demand is bolstered by substantial federal investments, with over USD 133 billion allocated across various infrastructure categories through 2028. This commitment offers contractors and engineering firms a stable revenue backdrop, mitigating bid-pipeline fluctuations. Funds like the Build Communities Strong Fund and the National Trade Corridors Fund are channeling investments into smaller municipalities and freight-logistics hubs. These segments, historically starved of financing and often postponing maintenance, are now addressing their backlog. Clean-electricity investment tax credits—offering up to 30% coverage on capital costs for renewable generation, storage, and transmission—are accelerating grid-modernization projects. Utilities had initially slated these for the 2030s, but the new timeline shortens payback periods for private co-investors and enhances the appeal of P3 structures. Federal funding is also mitigating risks for Arctic and northern projects, where private capital usually seeks steep returns due to permafrost engineering challenges and limited exit liquidity. The result is a clear, multi-year project pipeline, enabling contractors to optimize workforce utilization and secure favorable supplier terms, benefiting larger, diversified firms with a national presence.
Urban Rapid-Transit Megaprojects Reshaping Metropolitan Construction Demand
In 2022, the Connect 6ix consortium, comprising Aecon, ACS Infrastructure, and Dragados Canada, secured a financial close for Toronto's Ontario Line—a 15.6-kilometer rail corridor with a budget of USD 4.4 billion. The project is now in full swing, with tunneling and station-box excavation fueling heavy civil demand through 2027. Montréal's Réseau express métropolitain (REM) branches debuted in November 2025 and spring 2026, with a total project cost of USD 7 billion. This success underscores that with design-build-finance-maintain contracts, which shift long-term performance risks to private consortia, automated light-metro systems can be delivered within budget. Vancouver's Broadway Subway, costing USD 2.95 billion, is on track to debut in fall 2027, while the Surrey-Langley SkyTrain extension, priced at USD 6 billion, is set for a late 2029 opening. Together, they will add over 20 kilometers of grade-separated rapid transit, requiring continued systems integration and station outfitting into the next decade.
The Alto high-speed rail corridor, connecting Québec City, Montréal, Ottawa, and Toronto, selected its Ottawa-Montréal segment as the first phase in 2025. Construction is slated to begin in 2029, with a total program cost projected between USD 44-66 billion, making it Canada’s largest infrastructure project and a potential catalyst for domestic rolling-stock manufacturing. These megaprojects are driving demand for specialized trades—tunnel miners, systems engineers, and electrification specialists—leading to wage increases and pushing contractors to recruit internationally or invest in 3–4 year apprenticeship programs to build skilled capacity.
Surging Data-Center and AI Power Demand Driving Grid and Digital-Infrastructure Build-Outs
Microsoft is investing USD 7.5 billion over two years to expand its cloud and AI infrastructure in Canada, with its first hyperscale data center set to launch in late 2026. This project requires dedicated substations and fiber-optic trunk lines, prompting utility and telecom providers to act swiftly. Bell Canada’s AI Fabric initiative targets 500 megawatts of distributed data-center capacity across British Columbia, Ontario, and Québec, necessitating new transmission corridors and substation upgrades to meet hyperscalers' 99.999% uptime demands. The federal government’s USD 2 billion Sovereign AI Compute Strategy, announced in 2024, is accelerating investments in edge data centers and regional fiber builds to reduce reliance on foreign cloud providers. Innovation, Science and Economic Development Canada (ISED) called for proposals in late 2025 for data centers exceeding 100 megawatts, with submissions closing in February 2026, signaling more hyperscale projects ahead. The power demands of these facilities—50 to 100 megawatts each—are straining urban grids, forcing utilities to fast-track transmission upgrades and energy-storage deployments, driving demand for high-voltage electrical contractors and power-systems engineers.
Net-Zero Building Codes and Clean-Electricity Tax Credits Accelerating Green Construction
Starting in 2025, updated national building codes will require new commercial and institutional structures to reduce energy use intensity by 20-30% compared to 2015 levels. Developers must adopt high-performance envelopes, heat-recovery ventilation, and on-site renewable generation, increasing upfront costs by 5-10% but cutting operating expenses by 15-25% over 20 years (National Research Council Canada). Clean-electricity investment tax credits subsidize solar photovoltaic arrays, battery-energy storage systems, and EV charging infrastructure, favoring integrated design-build teams (Department of Finance Canada). Retrofit activities are rising, driven by municipal programs in Vancouver, Toronto, and Montréal offering grants covering up to 50% of costs for building-envelope upgrades and mechanical-system replacements. Early adopters investing in Passive House designers, BIM workflows, and prefabricated-panel supply chains are capturing premium margins, while laggards face higher rework rates and longer approval cycles due to stricter energy-modeling reviews.
Restraints Impact Analysis*
| Restraints | (~) % Impact on CAGR Forecast | Geographic Relevance | Impact Timeline |
|---|---|---|---|
| Ongoing skilled-labor shortages and wage inflation in key trades | -0.6% | National, acute in remote/northern regions and major metropolitan transit corridors | Short term (≤ 2 years) |
| Material-cost volatility amid global supply shocks & tariff risk | -0.4% | National, with higher exposure in steel-intensive projects (bridges, high-rise) and lumber-dependent residential/light-commercial work | Medium term (2-4 years) |
| Multi-tier regulatory approvals still complex, despite reforms | -0.3% | National, particularly affecting projects spanning multiple provinces or requiring federal-provincial coordination | Medium term (2-4 years) |
| Buy-Canadian procurement rules tightening domestic-content requirements and raising sourcing risk | -0.2% | National, particularly affecting federally funded infrastructure with specialized equipment requirements | Short term (≤ 2 years) |
| Source: Mordor Intelligence | |||
Ongoing Skilled-Labor Shortages and Wage Inflation in Key Trades
In 2024, the construction sector added 266,000 jobs, yet unemployment reached 5.6% by January 2025, with wage growth rising to 4.9%. This reflects a mismatch between labor availability and specialized skills in transit-systems integration, high-voltage electrical work, and heavy-civil tunneling[2]Statistics Canada, “Labour Force Survey Jan 2025,” statcan.gc.ca. Apprenticeship completion rates for electricians, pipefitters, and heavy-equipment operators remain below 60%, worsening supply constraints in trades where retirements outpace new entrants by nearly two-to-one in some provinces. Northern and remote projects face greater challenges, with contractors offering 30-50% wage premiums and rotation allowances to attract workers, eroding margins on fixed-price contracts and deterring smaller firms from Arctic infrastructure tenders. Labor shortages are also extending project timelines, as staggered crew deployments increase overhead and expose projects to weather-related delays. Wage inflation is acute in metropolitan transit corridors, where competition for tunnel miners, systems engineers, and electrification specialists has driven labor budgets up by 10-15% compared to initial estimates.
Material-Cost Volatility Amid Global Supply Shocks and Tariff Risk
In 2024, global supply-chain disruptions and Section 232 tariff discussions between Canada and the U.S. drove a 15% rise in steel prices. Cement costs increased by 8-10% due to higher natural gas prices and carbon-pricing obligations on kiln operations. Lumber prices fluctuated between USD 300 and USD 450 per thousand board feet, impacted by softwood-lumber trade disputes and wildfire-related timber shortages in British Columbia mills, making fixed-price bids beyond 6-9 months challenging. Contractors faced semiconductor shortages affecting building-automation systems, resin shortages disrupting PVC piping, and shipping-container delays for specialty equipment. These issues forced larger material inventories and longer lead times, straining working capital and raising financing costs. Tariff risks from Canada-U.S. trade talks could add 5-10% to project costs and prompt fixed-price contract renegotiations, pushing public-sector clients toward cost-reimbursable structures. Contractors are adopting escalation clauses, bulk purchasing, and prefabrication strategies to lock in material costs earlier, benefiting vertically integrated firms with in-house fabrication and strong supplier networks.
*Our forecasts treat driver/restraint impacts as directional, not additive. The impact forecasts reflect baseline growth, mix effects, and variable interactions.
Segment Analysis
By Infrastructure: Transit and Digital Corridors Anchor Demand
Transportation infrastructure held 46.30% of total construction value in 2025, underscoring the dominance of metro and light-rail projects that funnel capital to Toronto, Montréal, and Vancouver. The Canada infrastructure construction market size for transportation equated to USD 74.7 billion in the base year, with multi-year tunneling and systems contracts locking in revenues for major civil contractors. Utilities and digital infrastructure is projected to post the fastest 9.80% CAGR to 2031, powered by hyperscale data centers and grid-modernization mandates linked to net-zero goals.
Elevated spending on social facilities follows provincial hospital rebuilds valued at CAD 30 billion (USD 22 billion) in Ontario alone, extending demand for complex mechanical, electrical, and infection-control expertise. Extraction and critical minerals infrastructure, while smaller, benefits from battery metals supply-chain priorities driving road and power extensions to the Ring of Fire and Alberta lithium basins. Each sub-segment contributes to a diversified Canada infrastructure construction market, cushioning cyclical swings.
Utilities and digital corridors illustrate how grid and fiber upgrades increasingly overlap. Every 100-megawatt data center now commands substation builds exceeding USD 150 million, plus fiber trunk lines that bundle telecom and electric scopes. Contractors with design-build capacity across both networks capture synergies and mitigate interface risk. Meanwhile, transit megaprojects emphasize tunneling expertise, signalling work, and rolling-stock integration, giving incumbents like Aecon and SNC-Lavalin avenues to leverage P3 credentials and deepen client relationships.


By Construction Type: Retrofit Momentum Builds
New construction accounted for 71.40% of Canada infrastructure construction market share in 2025, reflecting greenfield rail corridors, data-center campuses, and hospital replacements[3]National Research Council Canada, “National Building Code 2025,” nrc.canada.ca. Renovation and retrofit, however, is set to outpace with a 7.20% CAGR to 2031 as energy-performance standards tighten. Deep-energy retrofits can cut consumption 50-70%, and municipal grants covering up to half the cost shorten paybacks to under ten years, transforming voluntary upgrades into mandated capital programs.
The prevalence of 1960s-era buildings needing seismic and energy upgrades shifts contractor focus from ground-up to occupied-building expertise. Seismic mandates in British Columbia spark demand for shear-wall installs and base isolators that solve life-safety risks without full shutdowns. Integrated project delivery gains favor as owners seek schedule and cost certainty amid live-environment constraints. Prefabricated MEP racks and bathroom pods reduce on-site labor 20-30%, aligning with skilled-labor scarcity. These dynamics expand the Canada infrastructure construction market to firms adept at modular retrofit solutions.
By Investment Source: Private Capital Ascends
Public spending still represented 59.80% of construction value in 2025, yet private investment is growing 6.50% annually as P3 structures mature and hyperscalers commit multibillion-dollar data hubs. The Canada infrastructure construction industry sees private consortia financing, building, and maintaining assets for 25-30 years, spreading risk and smoothing returns. More than 60 P3s have reached financial close since 2010, worth over CAD 50 billion (USD 37 billion), forging a deep local ecosystem of lenders and advisers.
Data centers led by Microsoft, Amazon, and Google inject purely private dollars, bypassing public approvals beyond standard zoning and power interconnection. LNG Canada’s USD 30 billion terminal exemplifies privately funded heavy-industrial infrastructure that propels coastal British Columbia construction. Private capital also backs long-term-care and student-housing projects under availability-payment models that shift operating risk to developers. The result is a Canada infrastructure construction market that blends stable public funding with a rising wave of institutional capital chasing inflation-linked yields.
Geography Analysis
Ontario dominated with 38.70% of national construction value in 2025, buoyed by the USD 4.4 billion Ontario Line, USD 22 billion hospital rebuilds, and the USD 7.4 billion Highway 413, each reinforcing the province’s mature P3 framework. The market also benefits from population share near 40% and a seasoned contractor base comfortable with design-build-finance-maintain models. Québec follows with the REM’s USD 7 billion completion and Northvolt’s USD 5.2 billion battery plant that requires substations, logistics facilities, and worker housing, concentrating spend in the Montérégie region. British Columbia continues work on the USD 2.95 billion Broadway Subway, the USD 6 billion Surrey-Langley extension, and evaluation of an additional USD 7.4-11 billion LNG train, anchoring heavy-civil and marine scopes.
Alberta, while smaller in absolute value, is projected to grow fastest at 5.9% CAGR as hydrogen hubs, petrochemical expansions, and renewable-energy corridors diversify its oil-centric economy. Projects such as a USD 1.5 billion carbon-capture and hydrogen complex near Edmonton will test high-pressure pipeline expertise and new clean-fuel regulations. The rest of Canada, covering the Prairies, the Atlantic provinces, and the territories, sees increased Arctic and corridor spending, yet smaller populations and higher per-unit costs cap share below 20%. Extreme weather and limited local labor push cost premiums 30-50%, steering federal funders toward phased, multi-year awards.
The Alto high-speed rail corridor straddling Ontario and Québec signals an era of binational coordination on environmental approvals and rolling-stock procurement, setting templates for subsequent phases. Ontario hospital rebuilds integrate pandemic-resilient ventilation and modular operating rooms, driving specialist demand through the next decade. Québec battery-supply-chain clustering enables shared infrastructure that lowers per-project cap-ex, while British Columbia’s potential LNG expansion hinges on global gas prices and carbon-pricing certainty. Collectively, regional priorities diversify the Canada infrastructure construction market and distribute labor demand across provincial borders.
Competitive Landscape
The Canada infrastructure construction market is moderately fragmented. Major contractors such as Aecon, PCL Construction, EllisDon, AtkinsRéalis, Bird Construction, Pomerleau, and Kiewit Corporation collectively account for a significant portion of project activity, while still leaving substantial room for regional contractors and Indigenous-partnership ventures to participate in infrastructure development. Competitive advantage increasingly rests on P3 fluency, balance-sheet strength to carry long-dated receivables, and integrated design-build capabilities that compress schedules and reduce change orders. Firms well-versed in building information modeling workflows employ digital twins to track field progress and forecast maintenance, widening performance gaps over paper-based rivals.
Aecon’s role in the Connect 6ix consortium on the Ontario Line secures decades of maintenance fees, illustrating how long-term concessions smooth cash flow and justify investments in tunneling equipment. PCL’s recent Calgary hospital expansion demonstrates proficiency in complex MEP and infection control, reinforcing credentials for upcoming healthcare tenders. Bird’s joint venture with an Indigenous-owned firm targets northern mining roads, leveraging local knowledge to reduce permitting risk and satisfy federal reconciliation goals.
Technology adoption serves as another differentiation lever. Early movers deploy autonomous earth-moving fleets, drone surveys, and AI-driven project controls that trim overhead by up to 10% and enhance schedule certainty. Cross-laminated timber specialists carve a niche in mid-rise institutional builds, capitalizing on lower embodied carbon and faster erection, though limited domestic supply restrains large-scale uptake. Arctic logistics remains a white-space opportunity, as few firms possess ice-reinforced marine assets or permafrost-ready foundations expertise, enabling premium pricing in this high-barrier sub-sector of the Canada infrastructure construction market.
Canada Infrastructure Construction Industry Leaders
Aecon Group Inc.
PCL Construction
EllisDon Corporation
SNC-Lavalin Group
Graham Construction
- *Disclaimer: Major Players sorted in no particular order

Recent Industry Developments
- February 2026: Innovation, Science and Economic Development Canada closed proposals for data centers exceeding 100 MW, confirming more hyperscale builds ahead.
- December 2025: Aecon, within the Crosslinx consortium, reached substantial completion of Toronto’s 19-kilometer Eglinton Crosstown LRT.
- November 2025: Montréal’s REM opened initial branches, validating design-build-finance-maintain delivery at USD 7 billion total cost.
- September 2025: Trillium Rail Partners won the USD 3.5 billion Eglinton Crosstown West Extension, with construction slated for 2026.


Canada Infrastructure Construction Market Report Scope
The infrastructure of a country, society, or organization consists of basic facilities such as transport, communications, power supplies, and buildings, which enable it to function.
The infrastructure sector in Canada is segmented By Infrastructure Segment (Social Infrastructure, Transportation Infrastructure, Extraction Infrastructure, and Manufacturing Infrastructure). The report offers the market sizes and forecasts for the Infrastructure Sector in Canada market in value (USD) for all the above segments.
By Infrastructure
| Transportation Infrastructure |
| Utilities & Digital Infrastructure |
| Social Infrastructure |
| Extraction & Critical-Minerals Infrastructure |
By Construction Type
| New Construction |
| Renovation / Retrofit |
By Investment Source
| Public |
| Private |
By Geography
| Ontario |
| Québec |
| British Columbia |
| Alberta |
| Rest of Canada |
| By Infrastructure | Transportation Infrastructure |
| Utilities & Digital Infrastructure | |
| Social Infrastructure | |
| Extraction & Critical-Minerals Infrastructure | |
| By Construction Type | New Construction |
| Renovation / Retrofit | |
| By Investment Source | Public |
| Private | |
| By Geography | Ontario |
| Québec | |
| British Columbia | |
| Alberta | |
| Rest of Canada |


Key Questions Answered in the Report
What is the forecast value of the Canada infrastructure construction market by 2031?
The sector is expected to reach USD 208.48 billion by 2031 on a 4.33% CAGR trajectory.
Which segment contributes the largest share to national construction value today?
Transportation infrastructure led with 46.30% share in 2025 owing to megaprojects in Toronto, Montréal, and Vancouver.
Where is the fastest provincial growth expected through 2031?
Alberta is projected to expand at a 5.9% CAGR driven by hydrogen hubs, petrochemical builds, and renewable-energy corridors.
Why is retrofit activity accelerating across Canada?
Updated building-performance standards, seismic mandates, and generous municipal grants push owners to pursue deep-energy retrofits that improve efficiency and resilience.
How are hyperscale data centers influencing construction demand?
AI and cloud providers require 100-megawatt campuses, forcing utilities to advance transmission upgrades and creating a surge in high-voltage electrical and fiber projects.
Page last updated on:


