Market Overview
| Study Period | 2017 - 2029 |
|---|---|
| Forecast Data Period | 2025 - 2029 |
| Historical Data Period | 2017 - 2023 |
| Market Size (2025) | USD 174.3 Billion |
| Market Size (2029) | USD 222.1 Billion |
| Growth Rate (2025 - 2029) | 6.25% CAGR |
| Market Concentration | High |
Major Players*Disclaimer: Major Players sorted in no particular order Image © Mordor Intelligence. Reuse requires attribution under CC BY 4.0. | |

United States Commercial Vehicles Market Analysis by Mordor Intelligence
The United States Commercial Vehicles Market size is estimated at 174.3 billion USD in 2025, and is expected to reach 222.1 billion USD by 2029, growing at a CAGR of 6.25% during the forecast period (2025-2029).
The United States commercial vehicle industry is experiencing significant transformation driven by evolving supply chain dynamics and technological advancements. Major industry players are restructuring their operations to accommodate changing market demands and enhance operational efficiency. This is evidenced by Ford Motor Company's dominant position, commanding a 30.04% market share in 2023, demonstrating the importance of strategic positioning and robust distribution networks. Manufacturing facilities across the country are being modernized to incorporate advanced production techniques and automation, enabling greater flexibility in response to market demands. The industry's evolution is further characterized by strategic partnerships and collaborations among manufacturers, suppliers, and technology providers to strengthen their market presence and technological capabilities.
The transition towards sustainable transportation solutions is reshaping the commercial vehicle landscape, with manufacturers increasingly focusing on commercial vehicle development, particularly in the electric and hybrid vehicle sectors. The infrastructure supporting this transition has seen remarkable growth, with the number of publicly available charging stations reaching 128,000 in 2022, marking a significant milestone in the industry's electrification journey. Vehicle manufacturers are accelerating their commercial electric vehicle programs, introducing new models and variants to meet diverse commercial requirements. This shift is accompanied by substantial investments in research and development, particularly in battery technology and powertrain systems, to enhance vehicle performance and operational efficiency.
The industry is witnessing a notable transformation in manufacturing processes and technology integration. Advanced manufacturing techniques, including robotics and artificial intelligence, are being implemented to improve production efficiency and product quality. The logistics and supply chain infrastructure has demonstrated robust performance, with the United States achieving a Logistics Performance Index score of 4.63 in 2023, reflecting the country's strong capabilities in transportation and distribution networks. This enhancement in logistics efficiency is crucial for supporting the growing demands of e-commerce and last-mile delivery services.
Technological innovation continues to drive industry advancement, particularly in vehicle electrification and alternative fuel technologies. The significant reduction in battery pack prices, which have declined by approximately 80% since 2010, has made commercial electric vehicles increasingly competitive with traditional internal combustion engine vehicles. Manufacturers are investing heavily in developing next-generation powertrains and advanced driver assistance systems. The integration of connected vehicle technologies and telematics solutions is enabling commercial fleet operators to optimize their operations, improve vehicle utilization, and reduce operational costs. These technological advancements are fundamentally changing how commercial vehicles are designed, manufactured, and operated, setting new standards for efficiency and sustainability in the industry.
United States Commercial Vehicles Market Trends and Insights
Rapid growth in electric vehicle sales driven by government initiatives and increasing demand in the US
- The United States has witnessed a significant surge in the adoption of electric vehicles (EVs) in recent years. This uptick can be attributed to a heightened awareness of EVs, growing environmental concerns, and the implementation of government regulations. Notably, in 2016, California introduced the Zero-Emission Vehicle (ZEV) program aimed at curbing carbon emissions and improving air quality. This initiative has not only spurred the growth of electric cars within California but has also influenced other states to adopt similar ZEV regulations. Consequently, the nation saw a remarkable 634% surge in demand for battery electric vehicles (BEVs) from 2017 to 2022.
- The demand for electric commercial vehicles in the United States is also on the rise. Factors such as the booming e-commerce industry, increased logistics activities, and governmental initiatives for cleaner transportation have fueled this growth. In a significant move, the governor of New York signed the Advanced Clean Truck (ACT) Rule in September 2021. This rule sets a target for all new light-duty vehicles to be zero-emission by 2035 and the same for medium- and heavy-duty vehicles by 2045. As a result, the United States witnessed a 21% surge in demand for electric commercial vehicles in 2022 compared to the previous year.
- Governmental efforts, including rebates, subsidies, and strategic plans, are further bolstering the electrification of vehicles nationwide. In May 2022, President Biden unveiled a USD 3 billion plan to expedite domestic battery manufacturing, with the aim of transitioning gas-powered vehicles to electric ones. This push is expected to significantly boost electric mobility in the country, particularly during 2024-2030, thereby amplifying the demand for battery packs.


OTHER KEY INDUSTRY TRENDS COVERED IN THE REPORT
- The US population continues to grow steadily, driven by immigration and economic opportunities that require strategic planning
- The CVP is expected to experience consistent growth, driven by technological advancements, a focus on sustainable transportation, and the US's commitment to automotive innovation and reducing carbon emissions
- The recent US auto interest rate of 3.6% reflects fluctuations influenced by monetary policies, credit demand, and economic conditions, with a modest increase indicating optimism in the post-pandemic recovery
- Decreasing battery pack prices and government initiatives drive the US electric vehicle market
- Historically, the US's LPI score peaked at 3.99 and settled at 3.89. In 2023, it dropped to 3.8, ranking 17th globally. Despite slight declines, the US remains strong in logistics, especially in tracking and tracing.
- The United States remained a net crude oil importer, importing about 6.28 million bpd from 80 countries
- The US exhibits remarkable economic resilience and growth, driven by factors like robust financial markets, technological advancements, and adaptable policies
- The United States grapples with fluctuating inflation but aims for stability for long-term economic leadership
- The United States achieved a milestone of 128,000 EV Charging Stations in 2022, and the country is poised for continued growth in green mobility
- Rising demand and strategic product launches drive the electric vehicle market in the US.
- The United States remained a net crude oil importer in 2022, importing about 6.28 million bpd of crude oil from 80 countries
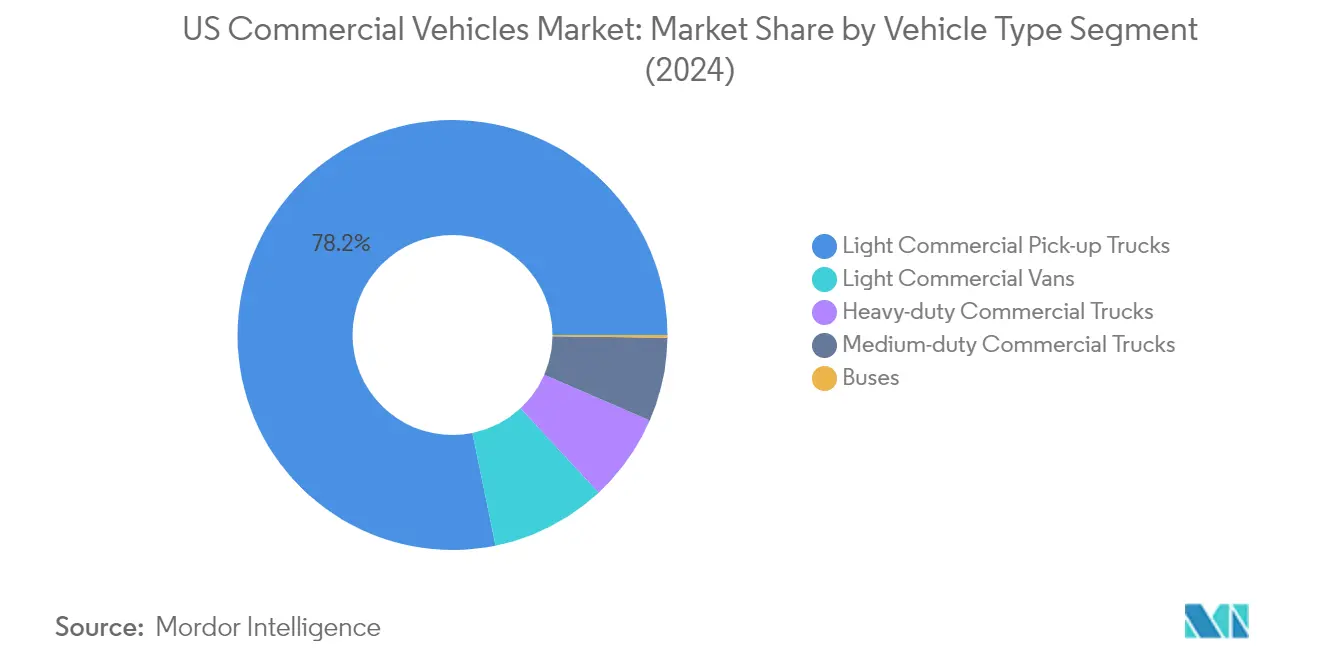
Segment Analysis: Vehicle Type
Light Commercial Pick-up Trucks Segment in US Commercial Vehicles Market
Light commercial pick-up trucks dominate the US commercial vehicles market, commanding approximately 78% market share in 2024. This substantial market presence is attributed to their versatility in serving diverse business needs, from construction and agriculture to last-mile delivery services. The segment's strong performance is supported by technological advancements in fuel efficiency, enhanced payload capacities, and the integration of advanced safety features. Additionally, the growing e-commerce sector and increasing demand for flexible transportation solutions have further cemented the position of light commercial pick-up trucks as the preferred choice for businesses across various industries.

Buses Segment in US Commercial Vehicles Market
The commercial buses segment is emerging as the fastest-growing category in the US commercial vehicles market, with projections indicating robust growth between 2024 and 2029. This growth is primarily driven by increasing investments in public transportation infrastructure, a growing emphasis on sustainable mobility solutions, and rising demand for electric buses in urban areas. The segment is witnessing significant technological advancements, particularly in electric and hybrid powertrains, making buses more environmentally friendly and cost-effective for operators. Furthermore, government initiatives promoting clean public transportation and the expansion of intercity bus services are contributing to the segment's accelerated growth trajectory.
Remaining Segments in Vehicle Type
The other segments in the US commercial vehicles market include light commercial vans, medium-duty commercial trucks, and heavy-duty commercial trucks, each serving distinct market needs. Light commercial vans are particularly crucial for urban logistics and delivery services, offering maneuverability and efficiency in congested city environments. Medium-duty commercial trucks serve as versatile workhorses for regional distribution and specialized applications, while heavy-duty commercial trucks are essential for long-haul transportation and heavy cargo vehicle movement. These segments collectively contribute to the market's diversity and cater to specific industry requirements, from local delivery services to interstate freight transportation.
Segment Analysis: Propulsion Type
ICE Segment in US Commercial Vehicles Market
Internal Combustion Engine (ICE) vehicles continue to dominate the US commercial vehicles market, commanding approximately 93% market share in 2024. This substantial market presence is primarily driven by the widespread availability of refueling infrastructure, lower upfront costs compared to alternative powertrains, and the proven reliability of ICE technology in commercial applications. The segment's strength is particularly evident in heavy-duty applications where traditional diesel engines remain the preferred choice for long-haul transportation. Gasoline-powered vehicles represent the largest sub-segment within ICE, particularly popular in light commercial vehicles and urban delivery applications, while diesel engines maintain their stronghold in the medium and heavy-duty segments.
BEV Segment in US Commercial Vehicles Market
The Battery Electric Vehicle (BEV) segment is emerging as the fastest-growing propulsion type in the US commercial vehicles market, driven by increasing environmental regulations and corporate sustainability goals. The segment is projected to experience substantial growth between 2024 and 2029, supported by expanding charging infrastructure and technological advancements in battery technology. This growth is further accelerated by government incentives and the increasing focus on reducing operational costs in commercial fleets. Fleet operators are increasingly recognizing the total cost of ownership benefits of BEVs, particularly in urban delivery and regional haul applications where predictable routes and regular charging opportunities make electric vehicles an increasingly viable option.
Remaining Segments in Propulsion Type
The remaining propulsion segments, including Hybrid Electric Vehicles (HEV), Plug-in Hybrid Electric Vehicles (PHEV), and Fuel Cell Electric Vehicles (FCEV), each play unique roles in the market's transition towards cleaner transportation. HEVs offer a bridge technology that combines the benefits of electric propulsion with the convenience of traditional fueling infrastructure. PHEVs provide flexibility with their ability to operate in both electric and conventional modes, making them particularly suitable for varied commercial applications. FCEVs, while currently in early adoption phases, show promise for long-haul applications where quick refueling and extended range capabilities are crucial.
Competitive Landscape
Top Companies in United States Commercial Vehicles Market
The commercial vehicles market in the United States is characterized by intense competition and continuous innovation among major players. Companies are heavily investing in electric and autonomous vehicle technologies, with a particular focus on developing zero-emission commercial vehicles and advanced driver assistance systems. Strategic partnerships have become increasingly common, especially for developing charging infrastructure and battery technology. Manufacturers are expanding their production facilities and modernizing existing plants to accommodate new electric vehicle models and meet growing demand. Research and development efforts are concentrated on improving fuel efficiency, reducing emissions, and enhancing vehicle connectivity. Companies are also strengthening their aftermarket services and dealer networks to provide comprehensive support to fleet customers. The industry is witnessing a significant shift towards sustainable mobility solutions, with manufacturers introducing hybrid and electric variants across their commercial vehicle portfolios.
Consolidated Market Led By Global Players
The United States commercial vehicle industry exhibits a high level of consolidation, with established global automotive manufacturers dominating the landscape. Traditional automotive giants maintain their market positions through extensive manufacturing capabilities, well-established distribution networks, and strong brand recognition. These companies leverage their global presence and technological expertise to maintain competitive advantages in the domestic market. The industry has witnessed several strategic mergers and acquisitions, particularly focused on acquiring electric vehicle technology capabilities and strengthening market presence. Local manufacturers often collaborate with global players to enhance their technological capabilities and expand their market reach.
The market structure favors large-scale operations, with major players benefiting from economies of scale and vertical integration. Companies with diverse product portfolios spanning different vehicle segments and fuel types hold significant commercial vehicle market share advantages. The competitive dynamics are influenced by long-standing relationships with fleet operators and the ability to provide comprehensive vehicle lifecycle solutions. Market leaders continuously invest in expanding their production capacity and upgrading facilities to maintain their competitive edge. The industry also sees collaboration between traditional vehicle manufacturers and technology companies to develop next-generation commercial vehicles.
Innovation and Sustainability Drive Future Success
Success in the commercial vehicles market increasingly depends on companies' ability to innovate and adapt to changing market demands. Manufacturers must focus on developing advanced propulsion technologies, particularly in electric and hydrogen fuel cell vehicles, to maintain market relevance. Building strong relationships with fleet operators and providing comprehensive fleet management solutions has become crucial for market success. Companies need to invest in digital technologies and connected vehicle solutions to enhance their value proposition. The ability to provide flexible financing options and comprehensive after-sales support also plays a vital role in maintaining market position. Manufacturers must balance traditional vehicle offerings with new technology investments to ensure sustainable growth.
Future market success will require companies to navigate complex regulatory requirements while meeting customer demands for sustainable transportation solutions. Manufacturers need to develop robust supply chains and establish strategic partnerships to secure critical components, particularly for electric vehicles. Companies must also focus on building charging infrastructure and providing comprehensive charging solutions to support the adoption of electric commercial vehicles. The ability to offer competitive total cost of ownership while maintaining product quality will be crucial for market success. Manufacturers need to maintain flexibility in their production systems to respond quickly to changing market demands and regulatory requirements. Investment in research and development capabilities and maintaining strong relationships with technology partners will be essential for long-term success in the market.
United States Commercial Vehicles Industry Leaders
Daimler AG (Mercedes-Benz AG)
Ford Motor Company
General Motors Company
Ram Trucking, Inc.
Toyota Motor Corporation
- *Disclaimer: Major Players sorted in no particular order


Recent Industry Developments
- August 2023: General Motors is expected to launch an all-electric Cadillac Escalade in late 2024.
- August 2023: General Motors doubled down on plans for an electric future in the Middle East.
- August 2023: Toyota Kirloskar Motor launched the MPV Vellfire strong hybrid electric vehicle (SHEV) for a starting price of INR 11.99 million and going to INR 12.99 million.


United States Commercial Vehicles Market Report Scope
Commercial Vehicles are covered as segments by Vehicle Type. Hybrid and Electric Vehicles, ICE are covered as segments by Propulsion Type.Vehicle Type
| Commercial Vehicles | Buses |
| Heavy-duty Commercial Trucks | |
| Light Commercial Pick-up Trucks | |
| Light Commercial Vans | |
| Medium-duty Commercial Trucks |
Propulsion Type
| Hybrid and Electric Vehicles | By Fuel Category | BEV |
| FCEV | ||
| HEV | ||
| PHEV | ||
| ICE | By Fuel Category | CNG |
| Diesel | ||
| Gasoline | ||
| LPG |
| Vehicle Type | Commercial Vehicles | Buses | |
| Heavy-duty Commercial Trucks | |||
| Light Commercial Pick-up Trucks | |||
| Light Commercial Vans | |||
| Medium-duty Commercial Trucks | |||
| Propulsion Type | Hybrid and Electric Vehicles | By Fuel Category | BEV |
| FCEV | |||
| HEV | |||
| PHEV | |||
| ICE | By Fuel Category | CNG | |
| Diesel | |||
| Gasoline | |||
| LPG | |||


Market Definition
- Vehicle Type - The category covers light, medium, and heavy duty commercial vehicle.
- Vehicle Body Type - This includes Light Commercial Pick-up Trucks, Light Commercial Vans, Medium-duty Commercial Trucks, Heavy-duty Commercial Trucks, and Medium and Heavy Duty Buses.
- Fuel Category - The category includes various fuel types such as Gasoline, Diesel, LPG (Liquefied Petroleum Gas), CNG (Compressed Natural Gas), HEV (Hybrid Electric Vehicles), PHEV (Plug-in Hybrid Electric Vehicles), BEV (Battery Electric Vehicles), and FCEV (Fuel Cell Electric Vehicles)
| Keyword | Definition |
|---|---|
| Electric Vehicle (EV) | A vehicle which uses one or more electric motors for propulsion. Includes cars, buses, and trucks. This term includes all-electric vehicles or battery electric vehicles and plug-in hybrid electric vehicles. |
| BEV | A BEV relies completely on a battery and a motor for propulsion. The battery in the vehicle must be charged by plugging it into an outlet or public charging station. BEVs do not have an ICE and hence are pollution-free. They have a low cost of operation and reduced engine noise as compared to conventional fuel engines. However, they have a shorter range and higher prices than their equivalent gasoline models. |
| PEV | A plug-in electric vehicle is an electric vehicle that can be externally charged and generally includes all-electric vehicles as well as plug-in hybrids. |
| Plug-in Hybrid EV | A vehicle that can be powered either by an ICE or an electric motor. In contrast to normal hybrid EVs, they can be charged externally. |
| Internal combustion engine | An engine in which the burning of fuels occurs in a confined space called a combustion chamber. Usually run with gasoline/petrol or diesel. |
| Hybrid EV | A vehicle powered by an ICE in combination with one or more electric motors that use energy stored in batteries. These are continually recharged with power from the ICE and regenerative braking. |
| Commercial Vehicles | Commercial vehicles are motorized road vehicles designed for transporting people or goods. The category includes light commercial vehicles (LCVs) and medium and heavy-duty vehicles (M&HCV). |
| Passenger Vehicles | Passenger cars are electric motor– or engine-driven vehicles with at least four wheels. These vehicles are used for the transport of passengers and comprise no more than eight seats in addition to the driver’s seat. |
| Light Commercial Vehicles | Commercial vehicles that weigh less than 6,000 lb (Class 1) and in the range of 6,001–10,000 lb (Class 2) are covered under this category. |
| M&HDT | Commercial vehicles that weigh in the range of 10,001–14,000 lb (Class 3), 14,001–16,000 lb (Class 4), 16,001–19,500 lb (Class 5), 19,501–26,000 lb (Class 6), 26,001–33,000 lb (Class 7) and above 33,001 lb (Class 8) are covered under this category. |
| Bus | A mode of transportation that typically refers to a large vehicle designed to carry passengers over long distances. This includes transit bus, school bus, shuttle bus, and trolleybuses. |
| Diesel | It includes vehicles that use diesel as their primary fuel. A diesel engine vehicle have a compression-ignited injection system rather than the spark-ignited system used by most gasoline vehicles. In such vehicles, fuel is injected into the combustion chamber and ignited by the high temperature achieved when gas is greatly compressed. |
| Gasoline | It includes vehicles that use gas/petrol as their primary fuel. A gasoline car typically uses a spark-ignited internal combustion engine. In such vehicles, fuel is injected into either the intake manifold or the combustion chamber, where it is combined with air, and the air/fuel mixture is ignited by the spark from a spark plug. |
| LPG | It includes vehicles that use LPG as their primary fuel. Both dedicated and bi-fuel LPG vehicles are considered under the scope of the study. |
| CNG | It includes vehicles that use CNG as their primary fuel. These are vehicles that operate like gasoline-powered vehicles with spark-ignited internal combustion engines. |
| HEV | All the electric vehicles that use batteries and an internal combustion engine (ICE) as their primary source for propulsion are considered under this category. HEVs generally use a diesel-electric powertrain and are also known as hybrid diesel-electric vehicles. An HEV converts the vehicle momentum (kinetic energy) into electricity that recharges the battery when the vehicle slows down or stops. The battery of HEV cannot be charged using plug-in devices. |
| PHEV | PHEVs are powered by a battery as well as an ICE. The battery can be charged through either regenerative breaking using the ICE or by plugging into some external charging source. PHEVs have a better range than BEVs but are comparatively less eco-friendly. |
| Hatchback | These are compact-sized cars with a hatch-type door provided at the rear end. |
| Sedan | These are usually two- or four-door passenger cars, with a separate area provided at the rear end for luggage. |
| SUV | Popularly known as SUVs, these cars come with four-wheel drive, and usually have high ground clearance. These cars can also be used as off-road vehicles. |
| MPV | These are multi-purpose vehicles (also called minivans) designed to carry a larger number of passengers. They carry between five and seven people and have room for luggage too. They are usually taller than the average family saloon car, to provide greater headroom and ease of access, and they are usually front-wheel drive. |


Research Methodology
Mordor Intelligence follows a four-step methodology in all its reports.
- Step-1: Identify Key Variables: To build a robust forecasting methodology, the variables and factors identified in Step-1 are tested against available historical market numbers. Through an iterative process, the variables required for market forecast are set and the model is built based on these variables.
- Step-2: Build a Market Model: Market-size estimations for the historical and forecast years have been provided in revenue and volume terms. Market revenue is calculated by multiplying the sales volume with their respective average selling price (ASP). While estimating ASP factors like average inflation, market demand shift, manufacturing cost, technological advancement, and varying consumer preference, among others have been taken into account.
- Step-3: Validate and Finalize: In this important step, all market numbers, variables, and analyst calls are validated through an extensive network of primary research experts from the market studied. The respondents are selected across levels and functions to generate a holistic picture of the market studied.
- Step-4: Research Outputs: Syndicated Reports, Custom Consulting Assignments, Databases & Subscription Platforms.


