Market Overview
| Study Period | 2018 - 2031 |
|---|---|
| Forecast Data Period | 2026 - 2031 |
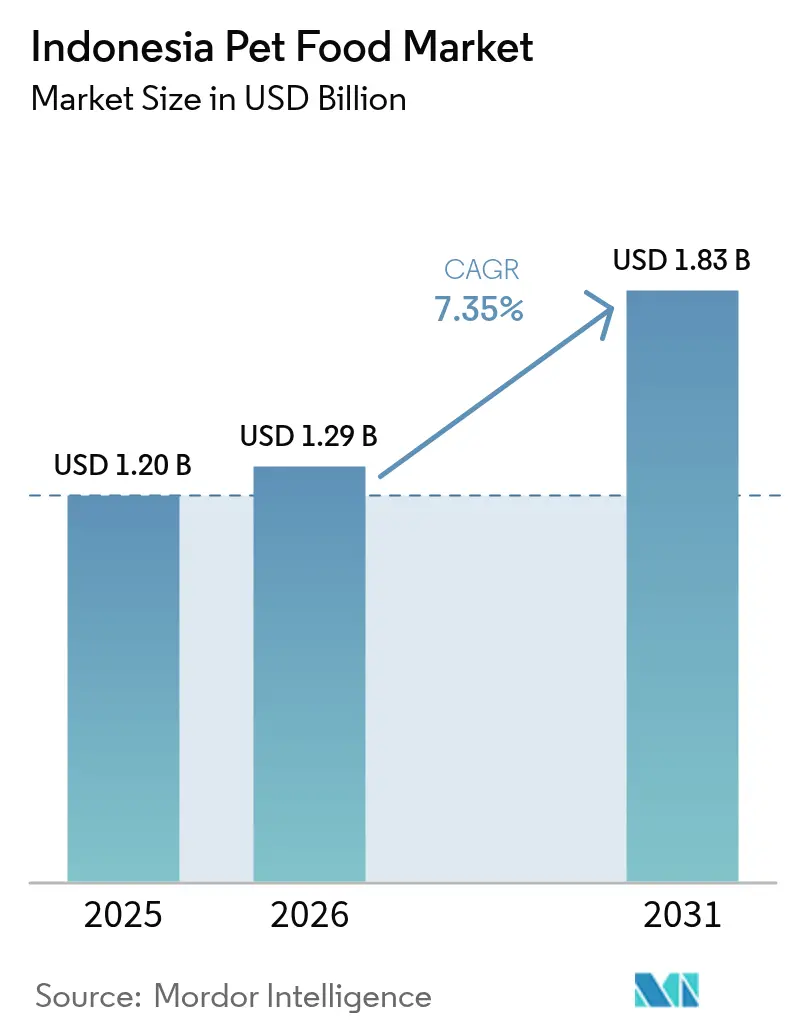
| Base Year Market Size (2025) | USD 1.20 Billion |
| Market Size (2026) | USD 1.29 Billion |
| Market Size (2031) | USD 1.83 Billion |
| Growth Rate (2026 - 2031) | 7.35% CAGR |
| Market Concentration | Medium |
Major Players*Disclaimer: Major Players sorted in no particular order Image © Mordor Intelligence. Reuse requires attribution under CC BY 4.0. | |
Indonesia Pet Food Market Analysis by Mordor Intelligence
The Indonesian pet food market size was valued at USD 1.20 billion in 2025 and estimated to grow from USD 1.29 billion in 2026 to reach USD 1.83 billion by 2031, at a CAGR of 7.35% during the forecast period (2026-2031). Healthy household income growth, a visible shift toward pet humanization, and accelerating e-commerce adoption collectively strengthen demand, while stringent halal certification rules reshape production strategies. Food products remain the core revenue engine, yet functional nutraceuticals quickly expand as owners prioritize preventive care. Java maintains its leadership position due to its dense urban population and superior logistics infrastructure, although Sumatra and Kalimantan are becoming increasingly attractive expansion corridors. Competitive intensity persists as multinational leaders deepen local manufacturing footprints and nimble Indonesian producers capitalize on price-sensitive segments, leaving room for differentiated propositions across price tiers.
Key Report Takeaways
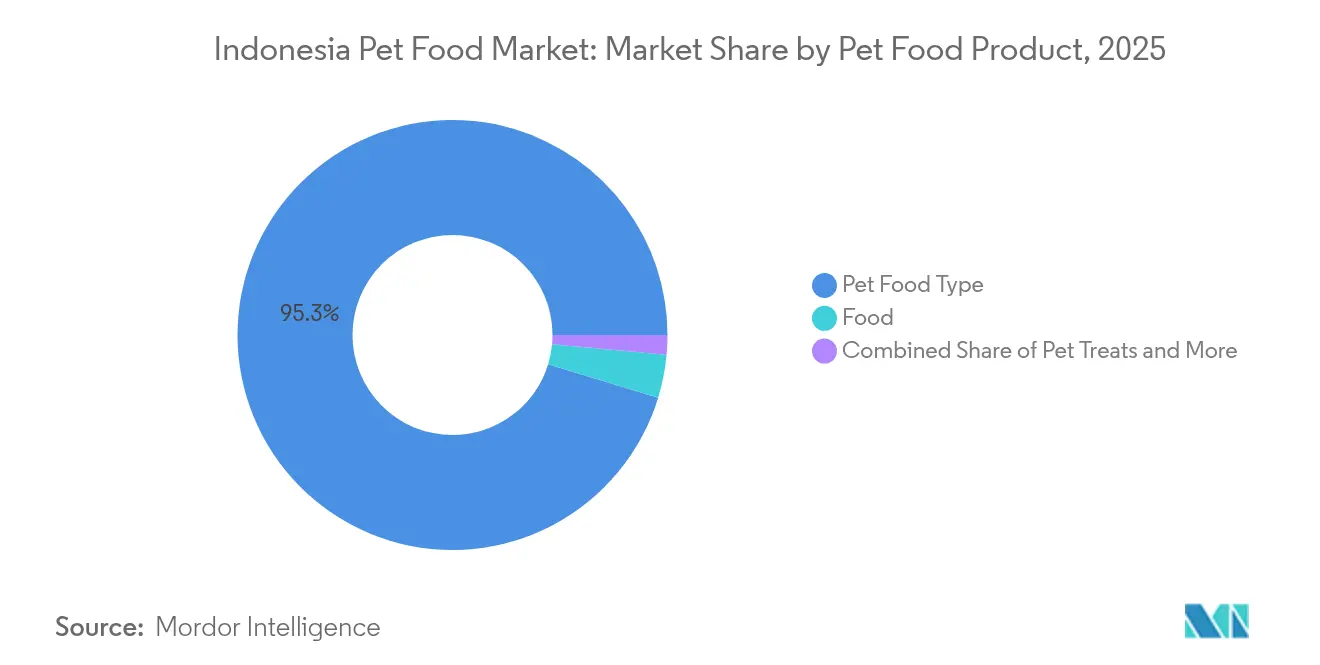
- By product category, food held 68.85% of the Indonesia pet food market share in 2025. Whereas, pet nutraceuticals are projected to post a 10.10% CAGR through 2031.
- By pets, cats captured 65.10% of the Indonesia pet food market size in 2025 and are advancing at an 8.55% CAGR through 2031.
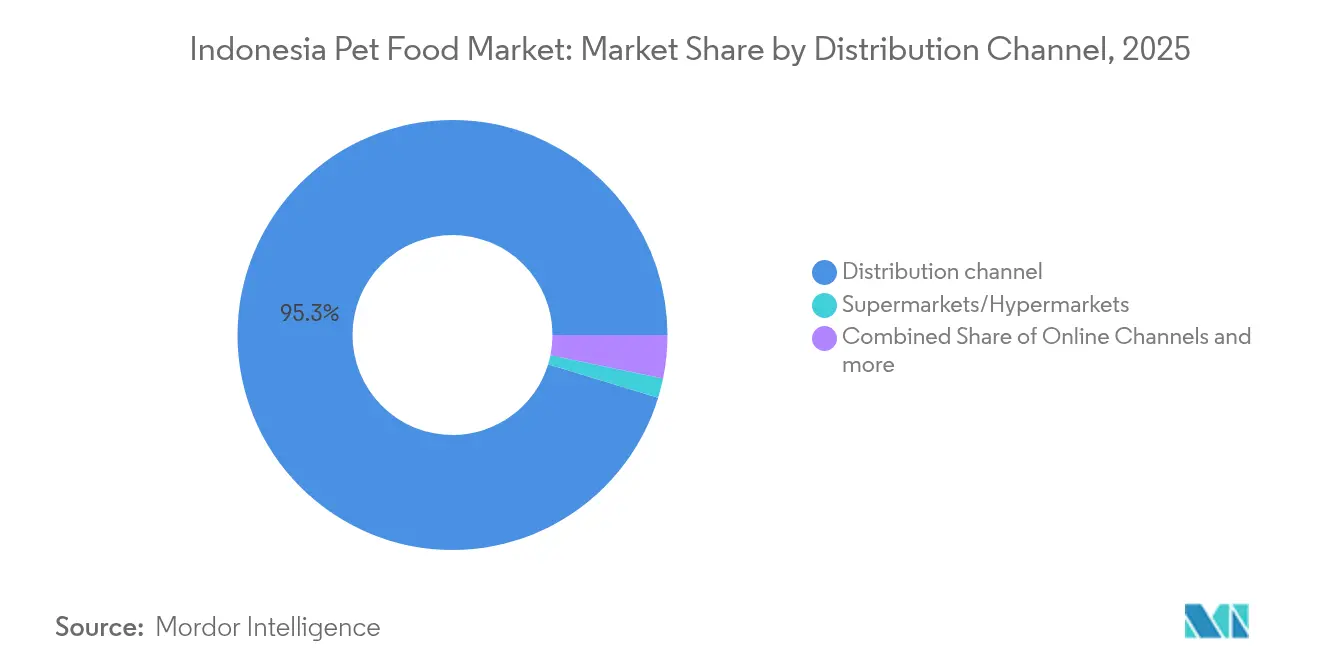
- By distribution channel, supermarkets and hypermarkets commanded a 31.20% share of the Indonesian pet food market in 2025, while online channels recorded the fastest growth at a 9.05% CAGR through 2031.
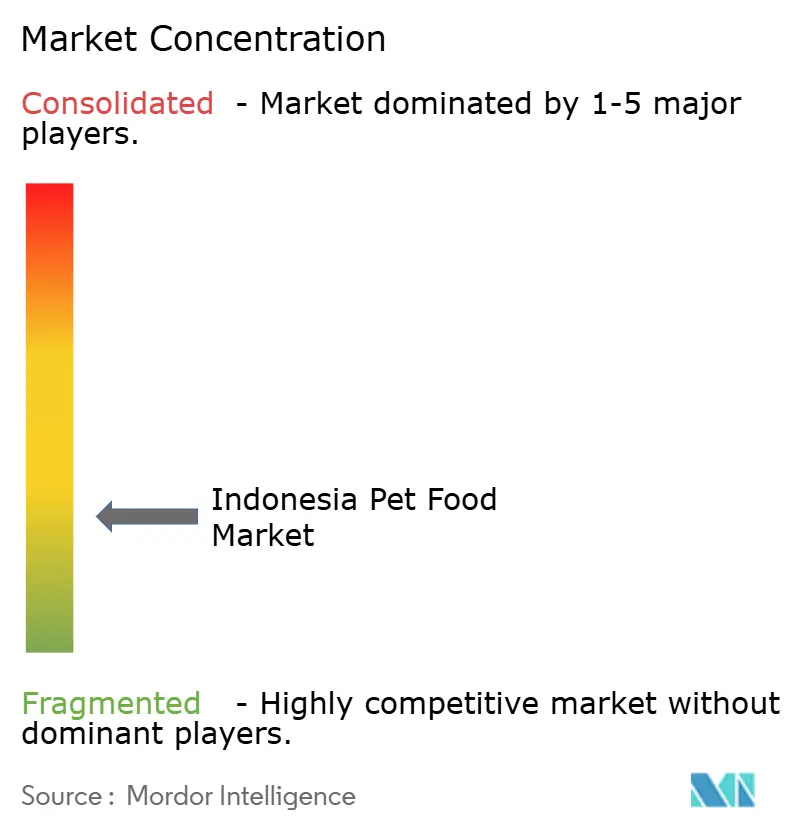
- The Indonesia pet food market is moderately fragmented, with the top five players, including Mars Incorporated, Nestle (Purina), EBOS Group Limited, Farmina Pet Foods, and Hill's Pet Nutrition Inc. (Colgate-Palmolive Company), accounting for a 33.40% market share in 2025.
Note: Market size and forecast figures in this report are generated using Mordor Intelligence’s proprietary estimation framework, updated with the latest available data and insights as of 2026.
Indonesia Pet Food Market Trends and Insights
Drivers Impact Analysis*
| Driver | (~) % Impact on CAGR Forecast | Geographic Relevance | Impact Timeline |
|---|---|---|---|
| Rising disposable income among middle-class pet owners | +2.1% | Java core, spill-over to Sumatra and Kalimantan | Medium term (2-4 years) |
| Pet humanization driving premiumization | +1.8% | Urban centers nationwide | Long term (≥ 4 years) |
| Expansion of e-commerce pet food sales | +1.5% | National | Short term (≤ 2 years) |
| Growing cat population in urban households | +1.2% | Nationwide, concentrated in Java | Medium term (2-4 years) |
| Government incentives lowering ingredient costs | +0.9% | Manufacturing hubs in Java and Sumatra | Long term (≥ 4 years) |
| Halal certification as a purchase differentiator | +0.6% | National, highest in conservative regions | Medium term (2-4 years) |
| Source: Mordor Intelligence | |||


Rising disposable income among middle-class pet owners
Disposable income in households earning more than IDR 7 million (USD 467) monthly expanded by 4.2% annually between 2020 and 2024. The additional spending power moves commercial pet food from a perceived luxury to a routine grocery item, particularly for first-time urban pet parents. Average monthly outlays on nutrition now reach IDR 300,000 (approximately USD 20.00) in Jakarta, far surpassing rural levels. This structural uplift fuels the demand for premium dry kibble, wet food, and functional treats, driving overall volume and value. Financial service firms launched accident and illness cover policies in 2024 that reimburse specialized diets, reinforcing owners' willingness to upgrade formulas. Brands positioned in the upper-mainstream tier benefit the most, as households trade up while still monitoring affordability. The driver remains strongest in Java, yet disposable income gains in the provincial capitals of Sumatra and Kalimantan replicate the pattern over the medium term.
Pet humanization driving premiumization
Urban millennials and Gen Z owners now consider pets as family members, raising expectations for ingredient transparency, life-stage specificity, and functional benefits [1]Source: Indonesian Pet Food Association, “Pet Humanization Trends Report 2024,” ppmhki.org. Human-grade meat proteins, grain-free recipes, and clean-label claims transition from niche to mainstream shelf presence. The mindset shift manifests in social media purchasing decisions, with viral product reviews on Instagram and TikTok accelerating brand discovery. Veterinarians amplify the trend through wellness education that links balanced diets with disease prevention, reinforcing demand for scientifically backed lines. As perceptions shift from “feed” to “nutrition,” unit prices rise while owners opt for smaller pack sizes to manage their budgets. Premiumization also prompts manufacturers to invest in halo claims, such as sustainably sourced fishmeal and responsibly farmed poultry, thereby enhancing brand equity among affluent buyers.
Expansion of e-commerce pet food sales
Indonesia’s digital marketplace has surpassed 200 million active users, and pet food ranks among the fastest-growing consumer categories on Tokopedia, Shopee, and Blibli [2]Source: Indonesian E-commerce Association, “Digital Commerce Growth Report 2024,” idea.or.id. Flash-sale events during Harbolnas drive surge days where volume spikes 30–40% compared with weekly averages. Direct-to-consumer (DTC) storefronts enable multinational brands to bypass traditional importers, offering competitive pricing and a wider range of SKU listings. Subscription services bundle auto-replenishment, loyalty points, and free delivery, improving customer retention for bulk dry kibble. Rural buyers in outer islands leverage e-commerce to source premium goods previously unavailable in local stores, partially offsetting the cold-chain hurdles for wet food through the use of insulated packaging. Online marketplaces also serve as data engines, informing manufacturers about flavor preferences and consumption frequency to tailor new product development.
Growing cat population in urban households
Cats replace dogs as the preferred companion in densely populated apartments that limit pet size and daily exercise options. Household cat ownership rose in Jakarta, lifting demand for specialized indoor formulas, hairball control solutions, and odor management diets. Multiple-cat households are becoming increasingly common, driving the demand for bulk pack formats and necessitating cost-effective yet nutrient-dense recipes. Global and local brands expand their product lines to cater to life-stage and breed-specific nutrition, capturing incremental shelf space in specialty stores. Veterinarian endorsements emphasize the importance of balanced feline diets in preventing urinary tract disease, thereby reinforcing the importance of owner education. The segment’s momentum spills into premium wet pouches as disposable incomes rise and cold-chain coverage widens in tier-one cities.
Restraints Impact Analysis*
| Restraint | (~) % Impact on CAGR Forecast | Geographic Relevance | Impact Timeline |
|---|---|---|---|
| Price sensitivity among lower-income owners | -1.4% | Rural areas and price-conscious urban districts | Short term (≤ 2 years) |
| Limited cold-chain beyond tier-1 cities | -0.8% | Outer islands and secondary urban centers | Medium term (2-4 years) |
| Volatile domestic fishmeal and poultry by-product supply | -0.6% | National manufacturing footprint | Short term (≤ 2 years) |
| Sustainability-driven reformulation costs | -0.4% | Premium segment producers nationwide | Long term (≥ 4 years) |
| Source: Mordor Intelligence | |||
Price sensitivity among lower-income owners
Owners often supplement their diets with table scraps or low-protein home-cooked meals, which can dampen the uptake of premium products. Local brands attempt to defend share via economy kibble containing regional carbohydrate fillers, but margins remain thin. Promotional bundling during Ramadan and school holidays temporarily boosts off-take, however, sustainable penetration requires further cost relief. Mobile payment discounts and sachet-size packaging show promise for gradually onboarding budget-constrained households into regular purchasing cycles.
Limited cold-chain beyond tier-1 cities
Indonesia’s archipelago spans 17,000 islands, yet modern refrigerated logistics remain clustered in Greater Jakarta, Surabaya, and Bandung. Traveling to Sumatra, Kalimantan, or the eastern provinces often takes several days without temperature control, which can lead to spoilage of wet pouches and frozen diets. Retailers minimize exposure by stocking mainly dry kibble in peripheral markets, narrowing product diversity. Some manufacturers deploy retort technology to offer shelf-stable wet food, but the taste profiles often lag behind those of chilled equivalents, which constrains the acceptance of premium products. Cold-chain investment costs stay high due to scattered demand and low backhaul utilization. Third-party logistics players are piloting portable cold rooms and solar-powered refrigeration units, although a national-scale up requires coordinated public and private funding.
*Our forecasts treat driver/restraint impacts as directional, not additive. The impact forecasts reflect baseline growth, mix effects, and variable interactions.
Segment Analysis
By Pet Food Product: Functional innovation widens category value
The food segment accounted for a significant 68.85% share of the Indonesian pet food market in 2025, primarily due to the widespread adoption of dry kibble and the growing presence of wet food in urban areas. The segment offers broad price ladders, enabling participation from economy to ultra-premium tiers, and captures cross-promotions with treats and toppers that lift average basket values. Manufacturers localize flavor palettes with chicken, tuna, and milk-based variants to align with Indonesian taste preferences. Shelf-stable dry offerings benefit from climate resilience, while pet owners in Java are increasingly experimenting with wet pouches as the reliability of cold chains improves. Pet nutraceuticals chart the fastest 10.10% CAGR and progressively reshape perceptions around preventive pet healthcare. Supplements featuring omega-3s, joint support collagen, or probiotic blends ride on veterinarian endorsements that link functional ingredients to tangible health outcomes.
The treats subcategory mirrors human snack trends, with freeze-dried meats and limited-ingredient jerky outperforming classic biscuits. Veterinary diets, although niche in volume, secure high margins and solidify professional channel credibility for multinationals. Domestic producers explore co-manufacturing agreements to tap the rising demand for prescription formulas without undertaking expensive R&D pipelines. Across all product lines, flavor authenticity, palatability, and texture innovation remain recurring themes that sway repeat purchases in the Indonesia pet food market.


By Pet: Cats strengthen their wallet share leadership
Cats accounted for 65.10% of the Indonesian pet food market size in 2025 and are anticipated to maintain an 8.55% CAGR to 2031, reflecting urban apartment living preferences and religious considerations that lower dog ownership in certain provinces. Cat owners display high engagement on social media, frequently sharing feeding rituals and thereby amplifying word-of-mouth brand discovery. Specialty indoor recipes with reduced calorie density address sedentary lifestyles, while hairball control formulas gain traction within multi-cat homes. Dogs still command emotional loyalty, especially among affluent households in peri-urban areas, yet face constraints due to space and time requirements. The “other pets” group, covering birds, fish, and small mammals, presents small but steady consumption pockets that specialty retailers satisfy with niche SKUs.
Growth momentum for cats rests on convenience and affordability. Lower per-unit feeding costs compared to dogs enable owners to allocate savings toward upgraded formulations, sustaining premiumization. Brands leverage feline taste selectivity as a product development testbed, trialing novel proteins such as quail and duck. The Indonesian pet food market thus witnesses intensified innovation cycles in the cat domain, elevating competitive stakes for sustained relevance.
By Distribution Channel: Digital acceleration reshapes retail economics
Supermarkets and hypermarkets captured 31.20% of Indonesia's pet food market share in 2025, owing to established store traffic and in-aisle promotions that educate consumers on product differentiation. Endcap displays and bundled pricing drive impulse purchases on paydays, boosting volume velocity for mainstream SKUs. In contrast, online channels exhibit a 9.05% CAGR, reshaping price transparency and allowing long-tail assortment expansion beyond shelf constraints. The click-and-collect model is gaining acceptance in tier-two cities, where consumers order online but pick up in-store to avoid delivery fees. Specialty stores maintain their relevance by offering veterinary consultations and grooming services, fostering advisory trust that underpins high-ticket sales for therapeutic diets.
Convenience stores meet the emergency demand for small packs, particularly in densely urbanized corridors with round-the-clock foot traffic. As omnichannel strategies mature, brand success hinges on harmonizing pricing and pack formats across physical and digital touchpoints to prevent cannibalization and safeguard margins within the Indonesian pet food market.
Geography Analysis
Java commands the largest market share due to dense urbanization and higher purchasing power. Metropolitan Jakarta alone contributes nearly one-third of national sales, leveraging modern trade penetration and a reliable cold-chain to support premium wet and functional products. Government infrastructure programs further streamline inter-city logistics within Java, shortening lead times and reducing spoilage risk.
In Sumatra, cities such as Medan and Palembang are witnessing the growth of specialty retail clusters that showcase imported super-premium brands. Local ingredient availability, especially corn and poultry by-products, supports cost-efficient manufacturing for regional distribution. E-commerce fills store gaps by delivering dry and shelf-stable wet products, yet high shipping fees impede bulky orders. Sulawesi, Bali, and Nusa Tenggara, as well as Papua and Maluku, have logistics and income constraints that limit assortment. However, long-term tourist development and digital adoption open up gradual opportunities. Through 2031, the expansion of omnichannel services and government-backed transport upgrades will help narrow regional disparities within the Indonesian pet food market.
Competitive Landscape
The Indonesia pet food market is moderately fragmented, with the top five suppliers holding a combined 33.86% share in 2024. Mars leads via Whiskas, Pedigree, and Temptations, leveraging localized manufacturing and multi-price tiers. Nestlé Purina trails with 7.35%, focusing on veterinarian partnerships to promote Purina Pro Plan and Purina ONE. Local firms differentiate through halal compliance, cost-efficient sourcing, and grassroots marketing tied to community pet events.
Multinationals intensify capital expenditure to build extrusion and wet pouch lines inside Java’s industrial parks, trimming import tariffs and currency exposure. ADM’s 2023 acquisition of PT Trouw Nutrition Indonesia exemplifies its strategic push toward vertical integration and control of functional ingredients [3]Source: ADM, “PT Trouw Nutrition Indonesia Acquisition,” adm.com. Digital transformation shapes go-to-market tactics, leading brands to operate flagship stores on Tokopedia and Shopee, mining consumer data to refine new-product development cycles.
As competition escalates, category adjacencies such as treats, dental chews, and nutraceuticals present opportunities for growth. Smaller Indonesian players target underserved rural districts with economy kibble, while super-premium entrants focus on niche wellness claims. Strategic alliances between logistic service providers and manufacturers aim to widen cold-chain footprint, enabling broader wet food distribution and raising barriers to entry.
Indonesia Pet Food Industry Leaders
Colgate-Palmolive Company (Hill's Pet Nutrition Inc.)
EBOS Group Limited
FARMINA PET FOODS
Mars Incorporated
Nestle (Purina)
- *Disclaimer: Major Players sorted in no particular order

Recent Industry Developments
- December 2023: ADM completed the acquisition of PT Trouw Nutrition Indonesia, expanding its animal nutrition capabilities and local manufacturing presence. The acquisition includes feed ingredient production facilities and distribution networks serving the Indonesian pet food industry.
- July 2023: Hill’s Pet Nutrition introduced its new MSC (Marine Stewardship Council) certified pollock and insect protein products for pets. The launch took place at a global level, including the Indonesian market. These products are formulated for pets with sensitive stomachs and skin issues and are enriched with vitamins, omega-3 fatty acids, and antioxidants to support overall health.


Indonesia Pet Food Market Report Scope
Food, Pet Nutraceuticals/Supplements, Pet Treats, and Pet Veterinary Diets are covered as segments by Pet Food Product. Cats and dogs are covered as segments by Pets. And Convenience Stores, Online Channel, Specialty Stores, and Supermarkets/Hypermarkets are covered as segments by the Distribution Channel.
Pet Food Product
| Food | By Sub Product | Dry Pet Food | By Sub Dry Pet Food | Kibbles |
| Other Dry Pet Food | ||||
| Wet Pet Food | ||||
| Pet Nutraceuticals and Supplements | By Sub Product | Milk Bioactives | ||
| Omega-3 Fatty Acids | ||||
| Probiotics | ||||
| Proteins and Peptides | ||||
| Vitamins and Minerals | ||||
| Other Nutraceuticals | ||||
| Pet Treats | By Sub Product | Crunchy Treats | ||
| Dental Treats | ||||
| Freeze-dried and Jerky Treats | ||||
| Soft and Chewy Treats | ||||
| Other Treats | ||||
| Pet Veterinary Diets | By Sub Product | Derma Diets | ||
| Diabetes | ||||
| Digestive Sensitivity | ||||
| Obesity Diets | ||||
| Oral Care Diets | ||||
| Renal | ||||
| Urinary Tract Disease | ||||
| Other Veterinary Diets |
Pets
| Cats |
| Dogs |
| Other Pets |
Distribution Channel
| Convenience Stores |
| Online Channel |
| Specialty Stores |
| Supermarkets/Hypermarkets |
| Other Channels |
| Pet Food Product | Food | By Sub Product | Dry Pet Food | By Sub Dry Pet Food | Kibbles |
| Other Dry Pet Food | |||||
| Wet Pet Food | |||||
| Pet Nutraceuticals and Supplements | By Sub Product | Milk Bioactives | |||
| Omega-3 Fatty Acids | |||||
| Probiotics | |||||
| Proteins and Peptides | |||||
| Vitamins and Minerals | |||||
| Other Nutraceuticals | |||||
| Pet Treats | By Sub Product | Crunchy Treats | |||
| Dental Treats | |||||
| Freeze-dried and Jerky Treats | |||||
| Soft and Chewy Treats | |||||
| Other Treats | |||||
| Pet Veterinary Diets | By Sub Product | Derma Diets | |||
| Diabetes | |||||
| Digestive Sensitivity | |||||
| Obesity Diets | |||||
| Oral Care Diets | |||||
| Renal | |||||
| Urinary Tract Disease | |||||
| Other Veterinary Diets | |||||
| Pets | Cats | ||||
| Dogs | |||||
| Other Pets | |||||
| Distribution Channel | Convenience Stores | ||||
| Online Channel | |||||
| Specialty Stores | |||||
| Supermarkets/Hypermarkets | |||||
| Other Channels | |||||


Market Definition
- FUNCTIONS - Pet foods are usually intended to provide complete and balanced nutrition to the pet but are primarily used as functional products. The scope includes the food and supplements consumed by pets including veterinary diets. Supplements/nutraceuticals that are directly supplied to pets are considered within the scope.
- RESELLERS - Companies engaged in reselling of pet food without value addition have been excluded from the market scope, in order to avoid double counting.
- END CONSUMERS - Pet owners are considered to be the end-consumers in the market studied.
- DISTRIBUTION CHANNELS - Supermarkets/hypermarkets, specialty stores, convenience stores, online channels and other channels are considered within the scope. The stores which are exclusively providing pet related basic and custom products are considered within the scope of specialty stores.
| Keyword | Definition |
|---|---|
| Pet Food | The scope of pet food includes the food that is eatable by pets including food, treats, veterinary diets, and nutraceuticals/supplements. |
| Food | Food is animal feed intended for consumption by pets. It is formulated to provide essential nutrients and meet the dietary needs of various types of pets, including dogs, cats, and other animals. These are generally segmented into dry and wet pet foods. |
| Dry Pet Food | Dry pet foods may be extruded/baked (kibbles) or flaked. They have a lower moisture content, typically around 12-20%. |
| Wet Pet Food | Wet pet food, also known as canned pet food or moist pet food, generally has a higher moisture content compared to dry pet food, often ranging from 70-80%. |
| Kibbles | Kibbles are dry, processed pet food in small, bite-sized pieces or pellets. They are specifically formulated to provide balanced nutrition for various domestic animals, such as dogs, cats, and other animals. |
| Treats | Pet Treats are special food items or rewards given to pets, to show affection, and encourage good behavior. They are especially used during training. Pet treats are made from various combinations of meat or meat-derived materials with other ingredients. |
| Dental Treats | Pet dental treats are specialized treats that are formulated to promote good oral hygiene in pets. |
| Crunchy Treats | It is a type of pet treat that has a firm and crispy texture which can be a good source of nutrition for pets. |
| Soft and chewy treats | Soft and Chewy pet treats are a type of pet food product that is formulated to be easy to chewy and digest. They are usually made from soft and pliable ingredients, such as meat, poultry, or vegetables, that have been blended and formed into bite-sized pieces or strips. |
| Freeze-dried & Jerky Treats | Freeze-dried and jerky treats are snacks given to pets, that are prepared through a special preservation process, without damaging the nutritional content, resulting in long-lasting, nutrient-rich treats. |
| Urinary Tract Disease Diets | These are commercial diets that are specifically formulated to promote urinary health and reduce the risk of urinary tract infections and other urinary problems. |
| Renal Diets | These are specialized pet foods formulated to support the health of pets with kidney disease or renal insufficiency. |
| Digestive Sensitivity Diets | Digestive-sensitive diets are specially formulated to meet the nutritional needs of pets with digestive issues such as food intolerances, allergies, and sensitivities. These diets are designed to be easily digestible and to reduce the symptoms of digestive problems in pets. |
| Oral Care Diets | Oral care diets for pets are specially formulated diets produced to promote oral health and hygiene in pets. |
| Grain-Free Pet Food | Pet food that does not contain common grains like wheat, corn, or soy. Grain-free diets are often preferred by pet owners seeking alternative options or if their pets have specific dietary sensitivities. |
| Premium Pet Food | High-quality pet food formulated with superior ingredients often offers additional nutritional benefits compared to standard pet food. |
| Natural Pet Food | Pet food made from natural ingredients, with minimal processing and without artificial preservatives. |
| Organic Pet Food | Pet food is produced using organic ingredients, free from synthetic pesticides, hormones, and genetically modified organisms (GMOs). |
| Extrusion | A manufacturing process used to produce dry pet food, where ingredients are cooked, mixed, and shaped under high pressure and temperature. |
| Other Pets | Other pets include birds, fish, rabbits, hamsters, ferrets, and reptiles. |
| Palatability | The taste, texture, and aroma of pet food influence its appeal and acceptance by pets. |
| Complete and Balanced Pet Food | Pet food that provides all essential nutrients in appropriate proportions to meet the nutritional needs of pets without additional supplementation. |
| Preservatives | These are the substances that are added to pet food to extend its shelf life and prevent spoilage. |
| Nutraceuticals | Food products that offer health benefits beyond basic nutrition, often contain bioactive compounds with potential therapeutic effects. |
| Probiotics | Live beneficial bacteria that promote a healthy balance of gut flora, supporting digestive health and immune function in pets. |
| Antioxidants | Compounds that help neutralize harmful free radicals in the body, promoting cellular health and supporting the immune system in pets. |
| Shelf-Life | The duration of which pet food remains safe and nutritionally viable for consumption after its production date. |
| Prescription diet | Specialized pet food formulated to address specific medical conditions under veterinary supervision. |
| Allergen | A substance that can cause allergic reactions in some pets, leading to food allergies or sensitivities. |
| Canned food | Wet pet food that is packed in cans and contains higher moisture content than dry food. |
| Limited ingredient diet (LID) | Pet food formulated with a reduced number of ingredients to minimize potential allergens. |
| Guaranteed Analysis | The minimum or maximum levels of certain nutrients present in pet food. |
| Weight management | Pet food designed to help pets maintain a healthy weight or support weight loss efforts. |
| Other Nutraceuticals | It includes prebiotics, antioxidants, digestive fiber, enzymes, essential oils and herbs. |
| Other Veterinary Diets | It includes weight management diets, skin and coat health, cardiac care, and joint care. |
| Other Treats | It includes rawhides, mineral blocks, lickables, and catnips. |
| Other Dry Foods | It includes cereal flakes, mixers, meal toppers, freeze-dried foods, and air-dried foods. |
| Other Animals | It includes birds, fish, reptiles, and small animals (rabbits, ferrets, hamsters). |
| Other Distribution Channels | It includes veterinary clinics, local unregulated stores, and feed and farm stores. |
| Proteins and Peptides | Proteins are large molecules composed of basic units called amino acids which help in the growth and development of pets. Peptides are the short string of 2 to 50 amino acids. |
| Omega-3 fatty acids | Omega-3 fatty acids are essential polyunsaturated fats that play a crucial role in the overall health and well-being of Pets |
| Vitamins | Vitamins are the essential organic compounds that are essential for vital physiological functioning. |
| Minerals | Minerals are naturally occurring inorganic substances that are essential for various physiological functions in pets. |
| CKD | Chronic Kidney Disease |
| DHA | Docosahexaenoic Acid |
| EPA | Eicosapentaenoic Acid |
| ALA | Alpha-linolenic Acid |
| BHA | Butylated Hydroxyanisol |
| BHT | Butylated Hydroxytoluene |
| FLUTD | Feline Lower Urinary Tract Disease |


Research Methodology
Mordor Intelligence follows a four-step methodology in all our reports.
- Step-1: IDENTIFY KEY VARIABLES: In order to build a robust forecasting methodology, the variables and factors identified in Step-1 are tested against available historical market numbers. Through an iterative process, the variables required for market forecast are set and the model is built on the basis of these variables.
- Step-2: Build a Market Model: Market-size estimations for the forecast years are in nominal terms. Inflation is not a part of the pricing, and the average selling price (ASP) is kept constant throughout the forecast period.
- Step-3: Validate and Finalize: In this important step, all market numbers, variables and analyst calls are validated through an extensive network of primary research experts from the market studied. The respondents are selected across levels and functions to generate a holistic picture of the market studied.
- Step-4: Research Outputs: Syndicated Reports, Custom Consulting Assignments, Databases & Subscription Platforms


