Brazil Hyperscale Data Center Market Size and Share
Market Overview
| Study Period | 2019 - 2030 |
|---|---|
| Forecast Data Period | 2025 - 2030 |
| Historical Data Period | 2019 - 2023 |
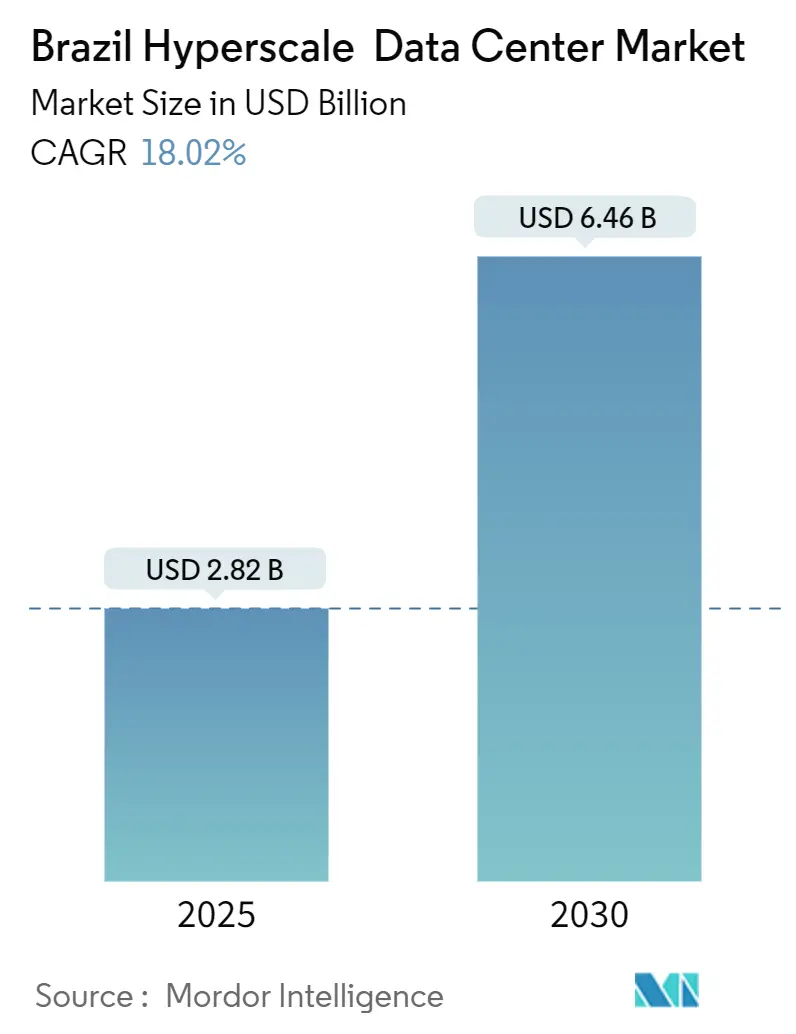
| Market Size (2025) | USD 2.82 Billion |
| Market Size (2030) | USD 6.46 Billion |
| Growth Rate (2025 - 2030) | 18.02% CAGR |
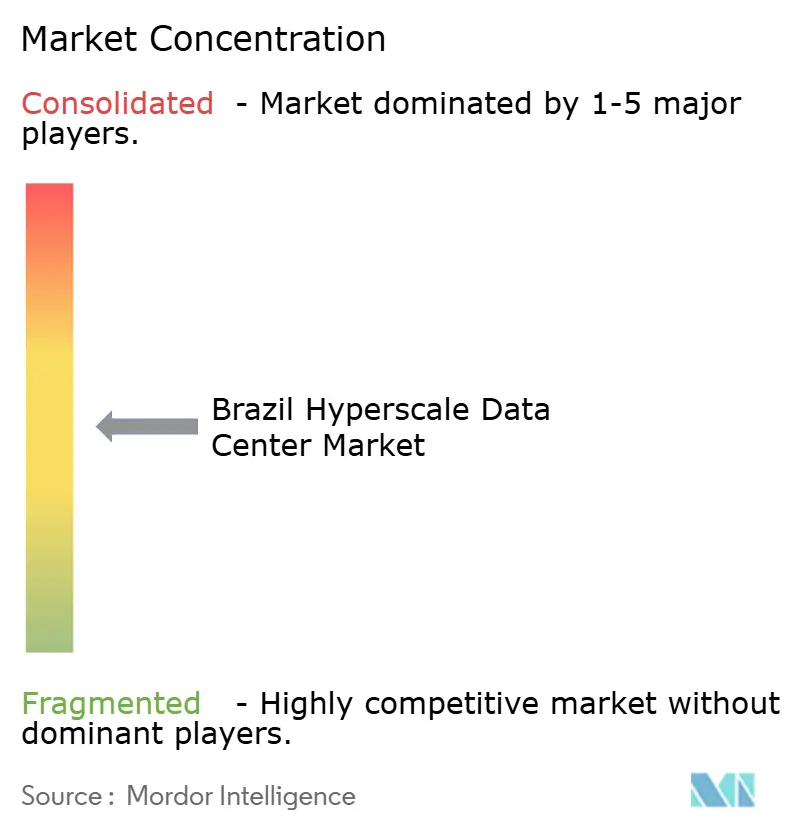
| Market Concentration | Medium |
Major Players *Disclaimer: Major Players sorted in no particular order Image © Mordor Intelligence. Reuse requires attribution under CC BY 4.0. | |
Brazil Hyperscale Data Center Market Analysis by Mordor Intelligence
The Brazil hyperscale data center market size reached USD 2.82 billion in 2025 and is forecast to climb to USD 6.46 billion by 2030, advancing at an 18.02% CAGR through the period. Intensifying demand stems from soaring GPU-centric artificial-intelligence deployments, real-time payment traffic generated by Pix, and government mandates that oblige in-country data processing. The installed IT-load base is expanding from 1.41 thousand MW in 2025 and is forecast to climb to by 2.04 thousand MW by 2030, advancing at an 7.56% CAGR through the period. Liquid-cooled server halls, sovereign-cloud compliance, and renewable-power sourcing emerge as core design principles as operators recalibrate facilities for sustained 50–100 kW rack densities. Competition remains moderate, yet the entry of purpose-built local specialists raises the bar on sustainability, latency, and scale. New fiscal incentives that steer capacity toward Brazil’s Northeast diversify geographic risk while unlocking wind- and solar-rich power corridors. Together, these forces reinforce the Brazil hyperscale data center market as Latin America’s focal point for AI infrastructure investments.
Key Report Takeaways
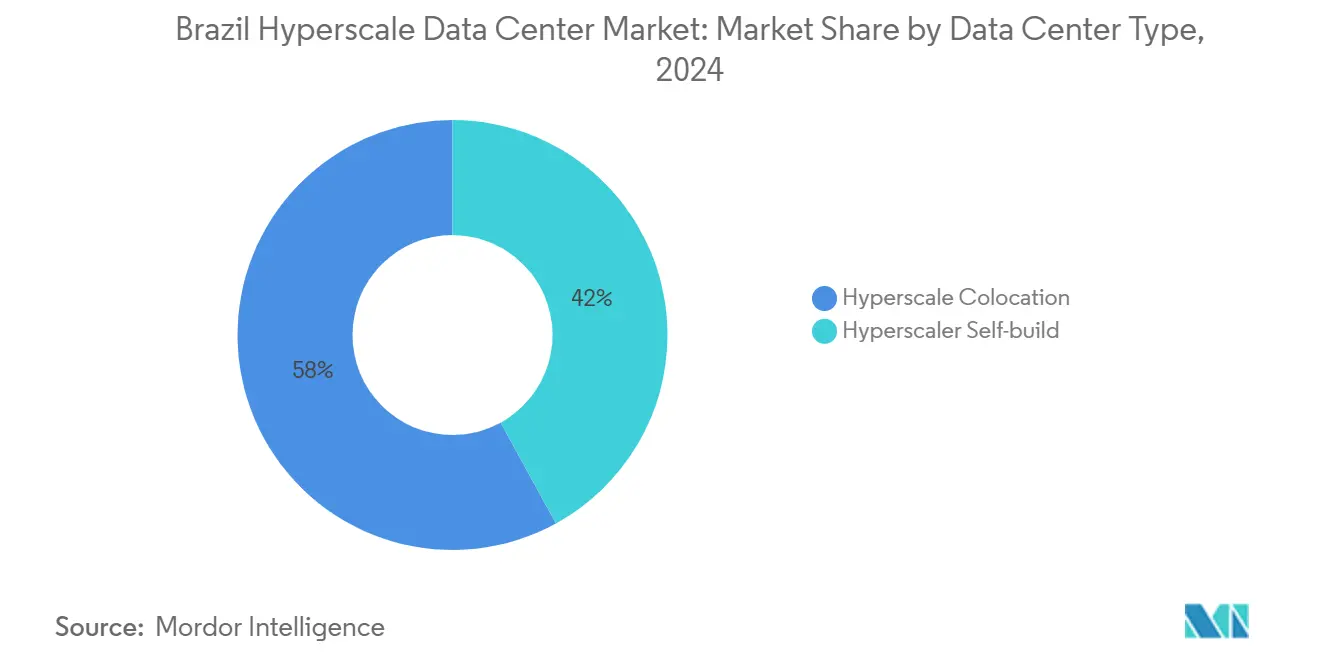
- By data center type, hyperscale colocation led with 58% revenue share in 2024; self-build facilities are forecast to expand at an 18.40% CAGR through 2030.
- By component, liquid-cooling systems commanded 24.68% CAGR growth between 2025 and 2030, the fastest among all infrastructure categories.
- By tier standard, Tier IV facilities accounted for a 19.11% CAGR from 2025 to 2030, outpacing Tier III builds that held 64% of the Brazil hyperscale data center market share in 2024.
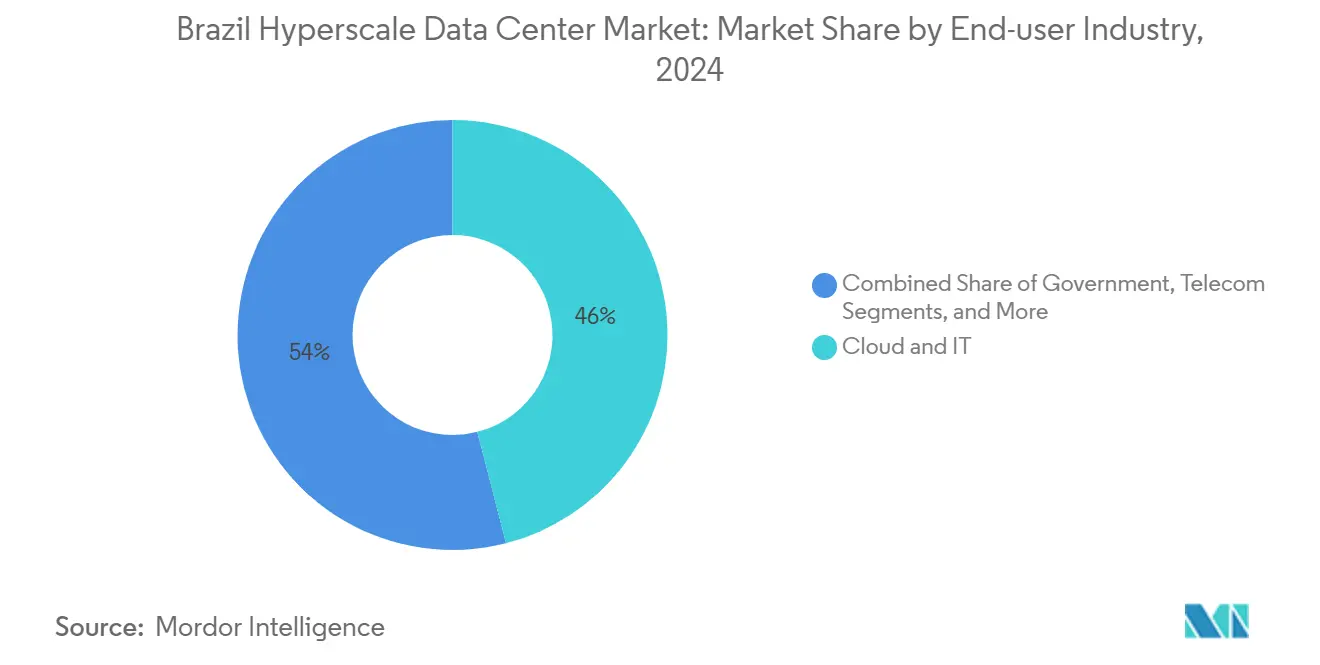
- By end-user industry, AI/ML workloads recorded a 22.49% CAGR between 2025 and 2030, while cloud and IT retained a 46% share of the Brazil hyperscale data center market size in 2024.
- By data center size, mega sites above 60 MW are projected to expand at a 21.01% CAGR to 2030, surpassing massive (25-60 MW) and large facilities.
Market participation spans countries and regions, making Brazil competition one layer within a larger international field. In its global hyperscale data center industry statistics, Mordor Intelligence maps that multi-region structure.
Brazil Hyperscale Data Center Market Trends and Insights
Drivers Impact Analysis*
| Driver | (~) % Impact on CAGR Forecast | Geographic Relevance | Impact Timeline |
|---|---|---|---|
| GPU-centric AI/ML workloads (>50 kW racks) | +4.20% | São Paulo, Rio de Janeiro, Northeast corridors | Medium term (2–4 years) |
| Pix real-time payment mandates | +2.80% | National financial hubs | Short term (≤2 years) |
| Sovereign-cloud and data-residency laws | +3.10% | São Paulo, Brasília, nationwide | Long term (≥4 years) |
| 5G edge–core consolidation | +2.40% | São Paulo, Rio de Janeiro, secondary metros | Medium term (2–4 years) |
| GenAI inference clusters/liquid cooling | +2.90% | Fortaleza, Porto Alegre, primary metros | Medium term (2–4 years) |
| Availability-based PPAs for renewables | +1.80% | National, strongest in Northeast | Long term (≥4 years) |
| Source: Mordor Intelligence | |||
Exploding GPU-centric AI/ML Workloads Drive Infrastructure Transformation
AI training clusters now draw more than 50 kW per rack, far exceeding the 8-12 kW legacy enterprise norm. NVIDIA reports roughly USD 800 million in Brazilian enterprise revenue, illustrating local appetite for high-performance GPUs. Banks alone redirected BRL 1.4 billion each year from CBDC projects into AI hardware, and more than 80% expect to embed generative models in production by 2025. Government supercomputing partnerships with NVIDIA add to that load, demanding liquid-cooled white space that can run sustained 700 W GPUs at scale. Consequently, cooling budgets scale faster than floor space, reinforcing a 24.70% CAGR for liquid-cooling systems in the Brazil hyperscale data center market.
Real-time Payment Infrastructure Demands Sub-millisecond Processing
Pix clears over 3 billion transactions every month and targets 54 billion annual transfers by 2026. Settlement finality within a millisecond pushes operators toward Tier IV redundancy that guarantees 99.995% uptime, driving a 19.10% CAGR in such builds. Financial institutions boosted IT infrastructure spending by 61% in 2024, with 59% earmarked for cloud migration aligned to Pix workloads. Massive alias databases under the DICT registry also pressure storage and compute, making low-latency edge nodes indispensable. The Brazil hyperscale data center market therefore positions Tier IV and edge proximity as competitive differentiators for payment workloads.
Sovereign Cloud Mandates Reshape Hyperscale Location Strategy
Brazil’s 100% sovereign-cloud posture, anchored by Serpro, forces international providers to localize processing to comply with Resolution No. 19/2024. AWS allocated USD 1.8 billion and Microsoft USD 2.7 billion to Brazilian self-build campuses that ensure residency and operational control [1].Angus Berwick, “Data center companies investing in Brazil,” Reuters, reuters.comThe Gov.br platform now supports services for 150 million citizens, solidifying national capacity needs. Renewable-powered sovereign facilities in Brasília set new benchmarks for latency, security, and green sourcing, accelerating the Brazil hyperscale data center market migration into inland federal hubs.
GenAI Inference Clusters Accelerate Liquid-Cooling Adoption
Inference workloads operate GPUs continuously, generating thermal envelopes near 100 kW per rack. Immersion or cold-plate cooling achieves PUE below 1.1 and lowers energy use by 40% compared with hot-aisle containment. CyrusOne’s Intelliscale design, Meta’s global pivot toward liquid cooling, and local fabrication of Delta Cube modules indicate how mainstream these solutions have become. Nearly half of Brazilian hyperscale halls expect to adopt liquid cooling by 2031, raising mechanical infrastructure’s share of the Brazil hyperscale data center market size.
Restraints Impact Analysis*
| Restraint | (~) % Impact on CAGR Forecast | Geographic Relevance | Impact Timeline |
|---|---|---|---|
| Water-usage restrictions on evaporative cooling | -2.10% | Drought-prone Northeast, interior São Paulo | Short term (≤2 years) |
| GPU and optics supply-chain bottlenecks | -1.80% | National | Medium term (2–4 years) |
| Rising carbon-tax and heat-levy proposals | -1.40% | Industrial zones nationwide | Long term (≥4 years) |
| Local-grid curtailment rules (>30 MW) | -1.20% | Secondary cities, rural metros | Medium term (2–4 years) |
| Source: Mordor Intelligence | |||
Water-Usage Restrictions Challenge Traditional Cooling Methods
Brazil's data center expansion confronts severe water scarcity in key regions, with TikTok's planned mega facility in drought-prone Ceará generating public opposition over resource consumption [2].João Filho, “TikTok construirá mega data center em cidade com histórico de seca no Ceará,” Intercept, intercept.com.brEvaporative cooling systems consume 1.8 liters of water per kWh of IT load, creating sustainability conflicts in regions experiencing multi-year drought conditions. Environmental activists across Latin America mobilize against water-intensive data center projects, forcing operators to adopt closed-loop liquid cooling systems that eliminate evaporative consumption.
GPU Supply-Chain Bottlenecks Constrain AI Infrastructure Deployment
Global GPU shortages extend delivery cycles past 12 months, delaying cluster rollouts across Brazil’s 390 AI startups. Cloud-based GPU rentals and FPGA alternatives offer temporary relief, yet capacity concentration in large halls intensifies. NVIDIA’s training initiatives and local partnerships aim to optimize utilization, but supply headwinds still shave 1.8 percentage points from the forecast CAGR of the Brazil hyperscale data center market.
*Our forecasts treat driver/restraint impacts as directional, not additive. The impact forecasts reflect baseline growth, mix effects, and variable interactions.
Segment Analysis
By Data Center Type: Self-build Momentum Challenges Colocation Dominance
Self-build campuses captured 42% of additions in 2025, reflecting hyperscalers’ preference for sovereignty and scale. Colocation, while holding 58% of 2024 revenues, faces margin pressure as tenants graduate to proprietary sites. The Brazil hyperscale data center market size for self-build projects is projected to expand at an 18.40% CAGR through 2030, even as colocation providers retrofit halls with AI-ready white space to preserve occupancy. Operators such as V.tal respond with 200 MW facilities that blend single-tenant economics with carrier-neutral interconnection, narrowing the gap between the two models.
Digital Realty’s Ascenty secures long-term power contracts and subsea cable access to keep colocation attractive, whereas AWS, Microsoft, and Google leverage capital scale to accelerate land banking around federal capitals. Consequently, land scarcity around São Paulo inflates prices, encouraging secondary-metro builds in Porto Alegre and Fortaleza. This shift diversifies the Brazil hyperscale data center market and forces colocation incumbents to emphasize nuanced services like on-ramp connectivity and sovereign-cloud overlays.


By Component: Liquid Cooling Revolution Transforms Infrastructure Spending
IT hardware absorbed 41% of 2024 budgets as GPU clusters proliferated. Mechanical outlays, dominated by immersion and cold-plate solutions, now grow faster than electrical works, advancing at 24.70% CAGR. The Brazil hyperscale data center market size for cooling alone is forecast to more than triple by 2030, reflecting a pivot from airflow management to dielectric-fluid engineering.
Direct-to-chip manifolds, leak-detection patents, and AI-based thermal analytics appear in newly issued IP as vendors respond to 100 kW racks. Consequently, power-distribution units must handle rapid load step changes while network backbones upgrade to 800 G Ethernet. This synchronized evolution elevates integration complexity and tightens collaboration among server, power, and cooling suppliers.
By Tier Standard: Tier IV Builds Accelerate for Mission-Critical Applications
Tier III retained 64% of the Brazil hyperscale data center market share in 2024 by balancing cost and 99.982% uptime. Yet instant-payment workloads, AI fraud analysis, and government digitization push Tier IV demand to a 19.10% CAGR. Banks channel BRL 1.4 billion annually into Tier IV halls that can tolerate zero downtime during liquidity peaks. Facilities in Brasília mirror this trend, meeting federal redundancy mandates.
Operators counter the cost delta by adopting modular Tier IV blocks within larger Tier III campuses. That hybrid method enables capital efficiency while providing mission-critical tenants the availability they require. Over time, Tier IV footprints will shift from premium niche to mainstream specification for AI-heavy enterprises, tightening the design baseline across the Brazil hyperscale data center market.
By End-User Industry: AI Workloads Reshape Traditional Demand Patterns
Cloud and IT service providers accounted for 46% of 2024 demand, yet AI/ML use cases now post the fastest expansion at 22.50% CAGR to 2031. The BFSI segment leads Tier IV adoption, while public-sector workloads grow as the Gov.br portal digitizes citizen services. Retail e-commerce giants like Mercado Libre invest heavily in logistics analytics that require proximity compute, amplifying demand for edge-enabled hyperscale footprints.
Telecom operators preparing nationwide 5G networks prioritize regional data centers for ultra-low-latency content delivery. Manufacturing and Industry 4.0 pilots join the mix as robotics and predictive maintenance analysis shift from plant-floor servers to cloud-based inference engines. Combined, these shifts keep the Brazil hyperscale data center market diversified, mitigating overreliance on any single vertical.

By Data Center Size: Mega Facilities Lead Capacity Expansion
Massive halls between 25 MW and 60 MW presently hold 52% of installed megawatts, yet mega sites beyond 60 MW register a 21.00% CAGR to 2031. Scala’s 4.7 GW AI City outside São Paulo typifies mega-scale momentum, promising economies of scale in power procurement and cooling innovation. Ministry of Mines and Energy forecasts 9 GW nationwide demand by 2035, underscoring how mega facilities dominate incremental capacity.
Grid interconnection becomes the critical path item. Transmission upgrades and availability-based renewable PPAs incentivize cluster formation along wind-rich Northeast corridors. This dynamic positions mega campuses as anchor of the future Brazil hyperscale data center market, with smaller facilities serving edge aggregation and disaster-recovery roles.
Geography Analysis
Brazil hosts more than 180 operational data centers and 46 confirmed builds, capturing 75% of regional AI and data center investment commitments. São Paulo and Rio de Janeiro thrive on dense fiber rings and global subsea cables such as Seabras-1, anchoring the primary cloud regions for all major hyperscalers. Fortaleza emerges as an Atlantic gateway with 16 international cable landings that lower latency to North America and Europe.
The National Data Center Plan (Redata) ramps up Northeast incentives, pairing tax relief with easier equipment imports to encourage regional dispersion. V.tal’s BRL 550 million facility in Ceará and TikTok’s greenfield plans highlight early mover confidence. Secondary poles like Porto Alegre benefit from Scala’s HyperEdge concept, spreading risk and alleviating real-estate inflation around the capital corridor.
Water scarcity and 30 MW curtailment rules complicate inland expansion, but the government’s USD 52 billion energy-transmission modernization pledge by 2037 promises relief. High clean-energy penetration—85% of Brazil’s matrix—further strengthens the competitive position of hyperscale builds aimed at ESG-sensitive global tenants. As connectivity, power, and policy forces converge, the Brazil hyperscale data center market becomes a multi-cluster landscape rather than a single-hub story.
Coverage of the hyperscale data center market by Mordor Intelligence spans a wide geographic footprint, with regional analysis available for Asia, Europe, and North America, alongside detailed country-level intelligence for Chile, United States, India, Netherlands, Indonesia, and Thailand, each shaped by local operating conditions.
Competitive Landscape
The competitive field shows moderate concentration. Digital Realty’s Ascenty operates 34 sites and extensive dark-fiber rings, giving it scale leadership. Equinix exploits its interconnection pedigree across five Brazilian IBX facilities and recently added USD 94 million of capacity in Rio de Janeiro to address AI workloads. Scala Data Centers stakes claim to Latin America’s largest pipeline through the USD 50 billion AI City and a 560 MW dedicated substation. V.tal’s Tecto subsidiary positions renewable-powered campuses as a middle ground between colocation and self-build.
Brazil Hyperscale Data Center Industry Leaders
Scala Data Centers
ODATA (Aligned Data Centers, LLC)
Amazon Web Services Inc.
Microsoft Corporation
Oracle Corporation
- *Disclaimer: Major Players sorted in no particular order

Recent Industry Developments
- March 2025: OData has announced the development of DC SP04, a new data center in Osasco, São Paulo, Brazil. The company plans to invest over USD 450 million in this 48MW facility.
- March 2025: V.tal’s Tecto unveiled plans for a 200 MW renewable-powered facility in São Paulo
- January 2025: Aurea Finvest, a real estate investment and development firm, has announced plans to develop an 800MW data center in Sumaré, São Paulo, Brazil, supported by an investment of USD 830.3 million.
- September 2024: Scala Data Centers and Rio Grande do Sul announced the 4,750 MW-ready Scala AI City megaproject


Research Methodology Framework and Report Scope
Market Definitions and Key Coverage
Our study defines Brazil's hyperscale data center market as all new or operating facilities located in the country that provide >= 4 MW of contiguous IT-load to a single tenant or a pool of cloud, AI, or large OTT workloads. Capacity is counted in installed megawatts and converted to annual service revenue using prevailing $/MW lease rates as detailed by Mordor Intelligence analysts.
Scope Exclusions: Edge pods, retail colocation suites below 250 kW, and enterprise on-premise server rooms are excluded.
Segmentation Overview
- By Data Center Type
- Hyperscale Self-build
- Hyperscale Colocation
- By Component
- IT Infrastructure
- Server Infrastructure
- Storage Infrastructure
- Network Infrastructure
- Electrical Infrastructure
- PDUs
- Transfer Switches and Switchgears
- UPS Systems
- Generators
- Other Electrical Infrastructure
- Mechanical Infrastructure
- Cooling Systems
- Racks
- Other Mechanical Infrastructure
- General Construction
- Core and Shell Development
- Installation and Commissioning
- Design Engineering
- Fire Detection, Suppression and Physical Security
- DCIM/BMS Solutions
- IT Infrastructure
- By Tier Standard
- Tier III
- Tier IV
- By End-User Industry
- Cloud and IT
- Telecom
- Media and Entertainment
- Government
- BFSI
- Manufacturing
- E-Commerce
- Other End Users
- By Data Center Size
- Large (Less than equal to 25 MW)
- Massive (Greater than 25 MW and less than equal to 60 MW)
- Mega (Greater than 60 MW)
Detailed Research Methodology and Data Validation
Primary Research
Mordor analysts spoke with site planning managers at hyperscale self-build campuses, senior colocation sales leads in Sao Paulo and Fortaleza, regional utility planners, and specialist liquid cooling OEMs. These discussions validated utilization rates, rack density road maps, and forward land bank pipelines that are not visible in secondary data.
Desk Research
We gathered baseline figures from openly available tier-1 sources such as IBGE national economic statistics, ANATEL telecom traffic reports, ANEEL power grid connection logs, Receita Federal import records for servers and GPUs, and Uptime Institute's facility certification roster. Trade association white papers from ABRANET, carrier neutral marketplace listings on DataCenterMap, and company 10-K filings rounded out capacity and pricing signals. Select paid feeds, D&B Hoovers for operator financials and Dow Jones Factiva for project news, helped trace ownership shifts. This list is illustrative; numerous other public records were consulted for cross-checks.
Market-Sizing & Forecasting
Top-down modeling starts with the national stock of certified >4 MW halls, adds announced builds adjusted for average 30 month ramp, and multiplies by blended dollar per MW lease yields before translating to revenue. Bottom-up spot checks, sampling four supplier roll-ups and channel ASP x shipped GPU servers, are used to tune totals. Key drivers injected into the model include the number of newly commissioned submarine cable landings, Pix real-time payment volume, average rack density (kW), renewable power share, and Sao Paulo vacancy trends. A multivariate regression projects these variables to 2031 and feeds an ARIMA layer for short-term shocks. Gaps in site level data are bridged with regional penetration ratios derived from primary interviews.
Data Validation & Update Cycle
Outputs pass a four-eye analyst review, variance thresholds trigger re-contact with field sources, and unusual swings are benchmarked against independent power draw and import statistics. We refresh every year, with interim tweaks when material investments, such as AWS or Microsoft campus announcements, surface. Clients receive the latest model run prior to publication.
Why Mordor's Brazil Hyperscale Data Center Baseline Holds Trust
Published estimates often diverge because firms pick different service buckets, convert capex to revenue in varying ways, or assume one-time build costs as recurring income.
Key gap drivers include wider scopes that mix retail and enterprise halls with hyperscale stock, single year currency conversions, or outdated rack utilization factors. Mordor's definition locks to >= 4 MW halls only, applies realized lease yields, and is refreshed annually, thereby narrowing variance.
Benchmark comparison
| Market Size | Anonymized source | Primary gap driver |
|---|---|---|
| USD 2.82 B (2025) | Mordor Intelligence | - |
| USD 3.40 B (2024) | Global Consultancy A | counts total data center investment and mixes retail plus on-prem assets |
| USD 4.70 B (2024) | Industry Tracker B | uses service revenue from all facility sizes, inflating scope beyond >= 4 MW |
In summary, our tightly defined scope, live capacity tracking, and dual-path validation give decision makers a balanced, reproducible baseline, whereas broader industry tallies tend to overstate Brazil's true hyperscale revenue pool.


Key Questions Answered in the Report
What is the current size of the Brazil hyperscale data center market?
The Brazil hyperscale data center market size stands at USD 2.82 billion in 2025 and is growing at a 18.02% CAGR toward 2030.
Which segment holds the largest share in the Brazil hyperscale data center market?
Colocation services lead with 54% of Brazil hyperscale data center market share, thanks to their capital efficiency and rapid deployment cycles
Why are renewable PPAs critical for Brazilian hyperscale operators?
Long-term renewable PPAs lock in low-cost, low-carbon electricity for 15 years or more, cutting operating expenses while meeting corporate sustainability targets.
How is AI workload growth shaping facility design in Brazil?
GPU-dense racks exceeding 20 kW drive adoption of liquid cooling and higher-voltage busways, enabling efficient support for AI training clusters.
Page last updated on:


