Indonesia Financial Technology Services Market Size and Share
Market Overview
| Study Period | 2020 - 2031 |
|---|---|
| Forecast Data Period | 2026 - 2031 |
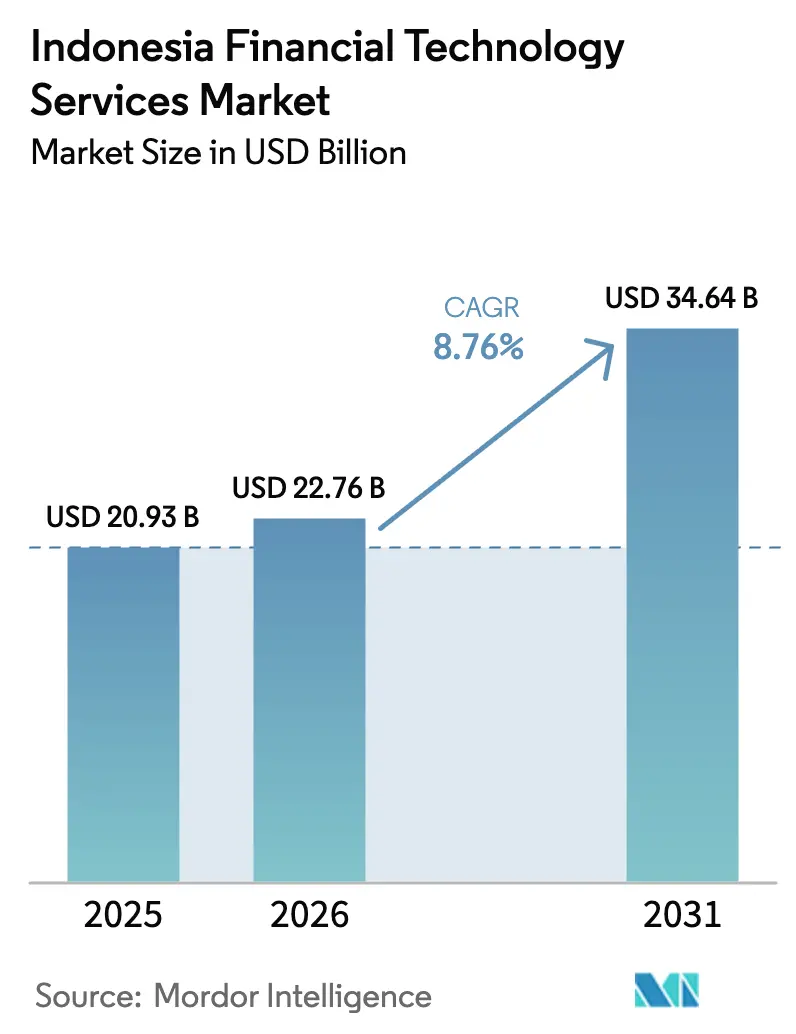
| Base Year Market Size (2025) | USD 20.93 Billion |
| Market Size (2026) | USD 22.76 Billion |
| Market Size (2031) | USD 34.64 Billion |
| Growth Rate (2026 - 2031) | 8.76% CAGR |
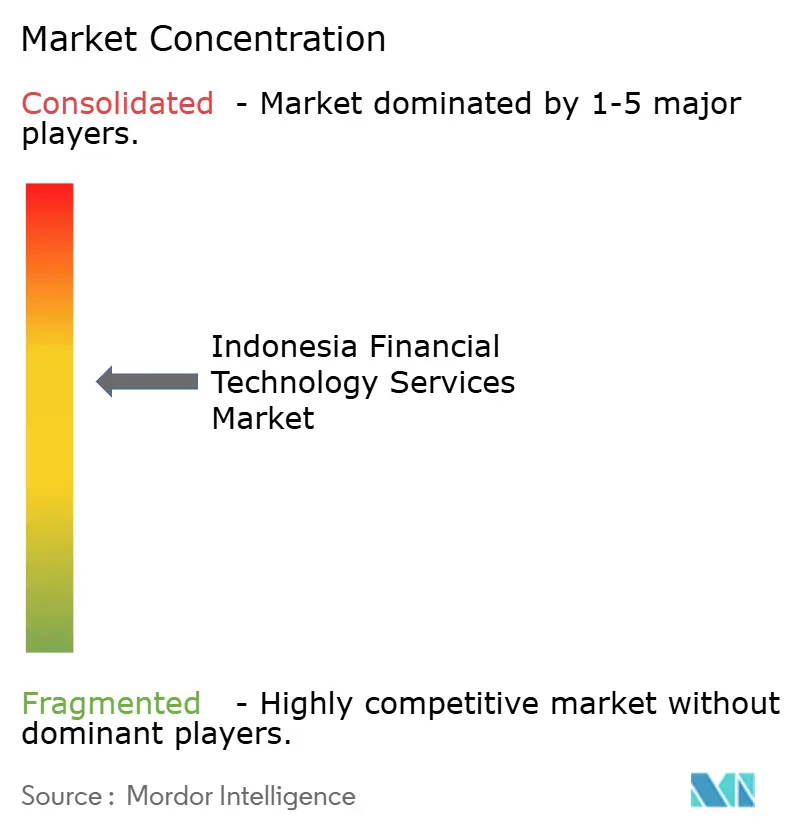
| Market Concentration | Medium |
Major Players *Disclaimer: Major Players sorted in no particular order Image © Mordor Intelligence. Reuse requires attribution under CC BY 4.0. | |
Indonesia Financial Technology Services Market Analysis by Mordor Intelligence
The Indonesia financial technology services market size was valued at USD 20.93 billion in 2025 and estimated to grow from USD 22.76 billion in 2026 to reach USD 34.64 billion by 2031, at a CAGR of 8.76% during the forecast period (2026-2031). Robust smartphone adoption, a nationwide QR code mandate, and open-API banking standards are accelerating digital payment penetration while simultaneously nurturing fast-rising segments, such as neo-banking and blockchain-based platforms. Product providers continue to shift toward fee-based revenues, driving the adoption of value-added analytics and embedded finance into retail and micro-enterprise workflows. Competitive intensity remains moderate as GoPay, OVO, and DANA leverage super-app ecosystems, yet license revocations in 2024 created space for compliant innovators specializing in sharia-compliant finance and cross-border transfers. Regulatory headwinds linked to cybersecurity costs and extended licensing timelines temper near-term expansion but do not derail Indonesia’s transition toward a cash-light economy.
Key Report Takeaways
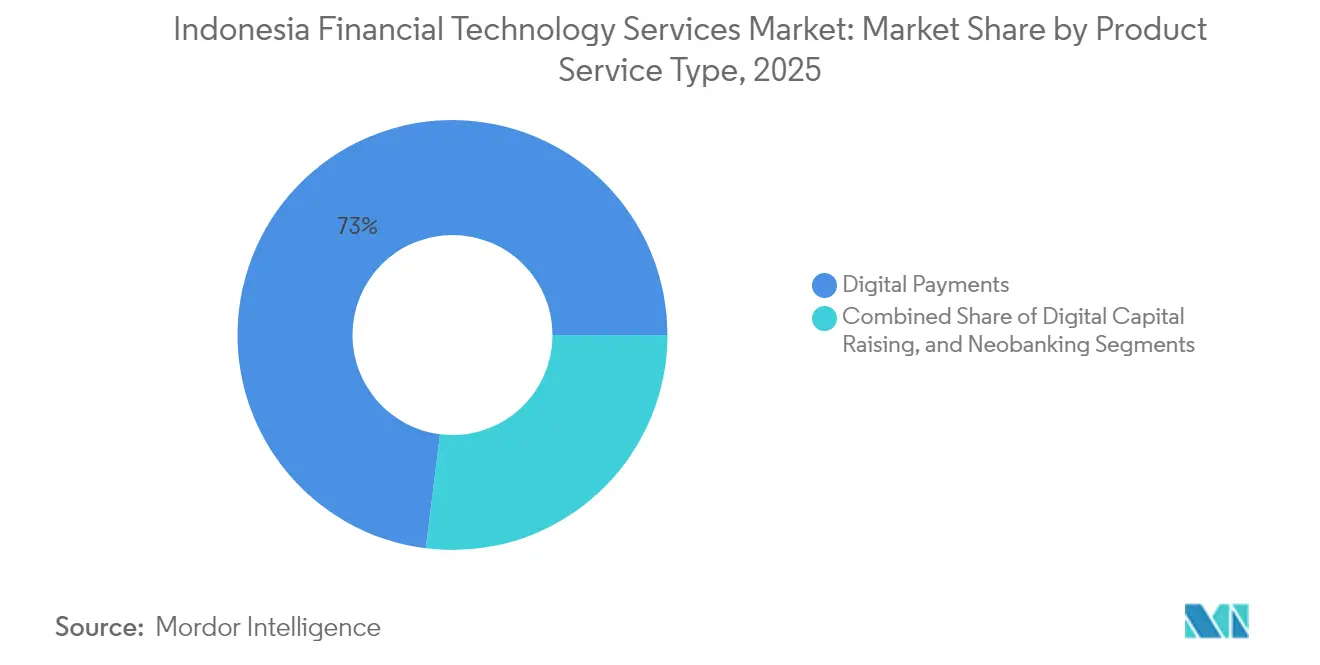
- By service type, digital payments led with 73.02% revenue share in 2025; neobanking is projected to advance at a 9.62% CAGR through 2031.
- By end-user, retail consumers accounted for 67.58% of adoption in 2025, whereas micro and small enterprises are expected to show the highest forecast CAGR of 9.35% from 2025 to 2031.
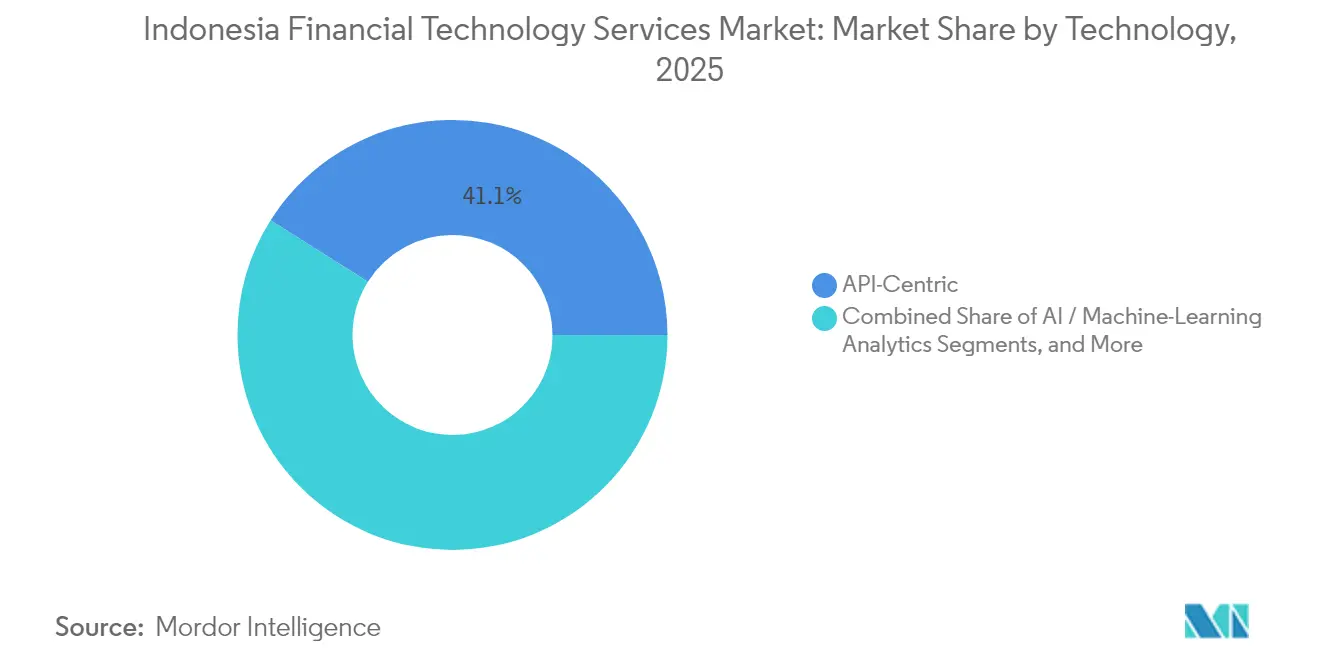
- By technology, API-centric platforms held 41.05% of Indonesia financial technology services market share in 2025, while blockchain and distributed ledger technologies are set to climb at a 10.25% CAGR.
- By service channel, mobile applications captured 83.02% of usage in 2025, yet integrated super-apps represent the fastest-growing route, with a 9.74% CAGR through 2031.
Note: Market size and forecast figures in this report are generated using Mordor Intelligence’s proprietary estimation framework, updated with the latest available data and insights as of 2026.
Indonesia Financial Technology Services Market Trends and Insights
Drivers Impact Analysis*
| Driver | (~) % Impact on CAGR Forecast | Geographic Relevance | Impact Timeline |
|---|---|---|---|
| High smartphone and mobile-data penetration | +2.10% | National, with urban concentration in Jakarta, Surabaya, Medan | Short term (≤ 2 years) |
| Government-led QRIS cashless mandate | +1.80% | National, with accelerated adoption in Tier-1 and Tier-2 cities | Medium term (2-4 years) |
| Unbanked population seeking financial inclusion | +1.50% | Rural areas, Eastern Indonesia provinces, remote islands | Long term (≥ 4 years) |
| Open-API banking standards roll-out | +1.20% | National, with early implementation in major financial centers | Medium term (2-4 years) |
| Rise of sharia-compliant fintech offerings | +0.90% | National, with concentration in Aceh, West Java, Central Java | Long term (≥ 4 years) |
| Remittance inflow-driven cross-border payment demand | +0.70% | Border regions, major cities with migrant worker populations | Medium term (2-4 years) |
| Source: Mordor Intelligence | |||
High Smartphone and Mobile-Data Penetration Accelerates Digital-First Banking
Smartphone ownership reached 89.1% in 2024, and 4G networks now serve 95% of populated areas, enabling device-native banking for both urban and rural users. Lower-cost Android handsets priced under USD 100 and data plans below USD 5 per month remove price barriers, while the average data consumption of 17.3 GB per user supports video-KYC and real-time monitoring. As a result, new entrants can bypass costly branch networks and still achieve nationwide scale.
Government-Led QRIS Cashless Mandate Creates Unified Payment Infrastructure
QRIS handled more than 16 billion transactions valued at IDR 2,600 trillion (USD 173.3 billion) in 2024, trimming small-merchant fees from 2-3% to 0.7% and eliminating multiple QR formats. Coverage of government services, taxes, and social benefits further embeds digital payments into daily life, contributing to a structural rise in non-cash volumes.
Open-API Banking Standards Roll-Out Enables Ecosystem Integration
The 2024 launch of the SNAP open-API framework shortened product release cycles by 40% and cut acquisition costs by 25% for providers that integrate banking rails via standardized APIs. Super-apps now bolt on deposits, loans, and insurance without owning a bank license, while legacy banks monetize infrastructure through usage fees rather than proprietary apps.
Unbanked Population Seeking Financial Inclusion Drives Rural Expansion
Seventy-seven million adults remain unbanked, representing a USD 12 billion opportunity. Agent networks and mobile wallets deliver services at costs 60-70% below branch banking, allowing micro-credit, crop payments, and digital remittances to reach remote islands once deemed unprofitable.
Restraints Impact Analysis*
| Restraint | (~) % Impact on CAGR Forecast | Geographic Relevance | Impact Timeline |
|---|---|---|---|
| Cyber-fraud and data-breach incidents | -1.30% | National, with higher impact in urban areas with greater digital adoption | Short term (≤ 2 years) |
| Regulatory approval and licensing delays | -0.90% | National, affecting all market participants equally | Medium term (2-4 years) |
| High e-KYC onboarding cost structure | -0.70% | National, with disproportionate impact on rural and low-income segments | Long term (≥ 4 years) |
| Cloud-provider concentration risk | -0.50% | National, with critical infrastructure dependencies | Medium term (2-4 years) |
| Source: Mordor Intelligence | |||
Cyber-Fraud and Data-Breach Incidents Erode Consumer Trust
More than 1,300 cyber events in 2024 exposed 15 million user records and cost the sector USD 847 million in losses. After high-profile breaches, 23% of surveyed customers reduced fintech usage, forcing providers to add multi-factor authentication and real-time fraud analytics at an average annual cost of USD 2.3 million per mid-sized firm.
Regulatory Approval and Licensing Delays Constrain Market Entry
Only 67% of license applications met the 180-day review target in 2024, and some required up to 18 months, resulting in increased pre-launch costs of USD 1.8 million for foreign entrants. Frequent rule updates further heighten uncertainty, giving incumbents with established compliance teams a timing advantage.
*Our forecasts treat driver/restraint impacts as directional, not additive. The impact forecasts reflect baseline growth, mix effects, and variable interactions.
Segment Analysis
By Service Type: Payments Rule but Neobanks Gain Pace
Indonesia financial technology services market size for digital payments commanded 73.02% share in 2025, boosted by QRIS ubiquity that slashed merchant fees. Yet this dominance hides tightening margins, prompting providers to bundle analytics and supply-chain loans. Conversely, neobanking revenue is projected to expand at a 9.62% CAGR, reflecting demand for all-in-one money management rather than single-function wallets. Investors also direct fresh capital toward digital capital-raising platforms as retail sophistication and regulatory clarity grow.
Transaction-oriented apps now embed savings and investment features, while neobanks exploit cloud-native cores to launch products within weeks. As the Indonesia financial technology services market size shifts toward integrated propositions, established payment companies either secure banking licenses or strike open-API partnerships to defend wallet share.


By End-User: Micro-Businesses Lead Digitization Wave
Retail consumers retained 67.58% of 2025 usage, yet saturation in large cities slows their growth compared with enterprises. Micro and small enterprises are on track for a 9.35% CAGR to 2031, thanks to mandated e-invoicing and simplified QR acceptance. This demographic also attracts embedded lenders that convert point-of-sale data into credit scores - helping the Indonesia financial technology services market share in lending tilt toward underserved firms.
Government agencies disburse social benefits via digital wallets, cutting administrative costs by 35% and normalizing fintech use in remote districts. Medium and large corporations prioritize API links that merge treasury, payroll, and procurement within enterprise resource planning suites, deepening the Indonesia financial technology services industry’s foothold in B2B workflows.
By Technology: APIs Anchor a Transition Toward Blockchain
API-centric stacks underpinned 41.05% of Indonesia financial technology services market share in 2025 and remain the connective tissue for rapid scale. Bank Indonesia’s digital rupiah pilot and Project Nexus accelerate blockchain adoptions, driving distributed ledger revenue at a projected 10.25% CAGR. Cloud-native modernization enables incumbents to retire legacy cores in phases, while AI engines power fraud monitoring and alternative credit decisioning for thin-file borrowers.
Hybrid solutions now combine blockchain settlement with AI scoring over API gateways, unlocking faster cross-border payments and micro-insurance tailored to mobile data footprints. These converging technologies consolidate the Indonesia financial technology services market around interoperable, modular architectures.
By Service Channel: Super-Apps Re-shape Usage Patterns
Mobile apps accounted for 83.02% of 2025 transactions, while integrated super-apps are expanding their appeal at a 9.74% CAGR by combining ride-hailing, food delivery, and finance into a single login. As users explore bundled experiences, stand-alone wallets must add differentiated value or risk churn in the Indonesia financial technology services market. Desktop web stays relevant for long-form insurance or investment journeys that require larger screens, while agent networks bridge digital literacy gaps in rural zones where assisted transactions grew 45% last year.
Hybrid offline-to-online models simultaneously satisfy older customers seeking face-to-face reassurance and new-to-digital consumers entering the ecosystem through trusted local intermediaries. This multi-channel reality highlights Indonesia’s geographic diversity and suggests sustained growth beyond Java.
Geography Analysis
Java and Sumatra generated major share of 2024 transaction volumes because of dense populations and superior connectivity. Jakarta’s proximity to Singapore’s financial hub fuels cross-border experiments, whereas Surabaya and Medan anchor regional merchant networks. Yet eastern provinces offer faster upside - smartphone adoption is rising from a lower base, and satellite broadband investments will soon erase coverage gaps. Project Nexus corridors linking Malaysia, Thailand, and the Philippines position border cities as gateways for remittances and trade settlements.
Regulatory rules apply nationwide, but enforcement intensity and local tax incentives differ. Special economic zones in eastern islands grant fintech startups lower levies and quicker municipal approvals, partly offsetting the higher logistics costs of serving remote areas. As financial inclusion programs expand, agents embedded in cooperatives and village stores collect transaction data that feeds alternative credit models, widening the Indonesia financial technology services market footprint outside urban centers.
Western regions may see slower percentage growth but still hold the largest absolute revenue pools, prompting major platforms to launch premium wealth and insurance bundles targeted at middle-class professionals. Meanwhile, smaller providers that specialize in Bahasa-regional dialect interfaces or agriculture financing carve niches in provinces where national brands are less entrenched.
Competitive Landscape
Concentration is moderate: GoTo’s GoPay, Grab’s OVO, and DANA command hefty payment volumes yet share the arena with more than 150 licensed fintech operators. The 2024 license purge eliminated 127 non-compliant lenders, tilting market share toward well-capitalized firms able to meet fresh capital and cyber-security thresholds. Super-apps strengthened moats by absorbing vertical specialists: OVO’s merger with Superbank now delivers deposit, loan, and investment products inside one experience.
Legacy banks form joint ventures or invest in API fintech startups to speed digital transformation while leveraging traditional trust advantages. Blockchain pilots with state-owned lenders illustrate a pivot from competing head-on with fintech toward symbiotic partnerships. White-space persists in sharia finance, rural credit, and SME supply-chain payments where niche innovators scale on lighter balance-sheet models, underscoring that Indonesia financial technology services market dynamics hinge on both ecosystem breadth and deep segment focus.
Indonesia Financial Technology Services Industry Leaders
PT Ajaib Teknologi Indonesia
PT Investree Radhika Jaya
Grab Holdings Limited
PT GoTo Gojek Tokopedia Tbk
PT Akulalu Silvrr Indonesia
- *Disclaimer: Major Players sorted in no particular order

Recent Industry Developments
- October 2025: GoTo introduced a merchant-focused super-app bundling payments, inventory, and analytics to deepen SME engagement.
- September 2025: Bank Indonesia has completed phase two of its digital rupiah pilot, finalizing technical standards for a nationwide rollout.
- August 2025: Xendit raised USD 300 million in Series D funding, lifting its valuation to USD 2.5 billion and earmarking resources for embedded finance across Southeast Asia.
- January 2025: OVO rolled out a micro-insurance marketplace covering health, accident, and crop risks, using real-time underwriting sourced from telco and weather data.


Indonesia Financial Technology Services Market Report Scope
The Indonesian financial technology services market includes estimating the total transaction values performed by the country's financial technology solution providers through their online platforms and other digital payment channels.
The Indonesian financial technology services market is segmented by type (digital capital raising, digital payments, and neobanking) and region (Java, Sumatra, Kalimantan, and other regions). The market sizes and forecasts are provided in USD for all the above segments.
| Digital Capital Raising | Crowd-Investing |
| Crowd-Lending | |
| Marketplace Lending | |
| Digital Payments | Digital Commerce |
| Digital Remittances | |
| Mobile PoS Payments | |
| Neobanking |
| Individual / Retail Consumers |
| Micro- and Small-Sized Enterprises (MSEs) |
| Medium and Large Enterprises |
| Government and Public-Sector Entities |
| API-Centric Architecture |
| Blockchain and DLT |
| Cloud-Native Platforms |
| AI / Machine-Learning Analytics |
| Big-Data and Alternative-Data Engines |
| Mobile Applications |
| Web-Based Platforms |
| Agent Networks / Offline-to-Online |
| Integrated Super-Apps |
| By Service Type | Digital Capital Raising | Crowd-Investing |
| Crowd-Lending | ||
| Marketplace Lending | ||
| Digital Payments | Digital Commerce | |
| Digital Remittances | ||
| Mobile PoS Payments | ||
| Neobanking | ||
| By End-User | Individual / Retail Consumers | |
| Micro- and Small-Sized Enterprises (MSEs) | ||
| Medium and Large Enterprises | ||
| Government and Public-Sector Entities | ||
| By Technology | API-Centric Architecture | |
| Blockchain and DLT | ||
| Cloud-Native Platforms | ||
| AI / Machine-Learning Analytics | ||
| Big-Data and Alternative-Data Engines | ||
| By Service Channel | Mobile Applications | |
| Web-Based Platforms | ||
| Agent Networks / Offline-to-Online | ||
| Integrated Super-Apps | ||


Key Questions Answered in the Report
What is the projected value of Indonesia financial technology services market in 2031?
It is forecast to reach USD 34.64 billion, growing at a 8.76% CAGR from 2026.
Which segment is expanding fastest within Indonesia’s fintech ecosystem?
Neobanking, with a 9.62% CAGR projected through 2031 as consumers migrate toward integrated money-management platforms.
How significant are digital payments today?
Digital payments held 73.02% of 2025 revenue, underpinned by QRIS standardization that reduced merchant fees and boosted daily usage.
Why are micro and small enterprises important to fintech growth?
They are adopting fintech at a 9.35% CAGR, driven by mandated e-invoicing and easier credit access through data-driven scoring.
What role does the central bank’s digital rupiah play?
The ongoing pilot positions Indonesia among early CBDC adopters, paving the way for blockchain-based settlement and lower cross-border costs.
How is regulation affecting new market entrants?
Licensing reviews can take up to 18 months, pushing pre-launch costs to USD 1.8 million and favoring incumbents with established compliance teams.
Page last updated on:


