Non-Fungible Token Market Size and Share
Market Overview
| Study Period | 2020 - 2031 |
|---|---|
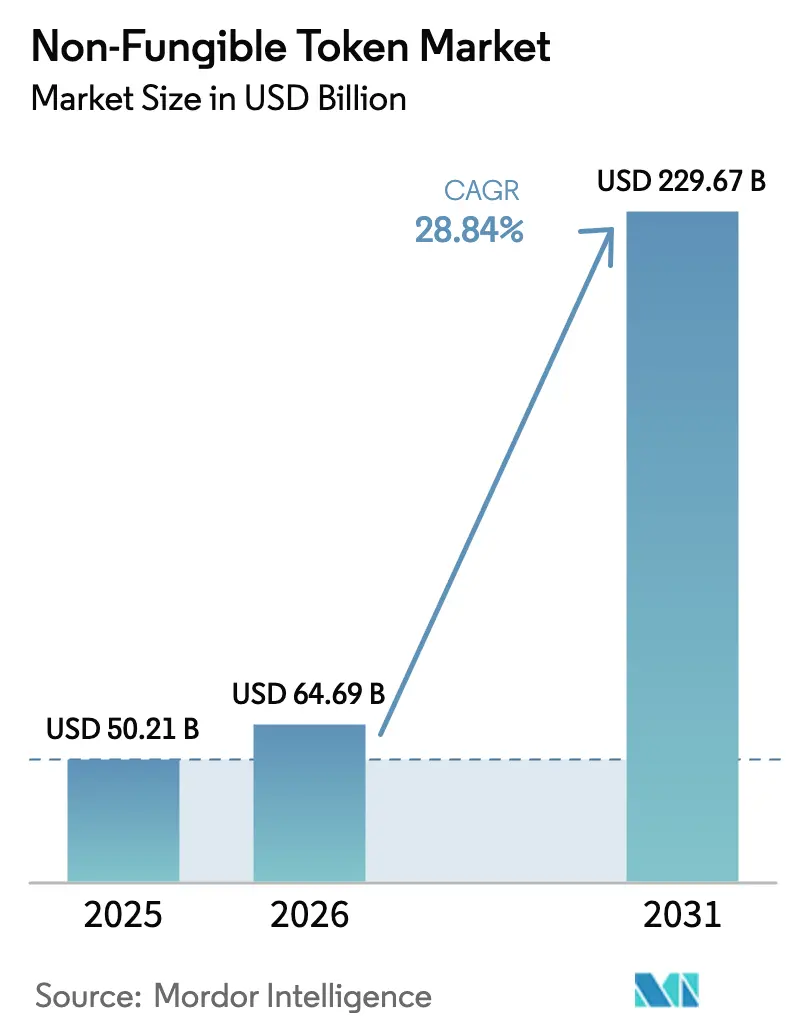
| Market Size (2026) | USD 64.69 Billion |
| Market Size (2031) | USD 229.67 Billion |
| Growth Rate (2026 - 2031) | 28.84% CAGR |
| Fastest Growing Market | Asia Pacific |
| Largest Market | North America |
| Market Concentration | Medium |
Major Players *Disclaimer: Major Players sorted in no particular order Image © Mordor Intelligence. Reuse requires attribution under CC BY 4.0. | |
Non-Fungible Token Market Analysis by Mordor Intelligence
The Non-Fungible Token market size is expected to grow from USD 50.21 billion in 2025 to USD 64.69 billion in 2026 and is forecast to reach USD 229.67 billion by 2031 at 28.84% CAGR over 2026-2031. The surge stems from faster blockchain throughput, lower gas fees and clearer regulations that let enterprises deploy NFTs for verified ownership, brand engagement and supply-chain authentication. Institutional investors are moving in, liquidity is rising and real-world use cases—from gaming avatars to luxury authentication—are displacing the purely speculative trading that dominated earlier cycles. Ethereum still anchors most activity, yet high-speed chains such as Polygon, Solana and Flow are carving share through lower minting costs, a shift that foreshadows a multi-chain operating model. Platform upgrades that enable dynamic metadata, rentable tokens and fractionalization continue to deepen utility, keeping transaction volumes buoyant even as overall crypto volatility eases. The Non-Fungible Token market now tracks broader digital-asset regulation, with the EU’s VAT guidance and US DeFi reporting rules setting frameworks that legitimize institutional flows.
Key Report Takeaways
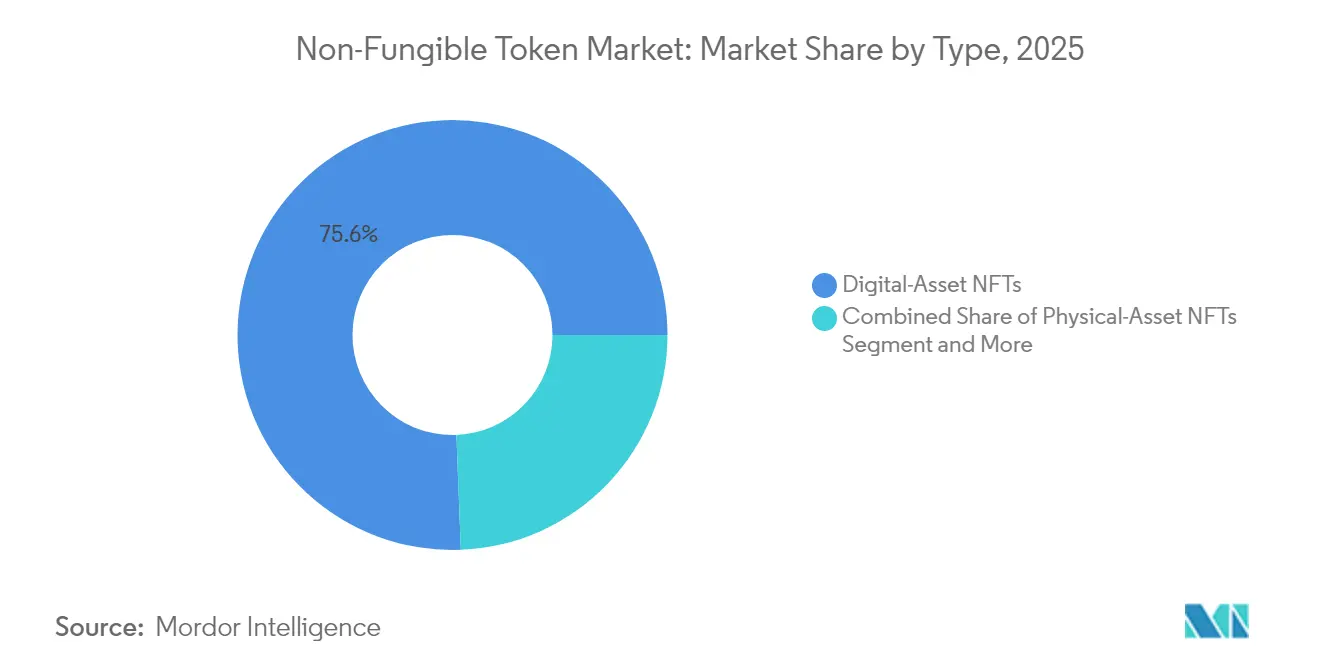
- By type, digital-asset NFTs captured 75.62% of the Non-Fungible Token market share in 2025; Dynamic NFTs are forecast to post a 31.02% CAGR through 2031.
- By application, collectibles led with 48.54% revenue share of the Non-Fungible Token market size in 2025, whereas Gaming is projected to expand at a 30.95% CAGR to 2031.
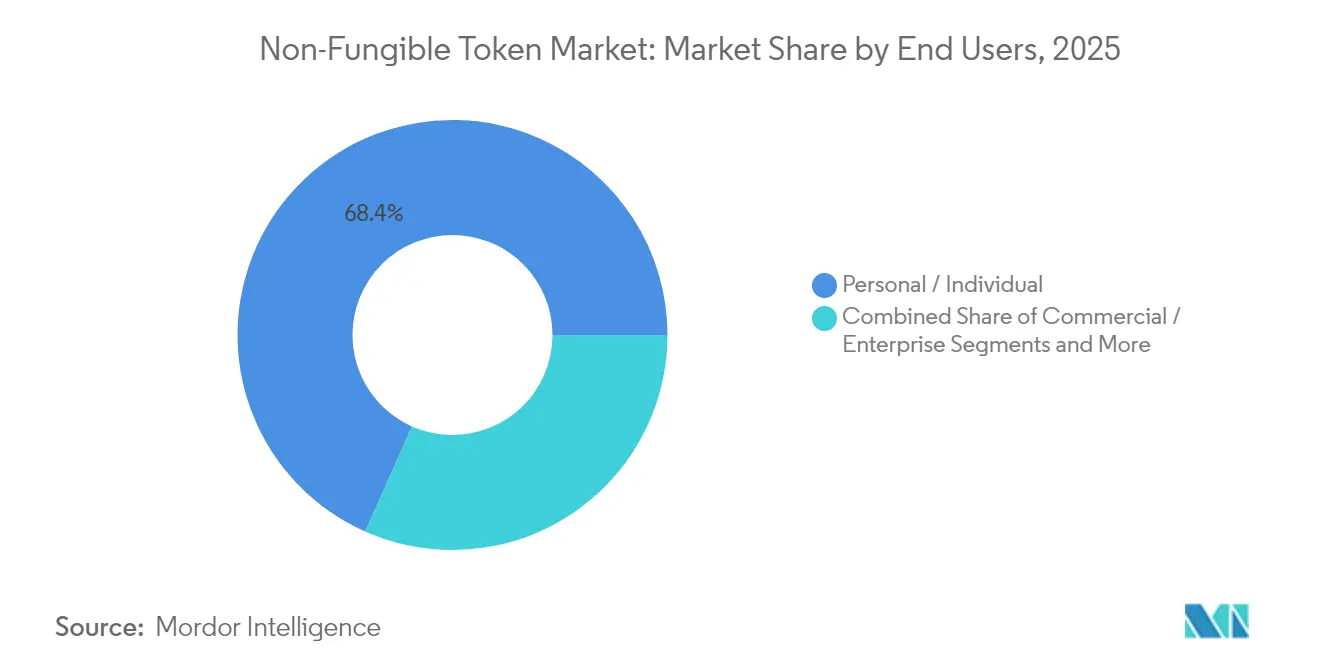
- By end-user, personal/Individual users accounted for 68.35% share in 2025; Institutional Investors record the fastest trajectory at a 29.34% CAGR through 2031.
- By blockchain platform, ethereum commanded 75.12% share in 2025; Polygon is advancing at a 31.18% CAGR through 2031.
- By geography, North America held 42.68% revenue share in 2025, while Asia-Pacific is set to grow at a 29.85% CAGR to 2031.
Note: Market size and forecast figures in this report are generated using Mordor Intelligence’s proprietary estimation framework, updated with the latest available data and insights as of 2026.
Global Non-Fungible Token Market Trends and Insights
Drivers Impact Analysis*
| Driver | (~) % Impact on CAGR Forecast | Geographic Relevance | Impact Timeline |
|---|---|---|---|
| Accelerating internet and smartphone penetration | +4.2% | Global; strongest in Asia-Pacific and MEA | Medium term (2-4 years) |
| Mainstream gaming integration and Play-to-Earn | +6.8% | Global; led by North America and Asia-Pacific | Short term (≤ 2 years) |
| Celebrity and brand endorsements | +3.5% | North America and EU with spill-over to Asia-Pacific | Short term (≤ 2 years) |
| Metaverse and virtual-real-estate monetization | +5.1% | Global; early gains in US, South Korea, Japan | Medium term (2-4 years) |
| Dynamic/Soul-bound NFTs | +7.3% | Global; technical leadership in North America and EU | Long term (≥ 4 years) |
| Zero-knowledge proof roll-ups | +4.9% | Global; immediate impact on Ethereum ecosystem | Short term (≤ 2 years) |
| Source: Mordor Intelligence | |||
Mainstream Gaming Integration and Play-to-Earn Models
Web3 studios anticipate 50 million monthly active players by 2025, confirming gaming as the closest-in catalyst for fresh wallet growth.[1]Cointelegraph Staff, “Web3 Gaming to Reach 50 M Users by 2025,” Cointelegraph, cointelegraph.com Franchise owners such as FIFA now licence NFT-backed player cards in Mythical Games’ “FIFA Rivals,” anchoring adoption in familiar gameplay while capping token inflation. Cross-platform consoles—Polium’s eight-chain unit is a notable example—remove technical barriers for mass-market gamers. Revenue shifts from one-off drops toward recurring season passes and tournament fees improve gross margins for publishers. The broader effect is a stickier Non-Fungible Token market, with in-game assets circulating across ecosystems rather than idling in cold wallets.
Celebrity and Brand Endorsements Expanding User Base
Luxury marques deploy NFTs to blend digital exclusivity with physical scarcity. Lamborghini’s Wilder World drop sold 600 Temerario sports-car NFTs at USD 300 each, pairing metaverse test drives with tangible purchase coupons.[2]CoinDesk Editors, “Lamborghini Drops Temerario NFTs in Wilder World,” CoinDesk, coindesk.com Brands now structure ongoing community passes instead of single-shot airdrops, lifting engagement metrics and creating royalty revenue on secondary trades. Verified smart-contract metadata reduces counterfeits, addressing the reputation risk that plagued early celebrity mints. As a result, the Non-Fungible Token market sees durable user cohorts who value identity and experiential access over fast flips
Metaverse and Virtual Real-Estate Monetization
Land sales are graduating from speculative grabs to structured yields. Owners lease virtual storefronts, license ad space and host ticketed events, turning parcels into income-producing assets. Dynamic NFTs add seasonality features—lighting changes, signage swaps—that keep venues fresh and justify premium rents.[3]TokenMinds Team, “Dynamic NFTs in Virtual Real Estate,” TokenMinds Blog, tokenminds.com Cross-chain worlds let avatars and assets travel freely, widening liquidity. Corporations now pilot virtual campuses for onboarding and product launches, legitimizing valuations that rest on cash-flow models rather than unbacked hype. This utility focus feeds steady demand for development kits, middleware and parcel-management dashboards.
Emergence of Dynamic/Soul-bound NFTs Unlocking Recurring Revenues
Programmable tokens that update in real time shift value from static art to living assets. The ERC-4907 rentable standard allows owners to lend rights without ceding title, spawning subscription models for collectibles and in-game items. Sports cards refresh player stats after every match, while real-estate tokens reflect maintenance logs, raising trust with lenders. Soul-bound IDs tie credentials—degrees, certifications, loyalty tiers—to immutable wallets, solving KYC and reputation gaps for DeFi lenders and online guilds. These features elongate holding periods and diversify monetization paths, deepening the Non-Fungible Token market.
Restraints Impact Analysis*
| Restraint | (~) % Impact on CAGR Forecast | Geographic Relevance | Impact Timeline |
|---|---|---|---|
| Regulatory fragmentation and legal uncertainty | -3.8% | Global; most severe in EU and emerging markets | Medium term (2-4 years) |
| Intellectual-property infringement risks | -2.9% | Global; concentrated in creative industries | Short term (≤ 2 years) |
| High environmental footprint of PoW chains | -2.1% | Global; regulatory pressure in EU and North America | Long term (≥ 4 years) |
| Liquidity crunch from wash-trading crack-downs | -1.7% | Global; immediate impact on trading volumes | Short term (≤ 2 years) |
| Source: Mordor Intelligence | |||
Regulatory Fragmentation and Legal Uncertainty
Differing VAT rules in the EU and DeFi reporting mandates from the US Treasury oblige marketplaces to bolt on jurisdiction-specific KYC, tax and reporting layers. Compliance spend rises, squeezing smaller platforms and slowing cross-border launches. IP ownership remains fuzzy because an NFT transfer rarely conveys copyright; lawsuits over unlicensed mints erode buyer confidence. Ongoing court challenges will shape eventual harmonization, but near-term frictions trim addressable volume from cautious institutional desks.
Intellectual-Property Infringement Risks
Because token custody is not copyright ownership, artists often discover unauthorized mints of their work, spurring legal takedowns that dent platform credibility. Enforcement is tricky when infringers jump chains and hide behind pseudonyms. Patent overlaps in smart-contract logic create further uncertainty: overlapping claims on fractionalization or royalties could trigger licensing tolls. AI-generated imagery complicates authorship proofs, raising the prospect of orphaned NFTs with unclear legal status. These frictions tighten onboarding funnels, tempering growth for the Non-Fungible Token market.
*Our forecasts treat driver/restraint impacts as directional, not additive. The impact forecasts reflect baseline growth, mix effects, and variable interactions.
Segment Analysis
By Type: Digital-Asset NFTs Drive Market Foundation
Digital-Asset NFTs dominated with 75.62% Non-Fungible Token market share in 2025, underscoring their role as the default format for art, gaming skins and profile-picture (PFP) collections. Their momentum stems from mature wallets, marketplace liquidity and a wide creator base. Dynamic NFTs, forecast to grow at 31.02% CAGR, add programmable layers that refresh metadata based on oracles or user interactions. Physical-Asset tokens gain traction in luxury goods, letting scanners verify ownership anywhere. Fractional tokens lower entry barriers for marquee collectibles by splitting rights, although liquidity pools must guard against smart-contract exploits.
EIP-7891 now allows hierarchical tokens to split and recombine, enabling flexible redemption mechanics for ticketing and real-estate deeds. ERC-4907 rental functions let holders lend gaming avatars for daily fees, turning idle assets into yield vehicles. Together, these standards diversify cash flows and extend holding horizons, supporting a more resilient Non-Fungible Token market. The Non-Fungible Token market size for Digital-Asset NFTs represented 75.62% of total transaction value in 2025, affirming their foundational position.


By Application: Gaming Transforms NFT Utility
Collectibles held 48.54% of Non-Fungible Token market size in 2025, anchored by PFPs and limited-edition art drops. Gaming, however, is projected to outpace all segments with a 30.95% CAGR, converting virtual items into transferrable property that carries across titles. Utilities—from membership passes to concert tickets—show rising adoption as brands replace QR codes with on-chain proofs. Music and Media leverage automated royalty splits, giving creators instant settlement and transparent accounting.
Forgotten Runiverse securing console certification signals mainstream crossover, while FIFA’s on-chain cards tie digital scarcity to real-world sports calendars. Interoperability bridges let players move weapons, skins and badges between games, amplifying utility versus legacy closed economies. These shifts reinforce a gamer-centric Non-Fungible Token market, where ownership persists beyond a single studio’s lifecycle.
By End-user: Institutional Adoption Accelerates
Personal wallets contributed 68.35% of 2025 trading, yet institutional desks post a 29.34% CAGR as hedge funds, insurers and pension managers allocate to NFTs for diversification and yield. Enterprise treasuries mint tokens to verify supply-chain milestones and issue loyalty rewards, driving throughput that does not correlate with crypto cycles. Custody-tech providers add multi-sig recovery, SOC2 audits and insurance, meeting fiduciary thresholds that gatekeepers demand.
Igloo Inc.’s push to onboard funds into the Pudgy Penguins IP shows how once-niche collections morph into consumer brands with merch, games and media extensions. Compliance-ready escrow contracts, real-time valuation dashboards and DeFi-native lending pools converge to form an institutional Non-Fungible Token market ready for larger ticket sizes.
By Blockchain Platform: Multi-Chain Future Emerges
Ethereum retained 75.12% share in 2025, powered by network effects and deep liquidity. Polygon’s 31.18% CAGR highlights demand for cheaper, faster settlements. Solana attracts latency-sensitive gaming drops, Flow courts mainstream IP owners with consumer-grade UX and BNB Chain harnesses Binance’s fiat ramps. Cross-chain protocols like Holograph maintain token integrity without wraps, while ZetaChain promises single-stack dApps callable from any chain.
EIP-7702 bundles wallet actions, enabling one-click mint-and-list flows that halve user friction. Layer-2 roll-ups now embed native yield, letting staked ETH collateralize NFT‐backed loans. These advancements broaden the Non-Fungible Token market beyond a single network, cushioning congestion spikes and gas-price shocks.
Geography Analysis
North America led with 42.68% share in 2025, supported by clear SEC and CFTC guidance, a dense venture-capital pipeline and enterprise pilots across retail, sports and media. DeFi reporting rules raise compliance costs yet confer legitimacy, unlocking pension and insurance mandates previously sidelined by policy gaps. Canada’s permissive crypto rules and Mexico’s growing fintech scene spread adoption through the continent, while Silicon Valley studios secure marquee IP collaborations that keep liquidity onshore.
Asia-Pacific’s projected 29.85% CAGR stems from mobile-first populations, premier league gaming cultures and government-backed Web3 programs. Japan funds digital citizenship NFTs that double as municipal engagement tools. South Korea’s esports dominance drives NFT ticketing and sponsorship rights, and regulated sandboxes let startups trial tokenomics before full licensing. Mainland China restricts crypto trading but green-lights NFT certificates for culture preservation, spawning compliant marketplaces that emphasize state-approved art and heritage.


Competitive Landscape
Competition sits at an intermediate level as OpenSea, Blur, Magic Eden and LooksRare vie on fees, token incentives and creator tools. Feature races now center on gas-less listings, on-chain analytics and social trading layers that surface trend data for curators. Emerging vertical plays focus on niches: marketplace-as-a-service for brands, KYC-ready ticketing rails for events, and fractional-rights exchanges for high-value art.
Patents emphasize spatial-computing integration, exemplified by Samsung’s NFT information system that maps tokens into VR environments. Consolidation is underway: Coinbase bought Spindl to fold ad-tech into its NFT suite, while Art Blocks partners with OpenSea on residency programs that onboard new generative artists. Survival hinges on liquidity depth, cross-chain coverage and IP partnerships. As platforms broaden beyond collectibles into identity, finance and supply-chain, scale advantages could tilt the Non-Fungible Token market toward a handful of full-stack service hubs.
Non-Fungible Token Industry Leaders
OpenSea, Inc.
Rarible, Inc.
Crypto.com, Inc.
Mintable, Inc.
Nifty Gateway, LLC
- *Disclaimer: Major Players sorted in no particular order

Recent Industry Developments
- July 2025: Lamborghini partnered with Animoca Brands to debut Temerario car NFTs, blending metaverse exposure with real-world launches.
- June 2025: Mythical Games released FIFA Rivals mobile title featuring blockchain player cards, bringing football fandom into Web3.
- May 2025: OpenSea launched OS2 beta and announced SEA token airdrop, adding 14 chain integrations and lowering fees to 0.5%.
- March 2025: Taproot Wizards’ Bitcoin ordinals auction boosted interest in non-Ethereum NFTs.


Global Non-Fungible Token Market Report Scope
Non-fungible tokens, often referred to as NFTs, are blockchain-based tokens that each represent a unique asset like a piece of art, digital content, or media.
The non-fungible token market is segmented by type (physical asset, digital asset), by application (collectibles, art, gaming, utilities, other applications), by end-users (commercial, personal), by geography (North America, Europe, Asia-Pacific, Latin America, Middle East and Africa). The market sizes and forecasts are provided in terms of value (USD) for all the above segments.
| Physical-Asset NFTs |
| Digital-Asset NFTs |
| Fractional NFTs |
| Dynamic NFTs (dNFTs) |
| Collectibles |
| Art |
| Gaming |
| Utilities (Membership, Ticketing, Loyalty) |
| Music and Media |
| Real-Estate and Metaverse |
| Other Applications |
| Commercial / Enterprise |
| Personal / Individual |
| Institutional Investors |
| Ethereum |
| Solana |
| Polygon |
| Flow |
| BNB Chain |
| Other Chains |
| North America | United States | |
| Canada | ||
| Mexico | ||
| South America | Brazil | |
| Argentina | ||
| Rest of South America | ||
| Europe | Germany | |
| United Kingdom | ||
| France | ||
| Italy | ||
| Spain | ||
| Rest of Europe | ||
| Asia-Pacific | China | |
| Japan | ||
| South Korea | ||
| India | ||
| Australia | ||
| Rest of Asia-Pacific | ||
| Middle East and Africa | Middle East | United Arab Emirates |
| Saudi Arabia | ||
| Turkey | ||
| Rest of Middle East | ||
| Africa | South Africa | |
| Nigeria | ||
| Rest of Africa | ||
| By Type | Physical-Asset NFTs | ||
| Digital-Asset NFTs | |||
| Fractional NFTs | |||
| Dynamic NFTs (dNFTs) | |||
| By Application | Collectibles | ||
| Art | |||
| Gaming | |||
| Utilities (Membership, Ticketing, Loyalty) | |||
| Music and Media | |||
| Real-Estate and Metaverse | |||
| Other Applications | |||
| By End-user | Commercial / Enterprise | ||
| Personal / Individual | |||
| Institutional Investors | |||
| By Blockchain Platform | Ethereum | ||
| Solana | |||
| Polygon | |||
| Flow | |||
| BNB Chain | |||
| Other Chains | |||
| By Geography | North America | United States | |
| Canada | |||
| Mexico | |||
| South America | Brazil | ||
| Argentina | |||
| Rest of South America | |||
| Europe | Germany | ||
| United Kingdom | |||
| France | |||
| Italy | |||
| Spain | |||
| Rest of Europe | |||
| Asia-Pacific | China | ||
| Japan | |||
| South Korea | |||
| India | |||
| Australia | |||
| Rest of Asia-Pacific | |||
| Middle East and Africa | Middle East | United Arab Emirates | |
| Saudi Arabia | |||
| Turkey | |||
| Rest of Middle East | |||
| Africa | South Africa | ||
| Nigeria | |||
| Rest of Africa | |||


Key Questions Answered in the Report
What is the current size of the Non-Fungible Token market?
The Non-Fungible Token market size is USD 64.69 billion in 2026 and is forecast to reach USD 229.67 billion by 2031.
Which NFT segment grows the fastest through 2031?
Dynamic NFTs post the highest growth, expanding at a projected 31.02% CAGR through 2031.
Which application commands the largest share today?
Collectibles hold 48.54% of 2025 transaction value, making them the biggest application segment.
Why are institutions entering the Non-Fungible Token market?
Clearer regulations, insured custodial services and recurring-revenue models such as rentable tokens align with institutional risk frameworks.
Page last updated on:


