
Market Overview
| Study Period | 2020 - 2031 |
|---|---|
| Forecast Data Period | 2026 - 2031 |
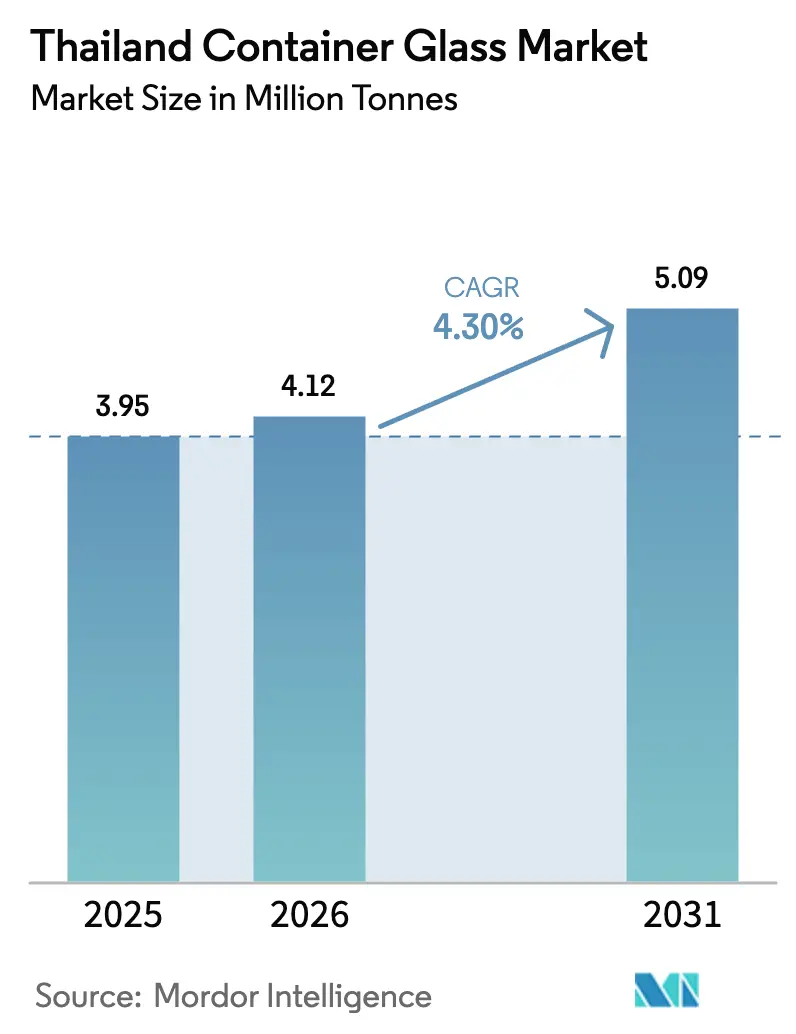
| Base Year Market Size (2025) | 3.95 Million tonnes |
| Market Volume (2026) | 4.12 Million tonnes |
| Market Volume (2031) | 5.09 Million tonnes |
| Growth Rate (2026 - 2031) | 4.30 % |
| Market Concentration | Medium |
Major Players *Disclaimer: Major Players sorted in no particular order Image © Mordor Intelligence. Reuse requires attribution under CC BY 4.0. | |
Thailand Container Glass Market Analysis by Mordor Intelligence
The Thailand Container Glass Market size was valued at 3.95 million tonnes in 2025 and estimated to grow from 4.12 million tonnes in 2026 to reach 5.09 million tonnes by 2031, at a CAGR of 4.30% during the forecast period (2026-2031). Robust tourism-driven beverage consumption, the government’s plastic-waste reduction roadmap, and brand premiumization in both beverage and cosmetics categories underpin this steady expansion. Demand resilience also draws momentum from the voluntary elimination of plastic cap-seals in bottled water, which achieved a 98% reduction among small bottlers by 2019, signaling broad-based acceptance of glass as a sustainable alternative.[1] Thailand’s carbon tax of THB 200 (USD 5.67) per tonne of CO₂ equivalent reinforces the shift, favoring infinitely recyclable glass over single-use plastics. Meanwhile, cost-mitigation incentives tied to cullet usage above 60% partially offset energy-intensive furnace operations, tempering the inflationary impact of rising electricity tariffs.
Key Report Takeaways
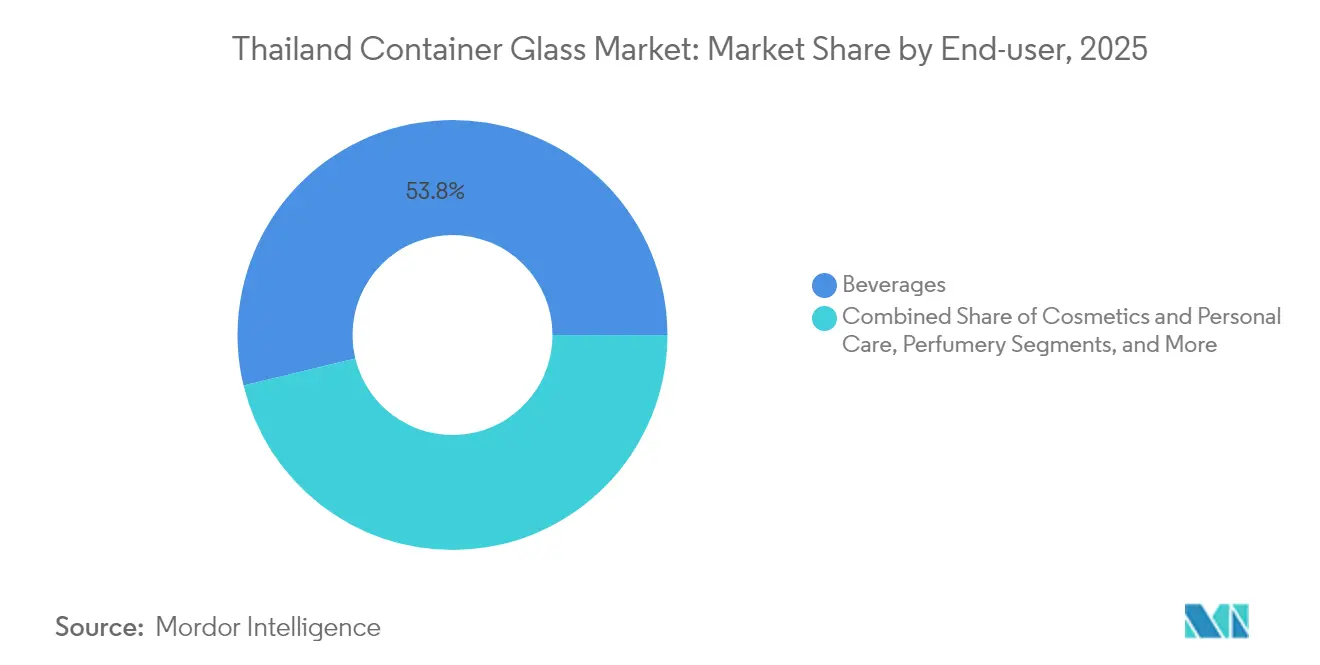
- By end-user, beverages captured 53.78% of the Thailand container glass market share in 2025.
- By color, the Thailand container glass market size for the amber glass segment is projected to grow at 4.92% CAGR between 2026-2031.
Note: Market size and forecast figures in this report are generated using Mordor Intelligence’s proprietary estimation framework, updated with the latest available data and insights as of 2026.
Market Trends and Insights
Drivers Impact Analysis of Thailand Container Glass Market*
| Driver | (~) % Impact on CAGR Forecast | Geographic Relevance | Impact Timeline |
|---|---|---|---|
| Regulatory push for sustainable and recyclable packaging | +1.2% | National - industrial provinces and Bangkok | Medium term (2-4 years) |
| Premiumization in beverage and cosmetics packaging | +0.8% | National - urban centers | Long term (≥ 4 years) |
| Domestic craft-beer and alcoholic consumption uptrend | +0.6% | Tourism zones | Short term (≤ 2 years) |
| Mandatory recycled-content targets in government procurement | +0.4% | National | Medium term (2-4 years) |
| Cannabis beverages driving demand for UV-protective glass | +0.3% | Bangkok metro | Short term (≤ 2 years) |
| Scrap-surcharge rebates for ≥ 60% cullet usage | +0.2% | National | Long term (≥ 4 years) |
| Source: Mordor Intelligence | |||
Regulatory Push for Sustainable and Recyclable Packaging
Thailand’s plastic-waste roadmap eliminates single-use foam food boxes and thin plastic cups by 2025, creating structural substitution toward glass containers. Enforcement extends to microbead bans in cosmetics since 2020 and retailer-led plastic-bag phase-downs, anchoring consumer perception of glass as the low-carbon default. The carbon tax amplifies cost differentials between plastics and glass when lifecycle footprints are considered, encouraging brand owners to specify recycled-content glass. Leading energy conglomerate PTT has already committed to circular waste management targets, reinforcing supply-chain alignment around recyclable packaging. As policy milestones approach, demand visibility rises for producers able to guarantee high-cullet, low-emission output. The combined regulatory environment therefore adds 1.2 percentage points to the forecast CAGR of the Thailand container glass market.
Premiumization in Beverage and Cosmetics Packaging
Brands leverage glass aesthetics to justify higher price points in craft beer, functional drinks, and prestige beauty lines, where packaging communicates authenticity and sustainability. Early success stories in ready-to-drink green tea, whose value expanded from USD 10 million in 2001 to USD 150 million by 2004, underscore consumers’ willingness to trade up when packaging aligns with perceived quality.[2] Social-media imagery further rewards clear, glossy glass surfaces, elevating shelf appeal and driving repeat purchases among eco-conscious millennials. Domestic cosmetic companies translate these cues into product launches that feature thick-wall flint jars and droppers, sustaining a premiumization flywheel that adds 0.8 percentage points to market growth.
Domestic Craft-Beer and Alcoholic Consumption Uptrend
Local breweries experiment with bespoke amber bottles that protect hop volatiles from UV damage, while spirits distillers prefer flint shapes that showcase coloration and purity. The hospitality rebound, fueled by a return of foreign visitors to Bangkok, Phuket, and Chiang Mai, lifts on-premise glass bottle consumption. Sugar-tax reformulations toward premium, lower-sugar beverages further support glass uptake as brands position themselves away from mass-market PET. Aggregate demand from craft beer and premium spirits therefore adds 0.6 percentage points to the Thailand container glass market CAGR.
Cannabis Beverages Driving Demand for UV-Protective Glass
Thailand’s progressive cannabis legislation creates a nascent drink category requiring amber bottles that block UV wavelengths detrimental to cannabinoid stability. Early entrants target niche consumers in Bangkok, but distribution is widening into mainstream retail as product awareness grows. Regulatory discussions on child-resistant closures and accurate THC labeling also favor established glass suppliers, who can integrate compliant features at scale. Though volumes remain low, margins are high, supporting incremental growth of 0.3 percentage points.
Restraints Impact Analysis of Thailand Container Glass Market*
| Restraint | (~) % Impact on CAGR Forecast | Geographic Relevance | Impact Timeline |
|---|---|---|---|
| Rapid penetration of PET and aluminum cans | -1.1% | National - mass-market beverage segments | Long term (≥ 4 years) |
| High furnace energy costs and fuel-switching CAPEX | -0.9% | Major production hubs | Medium term (2-4 years) |
| Stricter 2023 NOx caps delaying furnace rebuilds | -0.5% | All facilities | Short term (≤ 2 years) |
| Fragmented rural cullet-collection logistics | -0.3% | Rural provinces | Long term (≥ 4 years) |
| Source: Mordor Intelligence | |||
Rapid Penetration of PET and Aluminum Cans
Lightweight PET and aluminum offer cost and logistics advantages in low-margin beverage segments, squeezing glass volumes in convenience channels. Indorama Ventures’ downstream PET integration improves supply economics, enabling aggressive pricing into mass-market soft drinks.[3] C-store operators favor lighter packs to optimize shelf replenishment, dulling glass demand in price-sensitive categories and shaving 1.1 percentage points off market CAGR.
High Furnace Energy Costs and Fuel-Switching CAPEX
Electricity tariffs could rise up to 44%, while natural gas volatility drives furnace operating costs that comprise up to one-fourth of total production spend. Generating efficiency gains demands expensive oxy-fuel modifications or alternative-fuel retrofits that many smaller players cannot finance quickly. These energy headwinds therefore trim 0.9 percentage points from the Thailand container glass market growth trajectory.
*Our forecasts treat driver/restraint impacts as directional, not additive. The impact forecasts reflect baseline growth, mix effects, and variable interactions.
Thailand Container Glass Market Segment Analysis
By End-User:
Beverages Extend Leadership Amid Tourism RecoveryBeverages accounted for 53.78% of Thailand container glass market share in 2025, outpacing all other uses by leveraging the tourism rebound and a shift toward premium craft formulations. Within this base, beer maintains volume leadership, but premium spirits and functional drinks now contribute the highest value growth, supported by differentiated bottle shapes, embossing, and tamper-evident closures. The Thailand container glass market size attached to beverages is projected to expand steadily as hospitality footfall returns to pre-pandemic norms.
Growing brand focus on sustainability integrates 30-65% recycled cullet into bottles, reinforcing circular economy positioning while reducing furnace energy intensity. In parallel, non-alcoholic segments such as kombucha and cold-brew coffee migrate to glass to emphasize authenticity and clean-label credentials. The cosmetics and personal care category though smaller today will post a 5.01% CAGR to 2031, reflecting consumer preference for premium glass jars, droppers, and rollers that convey efficacy and eco-consciousness. High-end skincare brands already advertise their bottles as 100% recyclable, reinforcing adoption momentum among domestic shoppers seeking responsible luxury.

By Color:
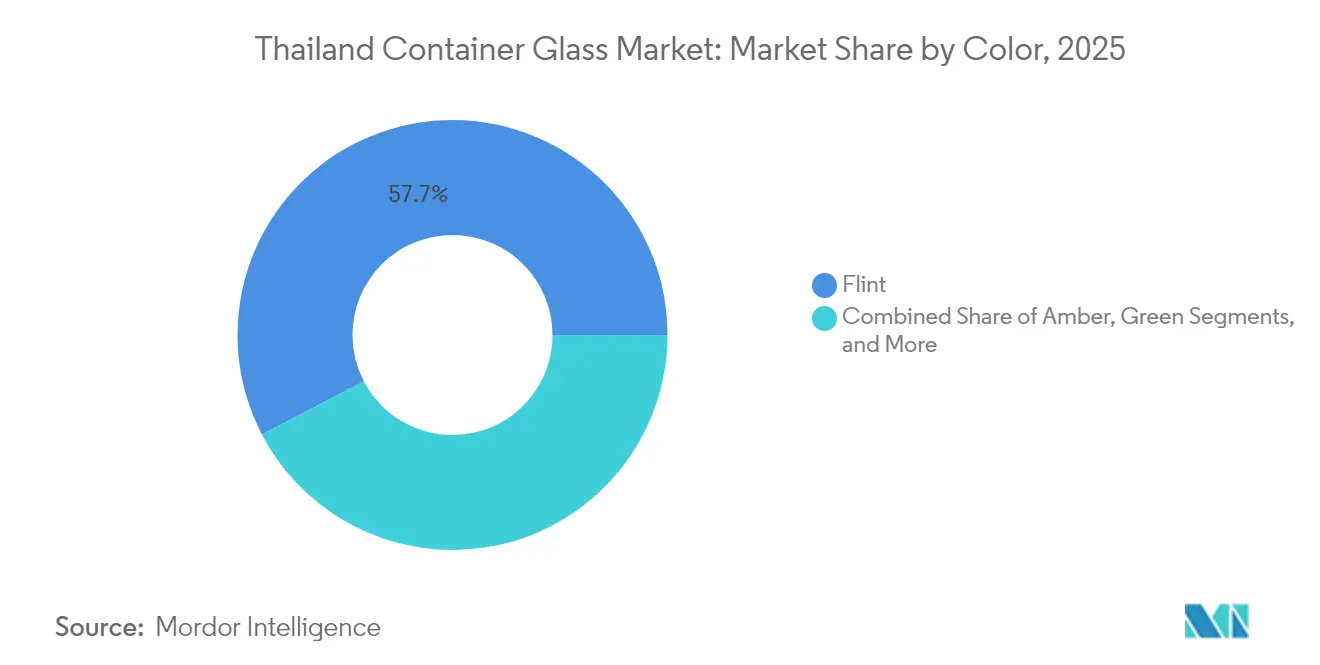
Flint Retains Versatility While Amber ClimbsFlint glass captured 57.65% share of the Thailand container glass market size in 2025 thanks to its clarity and broad compatibility across food, pharmaceutical, and beauty applications. The segment’s dominance stems from visibility advantages that allow consumers to inspect product integrity, particularly in nutritionals and fragrance. Producers achieve flint cullet ratios of roughly 60%, balancing transparency with recycled content requirements.
Amber glass, however, registers a 4.92% CAGR and is set to claim additional share as craft beer, cannabis beverages, and essential-oil formulations favor UV protection. Leading furnaces have optimized colorants to accept up to 70% amber cullet, closing the cost gap with flint offerings while advancing sustainability goals. Although green and specialty hues remain niche, demand persists in imported wine and premium spirit lines where brand equity hinges on distinctive color cues.
Geography Analysis
Thailand container glass market demand clusters around Bangkok, Chonburi, and Rayong, where beverage bottlers, pharmaceutical plants, and distribution hubs concentrate. The Eastern Economic Corridor’s upgraded road and port networks compress lead times between Map Ta Phut furnaces and high-volume customers, lifting supply reliability during peak tourist seasons. Bangkok’s affluent districts and duty-free outlets absorb the lion’s share of premium spirits and prestige cosmetics packaged in flint glass, while beach destinations such as Phuket fuel cyclical spikes in beer bottle orders.
In northern hubs like Chiang Mai, craft breweries and farm-to-table restaurants anchor boutique demand for custom amber bottles. Rural provinces remain underserved by organized cullet collection, prompting government-backed buyback schemes and color-sorted drop-off points to boost recycling rates. Import flows of specialty bottles rarely exceed niche perfume or pharmaceutical formats, given freight-weight penalties and sufficient local capacity.
The baht’s depreciation in 2024 eased export selling prices, enabling select producers to ship small volumes of beverage bottles to neighboring CLMV (Cambodia, Laos, Myanmar, Vietnam) markets; nonetheless, Thailand container glass market activity remains overwhelmingly domestic. As the carbon tax structure harmonizes with ASEAN partners, regional export competitiveness could improve, but near-term growth still rests on Thailand’s own tourism and premiumization drivers.
Regulatory Landscape
Thailand container glass production sits within Thailand's Ministry of Industry framework, where plant licensing and operating controls are governed by the Factory Act B.E. 2535 (1992) and subsequent amendments. Environmental compliance is shaped by the Ministry of Industry notification on emission standards for glass factories (B.E. 2555, 2012), and the study context also points to tighter air-emission compliance, including stricter NOx caps introduced in 2023 that influenced furnace rebuild timing.
On the product side, the Thai Industrial Standards Institute (TISI) maintains container-glass related standards used in qualification and procurement, including TIS 501-2527 for glass containers and TIS 363-2524 for pharmaceutical glass bottles. Policy activity around circularity is shifting toward Extended Producer Responsibility (EPR), with the Pollution Control Department and the Federation of Thai Industries involved in EPR legislation discussions targeted for implementation by 2027, which raises the value of traceable collection and recycled-content supply for container-glass producers.
Value Chain Analysis
The Thailand container glass value chain starts with upstream inputs such as silica sand, soda ash, limestone and colorants, followed by melting, forming and annealing, inspection, packing, and distribution to beverage bottlers, food processors, pharmaceuticals (excluding vials and ampoules), perfumery, and cosmetics and personal care fillers. Producers and their supply partners use mainstream container forming routes such as Press and Blow, Blow and Blow, and Narrow Neck Press and Blow (NNPB) to serve both wide-mouth and narrow-neck formats, with downstream value added through decoration, embossing, and closure and tamper-evidence specifications for premium beverages and beauty applications.
Recycling and cullet handling operate as a parallel loop, since cullet availability affects furnace energy intensity and the cost per tonne. Collection and aggregation remain uneven outside key demand corridors, so industry programs and partnerships are used to improve color-sorted recovery and stabilize cullet quality. Regional operating models also change supply-chain optionality: BJC Glass (within Berli Jucker) runs manufacturing hubs in Vietnam and Malaysia, and as of February 4, 2026, it completed acquisition of the former joint venture shares in those operations, supporting cross-border sourcing and technology standardization that can supply Thailand-focused customers through regional packaging supply chains.
Competitive Landscape
Moderate concentration typifies the Thailand container glass market, where furnace investments run into tens of USD millions, deterring greenfield entrants. Siam Glass Industry and Thai Malaya Glass operate multicombustion furnaces near Bangkok and Eastern Seaboard petrochemical clusters, supplying more than half of national volumes. Berli Jucker leverages its consumer goods and retail arms to lock in downstream demand, while its joint venture with O-I Glass injects global design know-how and high-speed forming technologies.
Multinationals prefer partnering over standalone facilities; O-I’s acquisition of Berli Jucker’s Malaya Glass assets created scale synergies across Southeast Asia and raised cullet utilization benchmarks to 80% in select colors. Technology differentiation now centers on furnace oxy-fuel retrofits and predictive maintenance to temper refractory wear, extending campaign life beyond the 12-year norm. Smaller regional plants grapple with CAPEX hurdles, accelerating consolidation as larger players acquire permits and cullet networks in pursuit of efficiency gains.
White-space opportunities emerge in cannabis beverage packaging, where producers require certified child-resistant closures and UV-protective amber bottles at lower minimum order quantities than mainstream beer lines. Thai Glass Industries and select specialty converters are moving into molded glass droppers and roll-on applicators for high-growth serum and essential oil categories, capturing value where precision dosing and aesthetic appeal command price premiums. Collective strategic moves indicate a market trending toward high-margin niches rather than sheer volume plays.
Thailand Container Glass Industry Leaders
-
Thai Glass Industries Public Company Limited
-
Wellgrow Glass Industry Co., Ltd.
-
Berli Jucker Public Company Limited (BJC Packaging)
-
Ocean Glass Public Company Limited
-
O-I Glass, Inc.
- *Disclaimer: Major Players sorted in no particular order

Thailand Container Glass Market Companies Covered in this Report
- Thai Glass Industries Public Company Limited
- Wellgrow Glass Industry Co., Ltd.
- Berli Jucker Public Company Limited (BJC Packaging)
- Ocean Glass Public Company Limited
- O-I Glass, Inc.
- Ardagh Group S.A.
- Verallia S.A.
- Nihon Yamamura Glass Co., Ltd.
- Saverglass SAS
- Heinz-Glas GmbH & Co. KGaA
- Gerresheimer AG
- Vetropack Holding AG
- Asahi Glass Public Company Limited (AGC)
- Sisecam Group
- AGI Glaspac (HSIL Ltd.)
- PT Culletprima Setia (Indonesia)
- Union Glass Public Company Limited
Market Opportunities and Future Outlook
A key whitespace runs through higher-cullet, lower-emission container glass, supported by Thailand's national recycling performance target for glass packaging of 86% collection and recycling by 2027, up from 76% in 2022. As EPR workstreams progress under the Pollution Control Department and the Federation of Thai Industries, producers and brand owners that can document recycled-content and collection pathways gain a clearer path to meet procurement requirements and sustainability commitments, particularly in beverages (53.78% of 2025 volume) and premium cosmetics where packaging claims are actively marketed.
Lightweighting and productivity upgrades also offer a practical route to offset energy cost pressures and improve glass competitiveness versus PET and cans. Adoption of NNPB technology supports wall-thickness reduction and lower pack weight, and company programs tied to higher cullet use point in the same direction, including BJC Glass initiatives to increase cullet utilization to reduce energy intensity and carbon emissions. The report context further highlights higher-margin niches where compliance and performance drive specification-based demand, such as amber bottles for UV-sensitive formulations (including cannabis beverages) and pharmaceutical-grade bottles aligned to TISI requirements (for example, TIS 363-2524), supporting differentiated runs beyond commodity beverage SKUs.
Recent Industry Developments in Thailand Container Glass Market
- July 2026: Berli Jucker Public Company Limited (BJC) - Thai Glass Industries Public Company Limited (TGI) CEO Mrs. Thapanee Techajareonvikul conducted a factory visit to reinforce strategic alignment and growth focus. The visit points to a renewed emphasis on glass packaging operations and potential capex alignment.
- May 2026: Ocean Glass Public Company Limited: Strategic shift to a Lifestyle Premium Brand model, including Ocean x Butterbear collaboration. Ocean Glass aims to capture premium demand through collaboration-led, differentiated product lines.
- May 2026: Berli Jucker Public Company Limited (BJC) - Thai Glass Industries Public Company Limited (TGI): Partnership with MASCI and C3Leng to launch a sustainable school waste management initiative for glass collection. The collaboration supports extended producer responsibility and cullet-recovery efforts to improve sustainability and supply-chain resilience.
Thailand Container Glass Market Report Scope and Research Methodology
Market Definition and Coverage
This market covers container glass made in Thailand and sold into packaging uses, mainly bottles and jars used to pack beverages, food, cosmetics and personal care, pharmaceuticals, and perfumery. The sizing is built in volume terms (tonnes) to match how plants plan capacity and how buyers contract supply.
Scope exclusions: It excludes flat glass, fiberglass, tableware, and other non-container glass products, and it does not count secondary packaging materials such as caps, labels, or cartons.
Segments Covered in This Report
- By End-user
- Beverages
- Alcoholic
- Beer
- Wine
- Spirits
- Other Alcoholic Beverages (Cider and Other Fermented Drinks)
- Non-Alcoholic
- Juices
- Carbonated Drinks (CSDs)
- Dairy Product Based Drinks
- Other Non-Alcoholic Beverages
- Alcoholic
- Food (Jam, Jelly, Marmalades, Honey, Sausages and Condiments, Oil, Pickles)
- Cosmetics and Personal Care
- Pharmaceuticals (excluding Vials and Ampoules)
- Perfumery
- Beverages
- By Color
- Green
- Amber
- Flint
- Other Colors
Data Sources, Market Sizing, and Validation
Desk Research
Desk work was used to set the outer limits of demand and supply in Thailand before the model structure was set. We relied on public and official sources such as Thailand Customs trade statistics for glass container flows, the Thai Industrial Standards Institute for product and quality references, the Pollution Control Department for packaging and waste policy context, and the Department of Alternative Energy Development and Efficiency for energy and fuel signals that affect furnace economics.
We also reviewed company filings and investor presentations for capacity mentions, plant upgrades, and utilization commentary. In parallel, we checked credible press and association websites connected to packaging and recycling. Where paid subscriptions were needed, they were limited to standardizing company financials and tracking patent activity linked to lightweighting and cullet use. These desk sources are not exhaustive, and we used additional public documents to cross-check and clarify key points during the work.
Primary Interviews and Surveys
Primary work focused on validating the Thailand demand pool and the practical constraints on supply, since public sources do not always show product mix shifts by end use. We spoke with executives, functional leaders, and managers across manufacturers, packaging buyers, and recycling and cullet-linked participants to confirm assumptions on ordering cycles, import substitution, and pricing behavior.
To avoid a single-view bias, we deliberately covered a spread of respondent types and seniority. We then re-checked the key inputs when any desk signal and interview feedback did not align.
Distribution of primary research fieldwork respondents
| Company type | Respondent position |
|---|---|
| Top tier: 30% | CXOs: 13% |
| Mid tier: 55% | Functional/Unit leaders: 41% |
| Smaller Players: 15% | Managers: 46% |
Market-Sizing & Forecasting
The core sizing uses a top-down approach where Thailand container glass demand is reconstructed from packaging consumption signals and then aligned to realistic domestic supply capacity and trade movements. After setting the demand pool, we corroborated it with selective bottom-up checks, mainly sampled output by plant, typical utilization ranges, and a simple volume build using buyer order patterns (volume per SKU and frequency) to correct overstatement.
A few inputs mattered more than others, so we tracked them closely during modeling. These include container glass output capacity by furnace line, furnace rebuild schedules that temporarily reduce throughput, cullet availability and usage rates because they change batch needs, the mix shift across beverage and food packaging that affects average container weight, and import and export tonnage to avoid double counting local shipments. Where bottom-up detail was thin, we used conservative utilization bands and cross-checked with trade data. When the implied volumes moved outside the expected operating range, we re-contacted interviewees to reconcile the drivers.
For forecasting, we used scenario analysis to reflect how energy costs, recycling collection effectiveness, and premium packaging demand can shift the market differently year to year. Scenario weights were set using expert consensus from interviews, then we applied trend lines to the key drivers so the final path remains explainable.
Data Validation & Update Cycle
Outputs are validated in layers so that one weak input does not drive the final number. We compare the model to independent signals such as plant capacity and downtime timing, trade balances, and the implied per-capita packaging intensity, then we investigate any unusual jumps before sign-off.
A second analyst reviews the assumptions, arithmetic, and unit conversions. A final pass checks whether the story and the numbers still match the latest public updates. Reports are refreshed annually, and interim updates are made when material events occur such as major capacity additions, extended furnace shutdowns, or policy changes that alter recycling and packaging choices.
Mordor Intelligence's Thailand Container Glass Market Size Versus Other Published Estimates
Published size figures for Thailand container glass often do not align because the unit of measure, the scope line around packaging applications, and how trade is treated vary across sources. Some sources report value in USD, while others use volume, which then depends on how container weight, mix, and pricing assumptions are set.
The biggest gap drivers usually come from whether figures include non-container glass, how much imported filled product is implicitly treated as local packaging demand, and whether output is counted at the plant gate or at the buyer level. Differences also show up when one estimate uses a single-year assumption for utilization or cullet availability, while another refreshes those inputs more frequently, which is why the spread below is visible in the same base year.
Benchmark comparison
| Source | Market Size | Gaps in Research Methodology |
|---|---|---|
| Mordor Intelligence | USD 3.95 M (2025) | |
| Trade Journal A | USD 2.20 M (2025) | Often presented as glass packaging placed on the market, which can exclude industrial bottle output and may net out certain refillable flows, thereby pulling the apparent tonnage down. |
| Regional Consultancy B | USD 4.60 M (2025) | May be closer to nameplate production, where utilization downtime, furnace rebuild impacts, and net exports are not fully adjusted, which can inflate the effective domestic market volume. |
The table shows that most of the spread comes from how production is converted into domestic demand, especially once downtime and net trade are accounted for, a scope choice applied by Mordor Intelligence. By keeping the volume logic tied to capacity reality and packaging demand signals, the final estimate stays repeatable and easier to reconcile when new plant or trade data appears.
Key Questions Answered in the Report
How large is the Thailand container glass market in 2026?
It totals 4.12 million tonnes in 2026 and is forecast to reach 5.09 million tonnes by 2031 at a 4.30% CAGR.
Which end-user category leads demand?
Beverages command 53.78% of national volume, buoyed by tourism recovery and craft beer growth.
Why is amber glass growing faster than other colors?
Cannabis beverages and craft beers require UV protection, pushing amber glass to a 4.92% CAGR through 2031.
What policy actions favor glass over plastic?
Thailand’s plastic-waste phase-out by 2027, carbon tax of THB 200 per tonne CO₂, and cullet incentives above 60% collectively strengthen glass competitiveness.
How does rising energy cost affect producers?
Electricity and gas volatility raises furnace expenses, pressuring margins for smaller plants and encouraging consolidation among larger, more efficient players.