
Market Overview
| Study Period | 2020 - 2031 |
|---|---|
| Forecast Data Period | 2026 - 2031 |
| Base Year Market Size (2025) | 4.27 Million tonnes |
| Market Volume (2026) | 4.47 Million tonnes |
| Market Volume (2031) | 5.62 Million tonnes |
| Growth Rate (2026 - 2031) | 4.69 % |
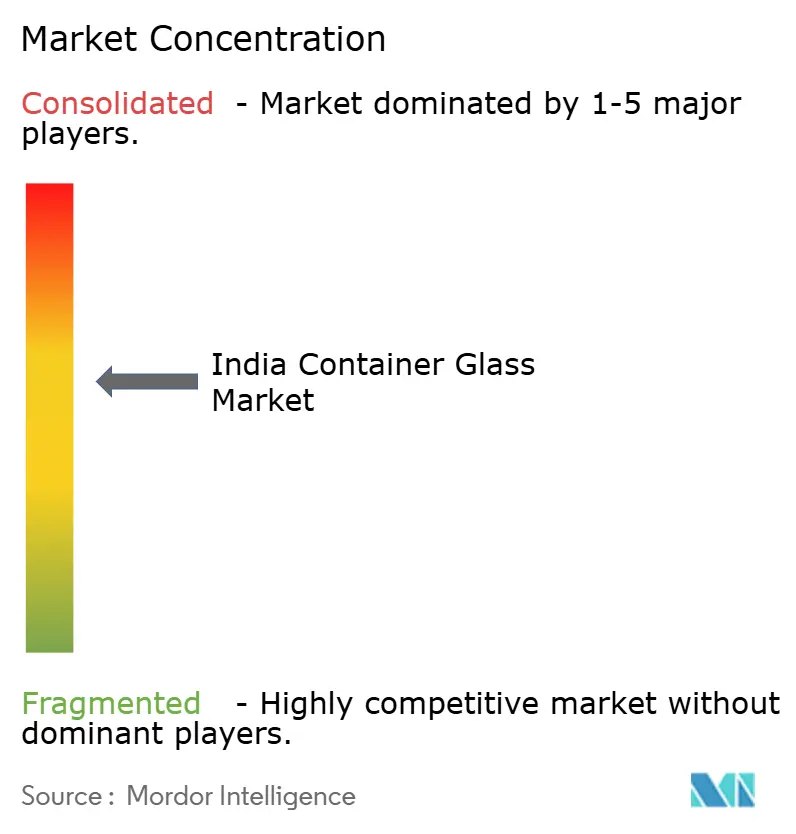
| Market Concentration | Medium |
Major Players *Disclaimer: Major Players sorted in no particular order Image © Mordor Intelligence. Reuse requires attribution under CC BY 4.0. | |
India Container Glass Market Analysis by Mordor Intelligence
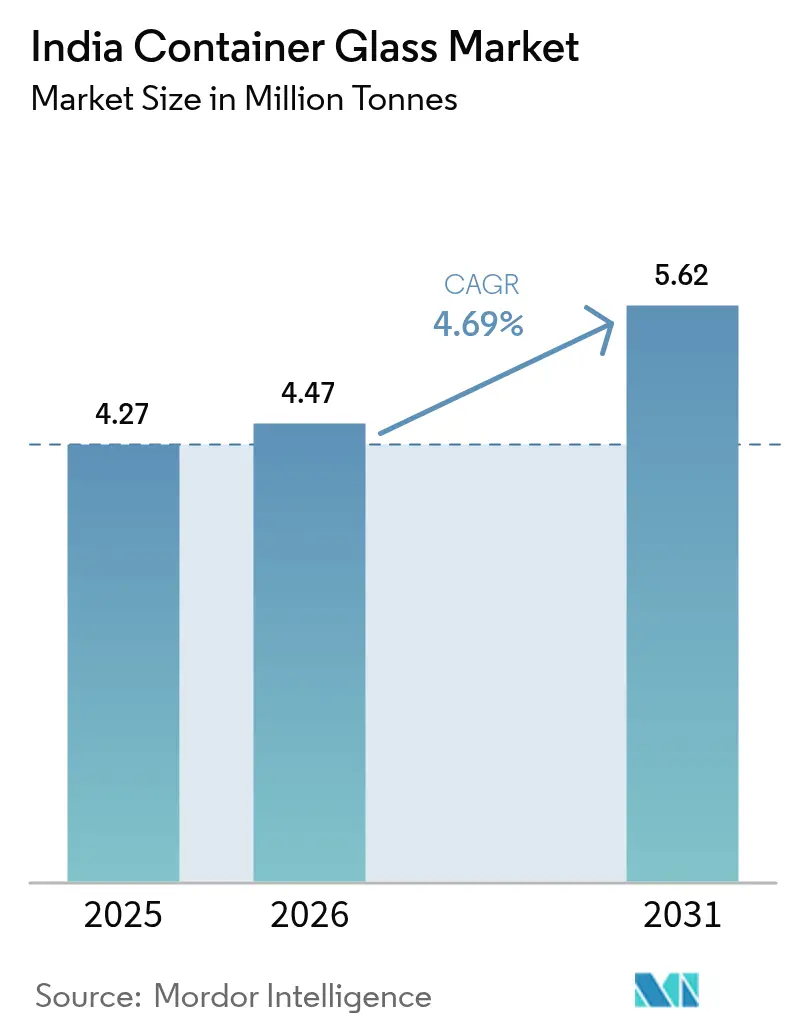
The India container glass market size is expected to increase from 4.27 million tonnes in 2025 to 4.47 million tonnes in 2026 and reach 5.62 million tonnes by 2031, growing at a 4.69% CAGR over 2026-2031. Rising disposable income in metro clusters, a policy tilt against single-use plastics, and capacity-expansion projects by leading furnace operators are steering sustained demand momentum. Breweries, wineries, and premium spirit bottlers have widened specification ranges, encouraging glassmakers to invest in narrow-neck press-and-blow lines and lightweighting technology. Simultaneously, cosmetic and personal-care brands continue to switch from rigid plastics to flint and amber flacons to reinforce luxury cues and comply with emerging refill-ready mandates. Natural-gas price volatility and draft carbon-pricing frameworks, however, are likely to temper smaller manufacturers’ margins, accelerating consolidation within the India container glass market.
Key Report Takeaways
- By end-user, beverages accounted for 64.83% of the India container glass market share in 2025, while cosmetics and personal care recorded the fastest 4.82% CAGR through 2031.
- By color, flint glass led with 41.62% volume share in 2025, whereas amber glass is projected to expand at a 4.75% CAGR to 2031.
Note: Market size and forecast figures in this report are generated using Mordor Intelligence’s proprietary estimation framework, updated with the latest available data and insights as of 2026.
India Container Glass Market Trends and Insights
Drivers Impact Analysis*
| Driver | (~) % Impact on CAGR Forecast | Geographic Relevance | Impact Timeline |
|---|---|---|---|
| Packaged Food and Beverage Boom | +1.2% | National, early gains in Mumbai, Delhi NCR, Bengaluru | Medium term (2-4 years) |
| Alcohol Consumption Growth | +0.9% | Maharashtra, Karnataka, Telangana, Uttar Pradesh | Short term (≤2 years) |
| ESG Commitments and Premium Perception | +0.7% | Metro and Tier-1 cities | Medium term (2-4 years) |
| Government Push Against Single-Use Plastics | +1.1% | Coastal states and union territories | Short term (≤2 years) |
| GST Differential Favouring Glass Packaging | +0.5% | National | Long term (≥4 years) |
| Expansion of Cold-Chain Logistics | +0.6% | National, spill-over to semi-urban hubs | Medium term (2-4 years) |
| Source: Mordor Intelligence | |||
Packaged Food and Beverage Boom
Organized retail penetration moved into the mid-teens by 2025, prompting premium juice, artisanal preserve, and cold-pressed-juice brands to migrate toward glass containers that signal purity and help extend shelf life without chemical preservatives. Product lines adopting 200-milliliter to 500-milliliter flint jars and bottles command retail premiums approaching 25%, cushioning higher packaging costs. Ongoing harmonization of Bureau of Indian Standards specifications for thermal-shock resistance is raising the entry bar for low-cost imports, reinforcing domestic furnace upgrades. Metro markets lead adoption today, yet distributor surveys indicate Tier-2 urban clusters will generate most incremental volume from 2027 onward. This trajectory supports a meaningful uplift to the India container glass market over the medium term.[1]Bureau of Indian Standards, “Indian Standards for Glass Containers,” bis.gov.in
Alcohol Consumption Growth
India shipped more than 1.1 billion alcoholic-beverage cases in 2024, and premium beer, single-malt whisky, and imported wine collectively grew at double-digit rates in 2025. These categories increasingly specify bespoke embossing, heavier punt depths, and amber or green tints to protect flavor compounds, features that plastics and cans struggle to replicate. State excise reforms permitting direct-to-consumer sales by microbreweries compressed route-to-market times and lifted orders for 330-milliliter returnable bottles that withstand roughly 18 trip cycles before cullet diversion. Tooling lead times of fewer than four months enable glass suppliers to match brewers’ rapid SKU launches, outpacing can-line commissioning schedules. The quick cadence of label introductions underpins short-term volume tailwinds for the India container glass market.
Government Push Against Single-Use Plastics
The nationwide ban on nineteen single-use plastic items took effect in July 2022, and subsequent state-level enforcement intensified through 2025. Pollution-control authorities in Tamil Nadu and Goa conducted thousands of raids, heightening the risk for retailers using noncompliant packaging and nudging food-service operators toward glass tumblers and condiment jars. Institutional caterers have already shifted roughly one-third of displaced rigid-plastic cup demand to glass formats, supported by deposit-refund loops that recapture cullet at competitive rates. While harmonized enforcement remains uneven, high-profile penalties have elevated compliance urgency, sustaining a positive demand shock for the India container glass market.
ESG Commitments and Premium Perception
Consumer-goods multinationals have embedded recyclability and recycled-content thresholds in supplier scorecards that explicitly rank glass above multilayer laminates. Household-panel surveys show nearly seven in ten urban consumers perceive glass packaging as more premium and safer than plastic, supporting price-uplift strategies across cosmetics, fragrances, and gourmet condiments. Extended Producer Responsibility rules now require annual disclosure of take-back volumes, and glass delivers an intrinsic advantage through established returnable-bottle pools. Supply-chain reconfiguration, including cullet-processing partnerships with municipalities, typically spans two budget cycles, situating the impact in the medium term. The reputational halo created by glass closely aligns with brand storytelling objectives, reinforcing its adoption curve.[2]Central Pollution Control Board, “Plastic Waste Monitoring Dashboard,” cpcb.nic.in
Restraints Impact Analysis*
| Restraint | (~) % Impact on CAGR Forecast | Geographic Relevance | Impact Timeline |
|---|---|---|---|
| Plastic and Flexible Packaging Substitution Erodes | -0.8% | National, stronger in cost-sensitive segments | Long term (≥ 4 years) |
| Energy-Intensive Melting and CO₂ Emissions Raise Cost Risks | -0.6% | Manufacturing hubs, particularly Firozabad cluster | Medium term (2-4 years) |
| Raw Material Price Volatility Squeezes Smaller Furnaces | -0.6% | Regional manufacturers, MSME clusters | Short term (≤ 2 years) |
| Gas Price Spike in Taj Trapezium Zone Curtails Firozabad Capacity | -0.4% | Uttar Pradesh, particularly Firozabad region | Short term (≤ 2 years) |
| Source: Mordor Intelligence | |||
Plastic and Flexible-Pack Substitution
Rigid plastic bottles and spouted pouches offer 40-50% lower unit costs, weigh far less, and integrate readily with high-speed aseptic fillers, attributes that continue to win share in juice, edible-oil, and dairy categories. A 2025 regulatory amendment allowing recycled PET for direct food contact further accelerated deployment of lightweight bottles in value-conscious rural regions. Stand-up pouches already claim more than one-fifth of the ketchup and sauce segment, drawing volume away from glass. The payback period for converting existing glass-fill lines to flexible formats is roughly three years, suggesting substitution pressure will persist through the medium term. Lower cullet-collection rates outside metropolitan areas also keep recycled-content penetration below global benchmarks, blunting cost-relief for glass producers.
Energy-Intensive Melting and CO₂ Cost Risks
Container-glass furnaces consume up to 5.2 gigajoules of thermal energy per tonne, making profitability highly sensitive to natural-gas and power tariffs. Gujarat and Maharashtra spot prices for natural gas averaged INR 45-48 per cubic meter in the first half of 2026, a 12% year-on-year rise that trimmed sector EBITDA margins by roughly two percentage points. Draft Performance, Achieve, and Trade targets call for a 15% reduction in specific energy consumption from 2026-2029, forcing retrofits such as oxy-fuel or hybrid-electric melters that require capital outlays of INR 80-150 crore per 300-tonne-per-day line. Parallel discussions on domestic carbon pricing could add INR 600-750 per tonne to production costs if enacted, reducing parity with aluminum cans whose emissions footprint falls sharply at high recycled-content levels. These headwinds disproportionately burden mid-sized furnaces lacking captive solar or waste-heat recovery.[3]Bureau of Energy Efficiency, “Performance, Achieve and Trade Draft Cycle 2026-2029,” beeindia.gov.in
*Our forecasts treat driver/restraint impacts as directional, not additive. The impact forecasts reflect baseline growth, mix effects, and variable interactions.
Segment Analysis
By End-User: Beverages Anchor Volume, Cosmetics Propel Premium Demand
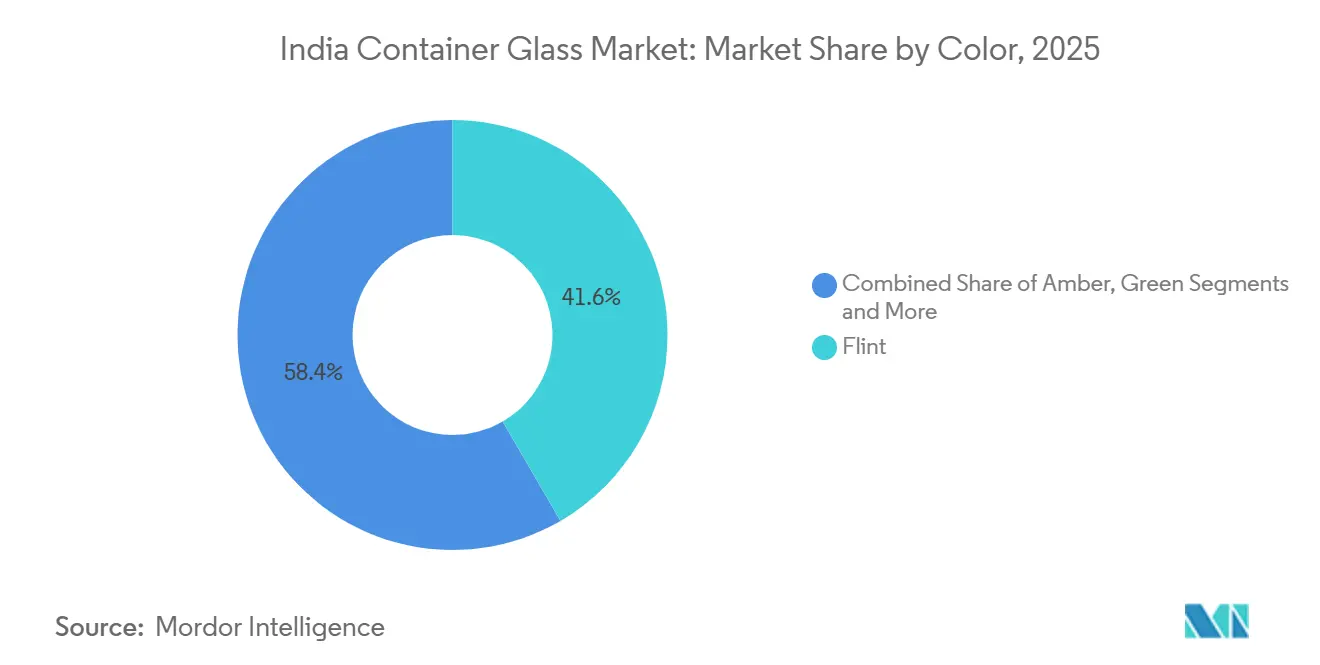
Beverages supplied 64.83% of total tonnage in 2025, cementing the segment as the principal revenue engine for the India container glass market. Alcoholic drinks accounted for the bulk, with beer alone accounting for more than half of glass demand, followed by spirits and wine. Non-alcoholic fillers continue to rationalize stock-keeping units toward PET in juice and flavored-milk lines, but carbonated-soft-drink bottlers still rely on returnable glass for cost-effective closed-loop logistics. Food applications-jams, sauces, pickles, and baby nutrition-account for just below one-fifth of output yet exhibit solid 4.3% compound growth as organic and preservative-free labels expand distribution in Tier-2 cities. Cosmetics and personal care, although accounting for only 10% of volume, outpaced all other end users with a 4.82% CAGR, reflecting the premiumization wave sweeping skincare and Ayurvedic formulations.
Shifts in consumer preferences are reflected starkly in pricing structures. Craft beer bottles with bespoke embossing and heavier base weights fetch 15-20% price premiums over standard returnable formats, strengthening margins for flint and amber supply contracts. Refillable cosmetics initiatives pioneered by domestic beauty retailers lower per-use packaging costs beyond the third refill cycle, deepening long-run customer ties. Food-grade flint jars equipped with tamper-evident closures support a growing portfolio of artisanal condiments whose shelf life must exceed 18 months. Regulatory upgrades to glass specifications for food and beverage packaging continue to raise technical thresholds, deterring low-cost imports and consolidating share gains inside the India container glass market.



By Colour: Flint Retains Leadership, Amber Accelerates on Light-Sensitive Uses
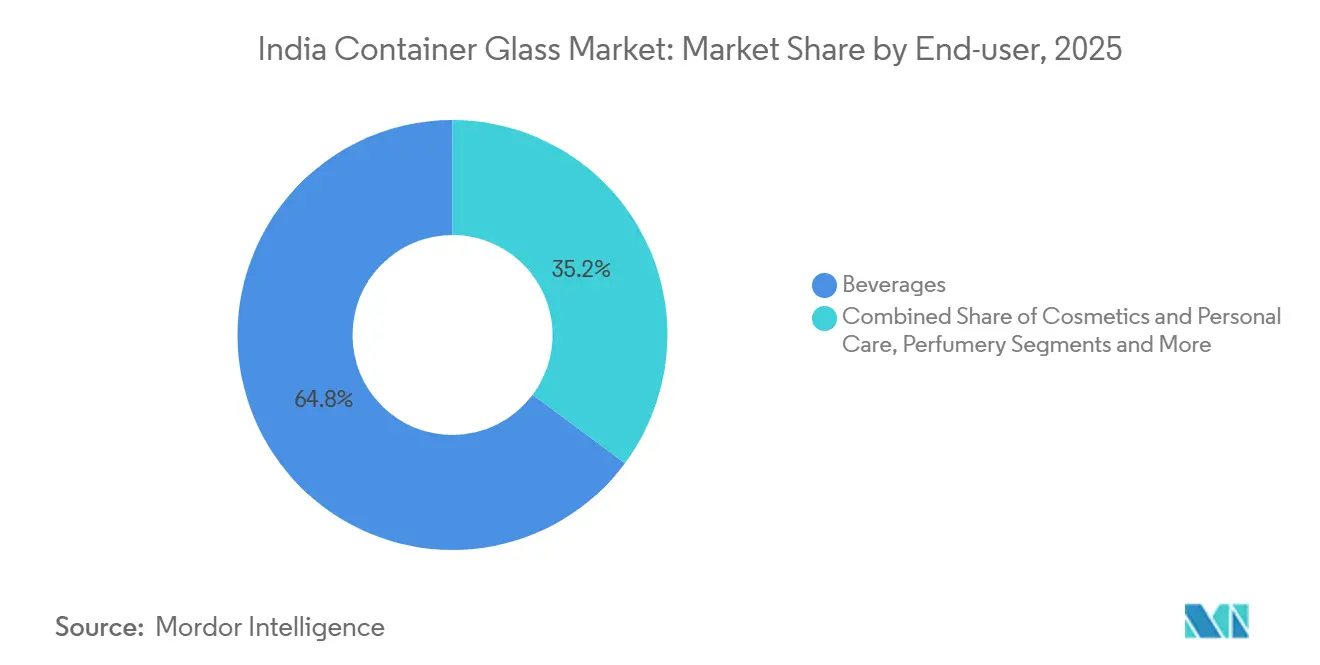
Flint retained a commanding 41.62% of total output in 2025 and remains the default substrate for categories where transparency underpins merchandising. Amber followed with roughly one-third of the share yet delivered the fastest 4.75% CAGR due to its enhanced ultraviolet protection, prized by brewers, pharmaceutical syrup makers, and nutraceutical blenders. Green glass, historically favored by European wine shippers, now grows modestly as domestic vineyards pivot toward flint to differentiate modern labels. Boutique hues-including cobalt blue and jet black-together represent a mid-single-digit share, concentrated in perfumery and high-end condiments.
Advances in technology are beginning to erode the cost premium traditionally carried by amber. Iron-oxide-reduced flint formulas launched in 2025 incorporate up to 20% cullet without compromising clarity, shaving INR 800-1,000 per tonne off batch costs and shrinking the differential with colored variants. The Bureau of Indian Standards updated pharmaceutical-container norms in 2024 to require amber for formulations containing photolabile actives, embedding structural demand growth beyond the forecast horizon. Higher collection targets for colored glass under Extended Producer Responsibility guidelines may, however, nudge some brand owners toward standardized flint glass to simplify reverse logistics streams. These cross-currents will keep color-mix planning central to utilization strategies across the India container glass market size spectrum.
Geography Analysis
Western India dominates installed furnace capacity, and proximity to Gujarat’s soda-ash and natural-gas corridors helps producers contain input costs. Maharashtra’s beverage cluster around Mumbai and Nashik anchors consistent demand for amber and flint beer bottles, while Gujarat’s pharmaceutical belt powers stable off-take of medical-grade amber containers. Uttar Pradesh and Madhya Pradesh have emerged as new investment magnets since 2025, buoyed by lower land costs and government incentives that have lured brownfield and greenfield builds.
Southern states illustrate the growing impact of anti-plastic enforcement on regional consumption patterns. Tamil Nadu’s stepped-up raids against banned items funneled institutional catering demand toward glass cups and bowls, boosting cullet availability and lowering feedstock costs for nearby furnaces. Karnataka’s craft-beer boom, centered in Bengaluru, sustains brisk bottle rotation, underpinning India's container glass market share in the hospitality channel. Telangana’s adoption of direct-to-consumer excise rules further shortens route-to-market cycles for boutique beverages, reinforcing regional glass uptake.
Northern and eastern corridors remain comparatively under-penetrated but present long-term upside. Large household sizes and traditionally low per-capita packaging spend in Bihar and Odisha still skew towards flexible formats, yet rising income and e-commerce exposure are nudging premium food and beauty brands to extend distribution there. Logistics efficiencies gained from centrally located new furnaces in Madhya Pradesh are poised to trim freight outlays into these hinterland zones, making glass more cost-competitive against lightweight rivals. Collectively, geographic diversification reduces over-reliance on western hubs and broadens the addressable base for the India container glass market.
Regulatory Landscape
India continues to tighten packaging and product-compliance requirements that indirectly lift the technical and documentation bar for glass-based packaging supply chains. The nationwide ban on 19 single-use plastic items, in force since July 2022, alongside stepped-up enforcement in states such as Tamil Nadu and Goa through 2025, has supported substitution toward reusable and recyclable formats including glass in food service and retail.
On standards and compliance, the Bureau of Indian Standards (BIS) remains the key certifying authority behind Quality Control Orders (QCOs) administered by the Ministry of Commerce and Industry. The government issued the Insulated Flask, Bottles and Containers for Domestic Use (Quality Control) Order, 2024 (March 2024) and notified the Laboratory Glassware (Quality Control) Amendment Order, 2024 (December 2024), reinforcing a broader shift toward compulsory conformity assessment and BIS Standard Mark requirements for specified glass-related categories. Parallel policy discussions around packaging Extended Producer Responsibility (EPR) have increased the focus on take-back, recycled-content accounting, and traceability for glass streams, pushing brand owners and packers to formalize reverse logistics and cullet sourcing arrangements.
Value Chain Analysis
The value chain begins with upstream inputs (silica sand, soda ash, limestone, additives, and cullet), followed by batch preparation and melting in continuous-run furnaces that produce (press-and-blow or narrow-neck press-and-blow) containers. Annealing, inspection, and secondary processes such as decoration and labeling support the finished output, which moves through distributors or direct contracts with beverage bottlers, food processors, and pharma and cosmetics fillers. Return flows for glass and cullet recovery concentrate in metro clusters where collection economics are strongest.
Energy is the most sensitive link in this chain, since container-glass furnaces are typically gas-fired and cannot be cycled without yield and asset-life penalties. Natural gas can account for roughly 30-35% of production costs, and in 2026 the supply chain faced disruption when the government invoked the Essential Commodities Act, 1955, capping industrial gas usage at 80% of the previous six-month average amid West Asia-linked fuel constraints. Industry bodies such as the All India Glass Manufacturers Federation (AIGMF) sought prioritization for container glass supplying food, beverage, and pharmaceutical applications, while reported temporary shutdowns at a portion of units highlighted downstream impacts for packagers and raised the value of captive power, fuel-flexibility, waste-heat recovery, and secured cullet streams.
Competitive Landscape
The top five suppliers-AGI Greenpac, Hindusthan National Glass, PGP Glass, Verallia India, and Borosil-collectively controlled a high share of installed tonnage in 2025, reflecting moderate consolidation in the India container glass industry. Scale enables these players to spread the capital burden of oxy-fuel burner retrofits and hybrid electrification across multiple lines, negotiate multi-year gas contracts, and operate captive cullet-processing units that lock in feedstock at below-market rates. Regional specialists such as Sunrise Glass and Pragati Glass focus on niche formats, for example miniature spirit bottles and wide-mouth condiment jars, earning 12-15% price premiums that partly offset their smaller volume base.
Strategic hedging against substitution risk is evident. AGI Greenpac approved a Rs 1,000 crore aluminum-can facility slated for commercial rollout in 2028, mirroring Ball Corporation’s earlier USD 115 million twin-plant investment. PGP Glass commissioned a 120-tonne-per-day electric-fusion furnace cutting CO₂ emissions by more than half, positioning the company ahead of potential carbon levies. Gerresheimer’s plan to spin off its moulded-glass unit by mid-2026 opens acquisition windows for private-equity consolidators eyeing premium cosmetics packaging.
Process innovation remains central to margin defense. Waste-heat recovery retrofits cropping up across western furnaces deliver double-digit cuts in specific energy consumption, while in-line digital inspection upgrades reduce rejects and boost usable yield. Several leaders have signed memoranda with municipal corporations to secure segregated cullet streams at INR 4-6 per kilogram versus INR 8-10 in open markets, anchoring cost competitiveness. The rising compliance bar under Quality Control Orders and Extended Producer Responsibility rules further elevates fixed-cost thresholds, creating a moat around incumbents and reinforcing the cohesion of the India container glass market.
India Container Glass Industry Leaders
Haldyn Heinz Fine Glass Private Limited
AGI Greenpac Limited
CANPACK India Private Limited
Hindusthan National Glass & Industries Limited
PGP Glass Private Limited
- *Disclaimer: Major Players sorted in no particular order

Market Opportunities and Future Outlook
Near-term whitespace centers on improving operating resilience and lowering unit energy intensity across the installed base, driven by the 2026 fuel-supply shock that triggered production curtailments and price increases in parts of the market. This has increased buyer interest in supply assurance and multi-sourcing, creating room for producers that can demonstrate tighter delivery performance, improved defect rates, and energy-stable production through furnace upgrades and digital inspection. It also creates demand for service providers that can strengthen cullet processing, sorting, and traceability.
Sustainability-led procurement and packaging compliance are creating clearer pockets of opportunity in recycled-content glass and decarbonization pathways. Draft EPR discussions for packaging (paper, glass, and metal) have raised the prominence of recycled-content targets and reporting, making municipal and aggregator partnerships for segregated cullet more valuable for glassmakers and brand owners. Company actions reinforce this direction: AGI Greenpac reported progress on recycled cullet use and emissions-intensity reduction in FY2025-26, and joined the Glass Futures research network in 2026, indicating active R&D and collaboration on low-carbon production. At the same time, portfolio diversification by large packaging players, including investments into beverage-can manufacturing, increases competitive pressure on glass for selected beverage SKUs and raises the premium on lightweighting, returnable-bottle loops, and differentiated decoration where glass retains brand and shelf-appeal advantages.
Recent Industry Developments
- May 2026: AGI Greenpac commenced construction of an INR 1,000 crore aluminium can manufacturing facility in Hathras, Uttar Pradesh. The move expands the companys beverage-packaging portfolio beyond container glass and strengthens its ability to offer brand owners alternate formats during periods of glass supply or energy volatility.
- March 2026: CANPACK Group warned customers about potential production interruptions in its India operations amid Middle East-linked fuel availability constraints. The notice underscored the exposure of continuous-run glass operations to LPG and LNG disruptions and prompted packers to emphasize supply assurance and contingency sourcing.
- March 2025: AGI Greenpac board approved an investment of about INR 700 crore for a new greenfield container-glass plant in Madhya Pradesh with roughly 500 tonnes per day capacity. The project directly adds domestic melting and forming capacity and aligns with demand from beverages, food, and pharmaceutical packagers seeking local, specification-compliant supply.


Research Methodology Framework and Report Scope
Market Definition and Coverage
This market covers container glass manufactured and sold in India for packaging uses, mainly bottles and jars supplied to beverage, food, and other consumer end uses. The sizing is expressed in production and consumption-equivalent volume, measured in tonnes.
Scope exclusions: Excludes flat glass, fiberglass, tableware, labware, and decorative glass products that are not used as packaging containers.
Segmentation Overview
- By End-user
- Beverages
- Alcoholic
- Beer
- Wine
- Spirits
- Other alcoholic beverages
- Non-alcoholic
- Juices
- Carbonated drinks (CSDs)
- Dairy-product-based drinks
- Other non-alcoholic beverages
- Alcoholic
- Food
- Cosmetics and personal care
- Pharmaceuticals (excl. vials & ampoules)
- Perfumery
- Beverages
- By Colour
- Green
- Amber
- Flint
- Other colours
Data Sources, Market Sizing, and Validation
Desk Research
Desk research starts with public datasets that can anchor demand and supply signals to real activity in India. We refer to sources such as the Ministry of Statistics and Programme Implementation for manufacturing and price indices, the Directorate General of Commercial Intelligence and Statistics for import and export trends, and the Central Pollution Control Board for compliance signals that influence packaging choices.
To keep the demand side realistic, we also use sources such as the Food Safety and Standards Authority of India notifications, the Reserve Bank of India macro series, and peer reviewed packaging and materials journals to sanity-check technology and recycling constraints. Company annual reports, investor presentations, and reputable press interviews are added to understand furnace additions, rebuild cycles, and utilization shifts. Where available, paid subscription sources are used for company financials, patent screening, and shipment level trade checks, and the sources listed here are illustrative rather than exhaustive.
Primary Interviews and Surveys
Primary discussions are used to convert broad signals into practical assumptions, especially on furnace utilization, cullet availability, and how quickly customers switch packaging formats. We speak with manufacturers, large buyers, distributors, and industry experts across major consuming clusters in India, and then cross-check inputs until the key volume drivers align with observed production and trade patterns.
Distribution of primary research fieldwork respondents
| Company type | Respondent position |
|---|---|
| Top tier: 32% | CXOs: 14% |
| Mid tier: 53% | Functional/Unit leaders: 33% |
| Smaller Players: 15% | Managers: 53% |
Market-Sizing & Forecasting
The core model uses a top-down build where production, capacity additions, rebuild downtime, and import export movements are used to reconstruct the available container glass volume in India, and then it is aligned to end market demand. To keep the totals grounded, selective bottom-up checks are applied through supplier roll ups, sampled plant throughput assumptions, and volume conversion from key end uses.
A few practical inputs that matter for this market include installed furnace capacity by plant, utilization levels and planned maintenance windows, cullet share trends that affect effective output, lightweighting intensity that changes tonnes per container, and demand indicators tied to beverage and packaged food off-take. When the data is sparse for smaller producers, gaps are handled by using conservative utilization bands and trade adjusted consumption equivalents, followed by expert review.
For forecasting, scenario analysis is used so the base case reflects expected capacity moves, policy push on sustainable packaging, and steady end use growth, and then it is stress-tested with tighter utilization and slower conversion assumptions. The final forecast path is adjusted only after interview feedback indicates the assumptions are realistic for procurement cycles and furnace lead times.
Data Validation & Update Cycle
Outputs are validated through several checks so the model does not drift away from real market signals. We compare the implied volume path against independent indicators such as capacity announcements, rebuild calendars, import dependence, and shifts in major consuming categories, and then any large variance is investigated.
A multi step review is followed where assumptions are rechecked, calculations are peer reviewed, and outliers are traced back to the specific driver that caused them. If a material event occurs, such as a large furnace commissioning delay or a sudden trade policy change, experts are re-contacted and the affected inputs are updated. Reports are refreshed annually, and a final pre-release pass is done so clients receive the latest consistent view.
Mordor Intelligence's India Container Glass Market Sizing Compared With Other Published Estimates
Published market sizes can vary even when the topic sounds the same, because different teams count different product sets, use different units, and rely on different update timings. In this market, the biggest swings usually come from whether the estimate is volume based or value based, and whether adjacent glass packaging categories are mixed into the same number.
The spread also grows when assumptions for lightweighting, furnace utilization, and import adjustments are not clearly stated, or when older trade series are carried forward without a fresh check. Some sources report a single headline value that blends containers with broader glass packaging, which can look larger even though it is answering a different question, and the checks that keep the sizing tied to furnace capacity, rebuild schedules, and trade adjusted availability are applied before sign-off in Mordor Intelligence.
Benchmark comparison
| Source | Market Size | Gaps in Research Methodology |
|---|---|---|
| Mordor Intelligence | USD 4.27 M (2025) | |
| Industry Association A | USD 1.10 B (2024) | The figure is presented as a value headline for glass containers without a clear link to tonnage, which makes price assumptions and broader packaging context likely to be blended into one number. |
| Trade Publisher B | USD 4.47 M (2026) | The published size is a forward year tonnage point that is sometimes repeated as a market size without stating it is a forecast-year value, which shifts comparisons by one to two years. |
Looking across the three numbers, the practical takeaway is that unit choice and timing explain most of the gap, and the remaining difference comes from how adjacent glass packaging scopes are handled. When the market is tied back to capacity, utilization, and trade adjusted availability, the estimate stays traceable to observable drivers and can be repeated with the same steps as new data comes in.


Key Questions Answered in the Report
How fast is demand for beverage bottles growing in India?
Shipments of beer, wine, and spirits bottles are expanding at a 6-8% volume CAGR, underpinned by premium and craft labels that favor glass.
Why is amber glass gaining share?
Amber offers 99.5% ultraviolet attenuation below 450 nanometers, protecting light-sensitive beverages and pharmaceuticals and thus growing at a 4.75% CAGR.
What are the biggest cost pressures for glass manufacturers?
Natural-gas prices above INR 45 per cubic meter and draft carbon levies could add INR 600-750 per tonne to production costs in the near term.
How are companies reducing emissions from glass melting?
Leading players are installing oxy-fuel burners, hybrid-electric melters, and waste-heat recovery systems that together cut specific energy consumption by up to 18%.
Which end-user is expanding fastest beyond beverages?
Cosmetics and personal-care applications are advancing at a 4.82% CAGR as brands use flint and amber bottles to reinforce premium positioning.
Page last updated on:


 Your data is secure and never sold or shared.


