
India Smart TV And OTT Market Size and Share
Market Overview
| Study Period | 2020 - 2031 |
|---|---|
| Forecast Data Period | 2026 - 2031 |
| Base Year Market Size (2025) | USD 22.39 Billion |
| Market Size (2026) | USD 26.39 Billion |
| Market Size (2031) | USD 60.05 Billion |
| Growth Rate (2026 - 2031) | 17.88 % |
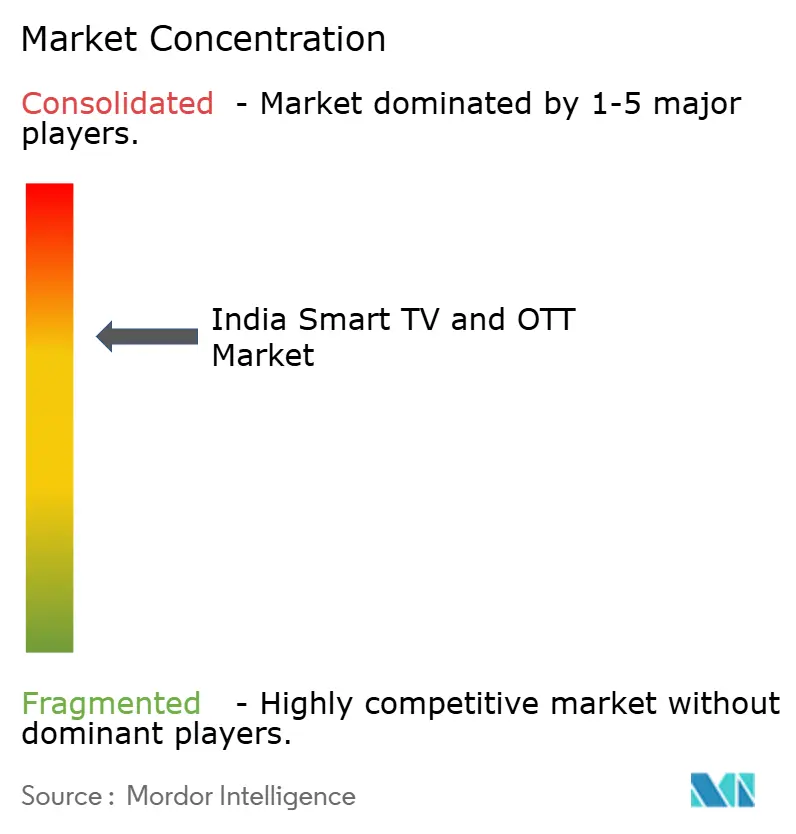
| Market Concentration | Medium |
Major Players
*Disclaimer: Major Players sorted in no particular order Image © Mordor Intelligence. Reuse requires attribution under CC BY 4.0. |
|
India Smart TV And OTT Market Analysis by Mordor Intelligence
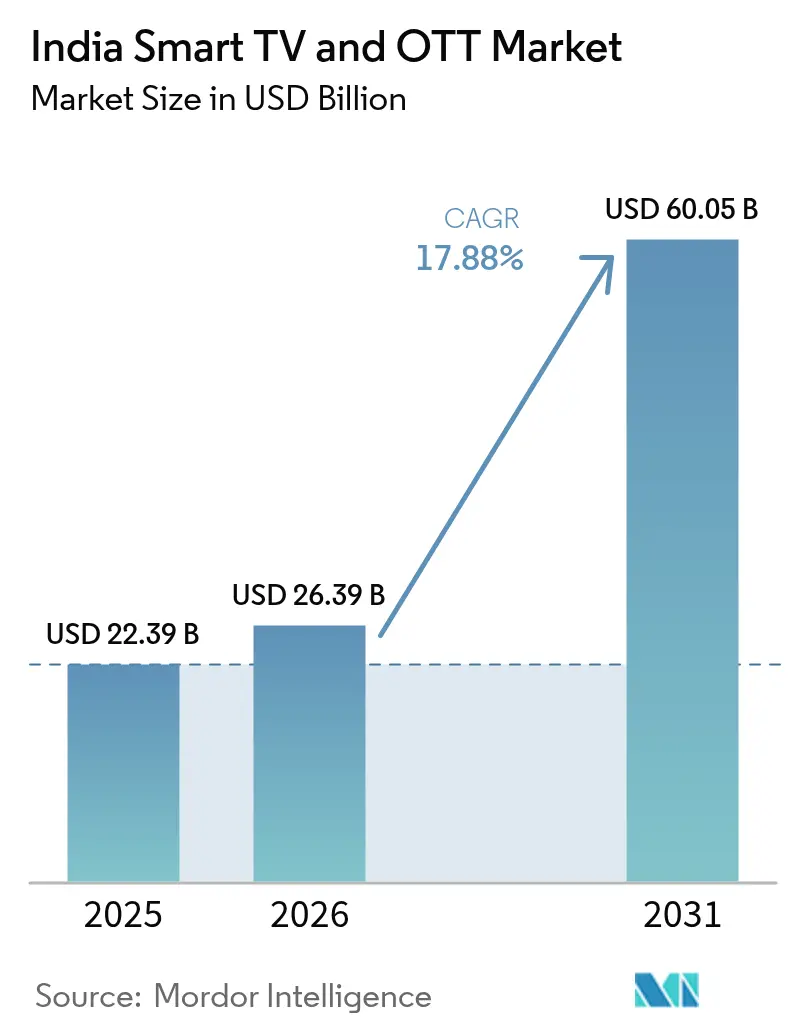
The India smart TV and OTT market size was valued at USD 22.39 billion in 2025 and estimated to grow from USD 26.39 billion in 2026 to reach USD 60.05 billion by 2031, at a CAGR of 17.88% during the forecast period (2026-2031). This growth ride stems from the union of Production Linked Incentive (PLI) schemes, softening average selling prices, and a surge in regional content consumption that now reaches deep into tier-2 and tier-3 cities. The PLI-backed capacity expansions in Tamil Nadu and Telangana keep supply steady even as component prices fluctuate, while BharatNet’s rural fiber roll-out adds millions of fresh broadband users every quarter. Competitive intensity is rising as Chinese entrants press price advantages and Korean brands position premium features, yet domestic manufacturers gain fresh ground because of the IndOS mandate and favourable duty cuts on open cells.[1]“Electronic Products News,” The Economic Times, economictimes.indiatimes.com Consumers, aided by low mobile-data tariffs and 5G deployment momentum, are shifting viewing hours from smartphones to living-room screens, further energizing device demand.
Key Report Takeaways
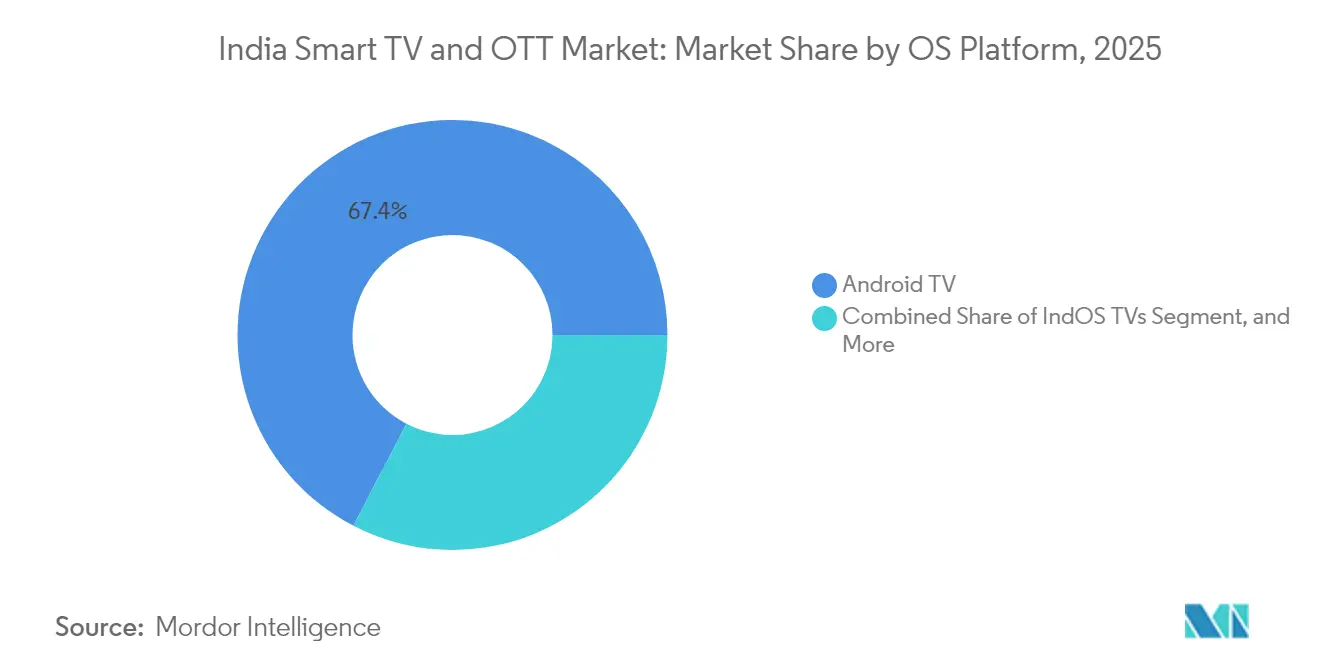
- By OS platform, Android TV led with 67.38% of the India smart TV and OTT market share in 2025, while IndOS televisions are projected to advance at a brisk 26.85% CAGR to 2031.
- By price band, the 20,000-40,000 INR segment held 41.60% revenue share in 2025; televisions priced above 60,000 INR are forecast to expand at a 23.70% CAGR through 2031.
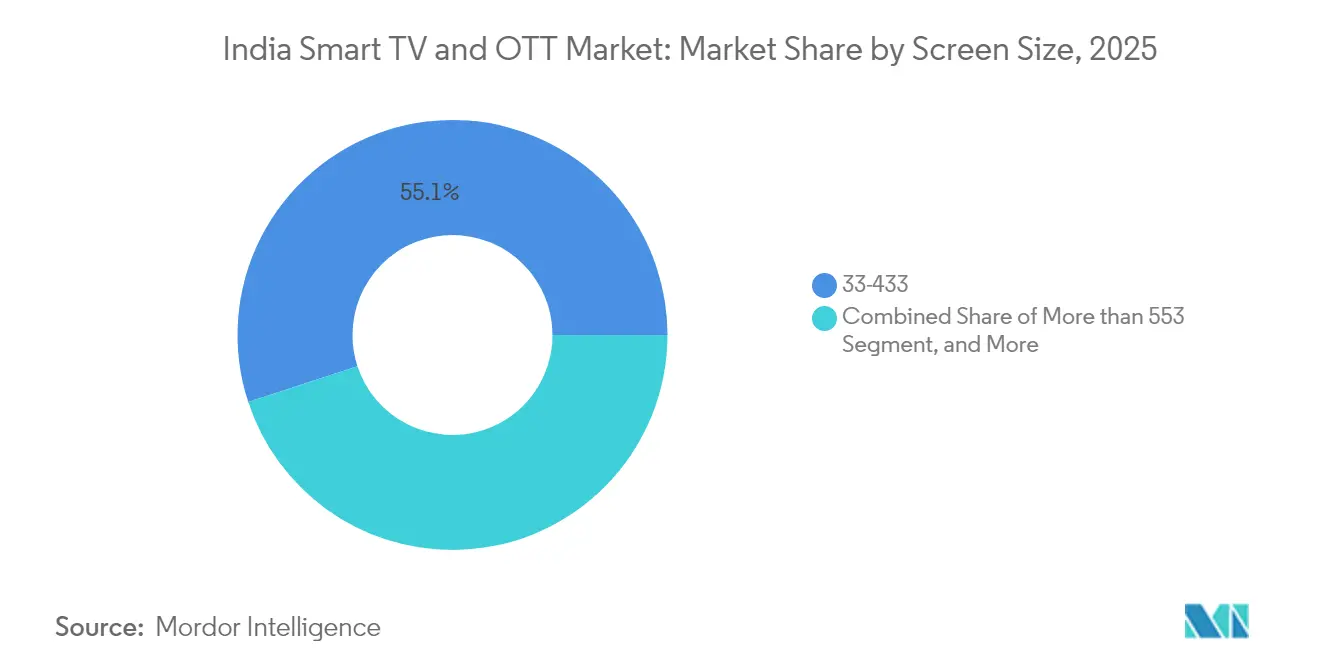
- By screen size, 33-43-inch models captured 55.05% share of the India smart TV and OTT market size in 2025, whereas sets larger than 55 inches will rise at a 25.60% CAGR during the outlook period.
- By distribution channel, online sales accounted for a 59.10% share in 2025, while organized retail is poised for the fastest 20.85% CAGR to 2031.
Note: Market size and forecast figures in this report are generated using Mordor Intelligence’s proprietary estimation framework, updated with the latest available data and insights as of 2026.
India Smart TV And OTT Market Trends and Insights
Drivers Impact Analysis*
| Driver | (~) % Impact on CAGR Forecast | Geographic Relevance | Impact Timeline |
|---|---|---|---|
| Rising disposable income and digital adoption | 3.20% | National, with stronger gains in tier-2/3 cities | Medium term (2-4 years) |
| Falling smart-TV ASPs and PLI manufacturing incentives | 4.10% | National, manufacturing concentrated in Tamil Nadu, Telangana | Short term (≤ 2 years) |
| Broadband data boom and 5G roll-outs | 2.80% | Urban-led, expanding to rural markets | Medium term (2-4 years) |
| Content localisation in 12+ languages | 2.50% | Regional strongholds in South, West, East India | Long term (≥ 4 years) |
| Mandatory India TV OS (IndOS) standard | 1.90% | National implementation, phased rollout | Long term (≥ 4 years) |
| Super-app bundling of OTT + e-commerce | 2.10% | Metro and tier-1 cities initially | Medium term (2-4 years) |
| Source: Mordor Intelligence | |||
Rising Disposable Income and Digital Adoption
Rural internet users crossed 442 million in 2024, overtaking the urban base for the first time and signalling deeper addressable demand for the India smart TV and OTT market.[2]TNN, “Over half of 821mn internet users from rural India,” timesofindia.indiatimes.com Multidimensional poverty fell to 14.96% in 2019-21, freeing household budgets for long-life consumer electronics. Government-run PMGDISHA trained nearly 64 million citizens in basic digital skills, lowering entry barriers to smart TV features. Average monthly wireless data use reached 21.30 GB per subscriber at a tariff of INR 8.31 per GB, down from INR 268.97 ten years earlier, making HD and 4K streaming an everyday habit. These socioeconomic shifts underpin consistent multi-year growth momentum for the India smart TV and OTT market.
Falling Smart-TV ASPs and PLI Manufacturing Incentives
PLI reimbursements offset volatile panel prices, allowing brands to hold entry prices even as open-cell costs swung 20% since late-2023. Dixon Technologies’ USD 600 million expansion into display modules anchors a broader supplier ecosystem that now includes Korean component vendors investing INR 1,200 crore to localize inputs. The February 2025 Union Budget trimmed customs duty on open cells to zero and preserved a lower slab for smaller screens, preserving cost competitiveness despite a 28% GST on TVs larger than 32 inches.[3]Acharya Mayashree, “Budget 2025: Cheaper and Costlier Items,” cleartax.in These fiscal tailwinds let manufacturers price aggressively without eroding already thin 4-7% operating margins, sustaining volume-led growth in the India smart TV and OTT market.
Broadband Data Boom and 5G Roll-outs
India installed 462,084 5G base stations across 779 districts by December 2024, pushing the median mobile download speed to 95.67 Mbps. Reliance Jio’s 5.7 million fixed-wireless subscribers account for 85% of that segment, giving its OTT stable a bandwidth advantage. 4G now covers 615,836 villages while BharatNet’s fiber reached 1.25 million rural homes, broadening the India smart TV and OTT market’s addressable base. Yet quality gaps persist: 62% of fixed-broadband users reported frequent disruptions and speed shortfalls in a March 2025 consumer survey. Satellite internet partnerships with Starlink and OneWeb aim to close the last-mile gap in remote regions, potentially adding a fresh layer of growth.[4]Business Today Desk, “Starlink agrees to data localisation rules,” businesstoday.in
Content Localisation in 12+ Languages
Regional language streams formed 52% of total OTT viewing in 2023 and continue to climb as Tamil, Telugu, and Bengali libraries deepen. BHASHINI, the government’s language AI platform, now handles 100 million monthly inferences across 22 languages, enabling voice navigation on IndOS devices. Vernacular-first platform STAGE secured USD 12.5 million in Series B funding to scale hyper-local shows, while JioCinema’s mega live events drew 8.3 million concurrent viewers, validating regional monetization at a national scale. This localisation wave locks users into OTT ecosystems and accelerates device upgrades, benefiting the India smart TV and OTT market.
Restraints Impact Analysis*
| Restraint | (~) % Impact on CAGR Forecast | Geographic Relevance | Impact Timeline |
|---|---|---|---|
| High GST (28%) and customs duties on panels | -2.30% | National, affecting all price segments above 32" | Short term (≤ 2 years) |
| Piracy and password sharing | -1.80% | Urban markets primarily, affecting premium content | Medium term (2-4 years) |
| Rural grid-power unreliability | -1.50% | Rural India, concentrated in eastern states | Long term (≥ 4 years) |
| 5G spectrum cost overhang | -1.10% | National, affecting telco investment capacity | Medium term (2-4 years) |
| Source: Mordor Intelligence | |||
High GST and Customs Duties on Panels
The 28% GST slab on televisions beyond 32 inches steers buyers toward tax-efficient smaller screens even though living-room habits favor bigger displays. Customs duty on interactive panels rose to 20% in Budget 2025-26, squeezing education and commercial segments that often ignite volume scale. Compliance testing under IS 616:2017 adds weeks to launch cycles and compounds cost pressure as brands juggle multiple bureau approvals. These fiscal and procedural frictions slow premium uptake and shave points off the India smart TV and OTT market CAGR until duty rationalization gains momentum.
Piracy and Password Sharing
Industry data suggest 30-40% of subscription accounts are shared beyond intended users, diluting revenue among urban premium audiences. Court debates on OTT censorship create regulatory ambiguity that adds compliance overhead to already thin streaming margins. Platforms respond with device limits and ad-supported tiers, yet piracy networks exploit quick 5G uploads to disseminate high-bitrate torrents within hours of release. Sustained investment in DRM tech is unavoidable but inflates cost structures, trimming profitability across the India smart TV and OTT market.
*Our forecasts treat driver/restraint impacts as directional, not additive. The impact forecasts reflect baseline growth, mix effects, and variable interactions.
Segment Analysis
By OS Platform: IndOS Emergence Challenges Android Dominance
Android TV accounted for a dominant 67.38% of the India smart TV and OTT market share in 2025, yet IndOS shipments are forecast to grow at a 26.85% CAGR through 2031 as state procurement and data-sovereignty preferences take hold. This transition is supported by JioTele OS, launched in February 2025, which bundles voice AI and smart-home dashboards optimized for Indic languages. Over the forecast horizon, the India smart TV and OTT market size attached to IndOS devices is set to expand rapidly, providing domestic OEMs a strategic wedge against entrenched global platforms.
Developers recognize commercial upside in localized storefronts, while regulators prefer transparent code audits that IndOS can facilitate. Nonetheless, sustained user experience parity with Android TV’s vast app library remains a gating factor. Fire OS keeps a niche by pairing Amazon content and retail wallets, Tizen and webOS preserve value at the premium end through deep hardware-software integration, and Linux derivatives power economical white-label models. The resulting multi-platform landscape intensifies feature innovation and price competition across the India smart TV and OTT market.



By Price Band: Premium Segments Drive Value Migration
Televisions priced between 20,000-40,000 INR delivered 41.60% of the India smart TV and OTT market size in 2025, but units costing over 60,000 INR are projected to clock a 23.70% CAGR to 2031 as household incomes climb. Larger living spaces and demand for advanced display technologies such as QLED and OLED underpin this upward migration. Samsung’s Chennai expansion aligns capacity with premium appetite, while Xiaomi, TCL, and OnePlus seek to stretch mid-range DNA upward without losing price sensitivity.
Margin pressure plagues the sub-20,000 INR tier because open-cell prices still represent 60-65% of the bill-of-materials. Domestic fabrication of panels by Dixon eases dependency on imports, allowing local brands to widen feature sets without proportionate cost hikes. The 40,000-60,000 INR tranche emerges as a transitional sweet spot where HDR, Dolby Atmos, and 120 Hz refresh rates become affordable luxury. As consumers increasingly treat smart TVs as eight-year assets rather than discretionary gadgets, their willingness to pay a premium for longevity fuels the India smart TV and OTT market.
By Screen Size: Large Format Adoption Accelerates
Displays measuring 33-43 inches maintained a 55.05% share of the India smart TV and OTT market in 2025, yet screens larger than 55 inches are expected to register a robust 25.60% CAGR over 2026-2031 as panel prices continue to soften. The cinema-at-home trend, remote-work multi-tasking, and immersive gaming experiences all push households toward bigger viewing surfaces. Manufacturers have already shifted new capacity toward 55-inch and 65-inch lines, with component ecosystems following suit.
The ≤32-inch category is losing relevance except in densely populated urban rentals and cost-constrained rural homes. Meanwhile, 44-55-inch models represent a pragmatic balance of footprint and price, driving replacement demand in tier-2 and tier-3 cities. Certification under MTCTE now ensures that integrated Wi-Fi 6, Bluetooth 5.2, and security protocols are standardized across sizes, reinforcing trust in connected-device safety. These dynamics collectively enlarge the premium end of the India smart TV and OTT market.
By Distribution Channel: E-commerce Maintains Lead Despite Retail Growth
Online portals captured 59.10% of the India smart TV and OTT market share in 2025, buoyed by flash sales, comparison shopping, and doorstep installation services. Amazon and Flipkart continue to wield pricing power through scale purchases and exclusive launches. Yet organized retail is forecast to post a 20.85% CAGR to 2031 as brands roll out experience-centric showrooms in emerging cities, where in-person demos influence high-value purchases.
Omnichannel ambitions are evident in Xiaomi’s Mi Homes and OnePlus Experience Stores that blend online price discovery with offline fulfilment. Independent dealers retain pockets of strength in rural belts, relying on community trust and instant after-sales support, though their share erodes as supply chains standardize. The competitive interplay between channels pushes warranty extensions, no-cost EMI plans, and instant upgrade offers that collectively raise the India smart TV and OTT market’s replacement frequency and ASP.
Geography Analysis
Northern and Western states jointly contribute the largest portion of the India smart TV and OTT market size, backed by reliable fiber networks and higher per-capita incomes. Delhi-NCR, Mumbai, Pune, and Ahmedabad act as early adopters of 8K and OLED formats, and these metros average two OTT subscriptions per household. Southern states follow closely, leveraging vibrant local content ecosystems anchored in Chennai and Hyderabad; Tamil and Telugu originals often debut simultaneously with Hindi releases, boosting device sales linked to region-specific promotions.
Eastern and Northeastern regions present the fastest growth base as BharatNet penetration climbs; FTTH subscribers in these zones touched 1.25 million by end-2024. The influx of work-from-home professionals returning to tier-2 hometowns increases purchasing power and content consumption in previously underserved areas. State electricity boards are modernizing feeders, yet intermittent supply still restrains large-screen adoption in rural Bengal and Odisha.
Satellite internet pilots in Meghalaya and Arunachal Pradesh show promising latency metrics that could widen the India smart TV and OTT market once commercial service commences. Local language UI packs and voice remotes tailored for Assamese, Manipuri, and Khasi dialects further remove adoption barriers. Nonetheless, state-level GST enforcement differences and disparate consumer-protection redress mechanisms mean OEMs must craft region-specific sales and service playbooks.
Regulatory Landscape
India’s OTT ecosystem is primarily governed by the Information Technology (Intermediary Guidelines and Digital Media Ethics Code) Rules, 2021, which lay out a Code of Ethics and a three-tier grievance redressal framework for publishers of online curated content. This regime runs separately from the Central Board of Film Certification framework. In February 2026, the Ministry of Information and Broadcasting (MIB) issued finalized accessibility guidelines for OTT platforms, covering support for persons with hearing and visual impairment, and introducing compliance requirements that flow into content preparation workflows and player features across smart TVs and streaming apps.
On the convergence front, the Telecommunications Act, 2023 is being used to shape future oversight for internet-delivered TV-like services. TRAI released a consultation paper on April 6, 2026 on frameworks for FAST and application-based linear TV distribution, and MIB issued draft Telecommunications (Television, Radio and Associated Services) Rules, 2026 for consultation in June 2026. For devices, television sets sold in India also face product compliance obligations such as BIS-linked standards, and MeitY extended the compliance deadline under the Electronics and Information Technology Goods (Requirements for Compulsory Registration) Order, 2021 for televisions to July 26, 2026, influencing vendor launch calendars and inventory transitions.
Competitive Landscape
The India smart TV and OTT market tilts toward moderate concentration, with the top five television vendors controlling just over 40% share in 2024. Samsung and LG anchor the premium spectrum through 4K-120 Hz panels, AI upscales, and smart-home dashboards. Chinese challengers Xiaomi, TCL, and OnePlus lead the value-driven middle with aggressive launch cadence and online-first distribution. Domestic brand VU adds design-led differentiation, while OEM giant Dixon leverages ODM credentials and sizable PLI benefits to court both global and local labels.
IndOS represents a structural wildcard capable of disrupting software loyalty locks. Samsung and LG already test compliance builds, while real-time OS updates from JioTele aim for parity with Android’s app stability. Component partnerships deepening in Chennai and Sriperumbudur reduce lead times and import costs, giving Korean incumbents a manufacturing hedge.
On the streaming front, JioCinema’s telecom bundling amplifies user stickiness across its digital universe, whereas YouTube continues to dominate ad-supported long-tail content monetization. Smaller regional OTT players pursue niche lanes with vernacular originals. The rise of FAST (Free Ad-Supported Television) channels further fragments attention, pushing platforms to refine recommendation engines and ad-load algorithms, raising the technical threshold for competitive relevance inside the India smart TV and OTT market.
India Smart TV And OTT Industry Leaders
-
Xiaomi Corporation
-
Samsung
-
LG Electronics Inc.
-
Sony Corporation
-
TCL Technology
- *Disclaimer: Major Players sorted in no particular order

Market Opportunities and Future Outlook
Connected TV usage is expanding the addressable audience for ad-supported and hybrid OTT models, which supports premium inventory creation on smart TV interfaces. Kantar-reported metrics from Q1 2026 show connected TV at 166 million monthly viewers (15+), and 36% of CTV viewers (about 59 million) consuming content exclusively on connected TV rather than through linear TV. This shift keeps pressure on home-screen discovery, regional content rails, and measurement-ready ad stacks for OTT platforms and device OEMs.
Actions and product releases in 2026 also point to gaps across both content depth and higher-end hardware. Walt Disney increased its India streaming exposure through equity infusions into the JioStar India joint venture, including a July 2026 FDI infusion, while Lionsgate Play completed a management-led buyout in May 2026 and outlined a stronger IP-development push. On the device side, OEM launches in 2026 broaden advanced display and AI-led software propositions, such as Mini LED and AI companion features, creating room for platforms and advertisers to optimize large-screen engagement, interactive ad formats, and accessibility-aligned UX as MIB’s February 2026 OTT accessibility guidelines take effect.
Recent Industry Developments
- June 2026: Xiaomi launched the FX Mini LED TV series in India, adding Amazon Fire TV integration across sizes that span mainstream to large-screen living-room use cases. The move strengthens platform-level bundling choices beyond Google TV and gives OTT partners another native surface for app discovery and subscription upsell.
- May 2026: Samsung India launched its 2026 Vision AI TV lineup with 72 models across Micro RGB, OLED, Neo QLED, The Frame, Mini LED, and UHD categories. The rollout pushes AI-led features deeper into the portfolio and increases competitive pressure on rivals to match premium display technology and personalization capabilities at multiple price points.
- March 2025: Reliance Jio launched JioTele OS with voice control and a regional-language user interface for smart TVs. This added momentum to India-origin TV OS alternatives and supported differentiated content and service bundling strategies for OEMs and OTT platforms targeting multilingual households.


Research Methodology Framework and Report Scope
Market Definition and Coverage
For this methodology, the India smart TV and OTT market is treated as the value generated from smart TV hardware sold in India, plus OTT services consumed through connected-TV viewing, captured within the same country demand pool.
Scope exclusions: We exclude non-smart TVs, pure mobile-only OTT consumption, and broader digital advertising that is not tied back to OTT viewing.
Segmentation Overview
-
By OS Platform
- Android TV
- Proprietary Linux (Tizen/WebOS)
- Fire OS
- IndOS (Gov-backed)
-
By Price Band (INR)
- < 20 k
- 20 k - 40 k
- 40 k - 60 k
- > 60 k
-
By Screen Size
- ≤32"
- 33 - 43"
- 44 - 55"
- > 55"
-
By Distribution Channel
- Online (e-commerce)
- Organised Retail
- Independent Dealers
Data Sources, Market Sizing, and Validation
Desk Research
Desk work starts with assembling the factual base for TV shipments, broadband readiness, and paid video behavior, then mapping it to India-specific viewing and purchase patterns. Public sources were used to anchor assumptions, such as Telecom Regulatory Authority of India (TRAI) releases, Ministry of Information and Broadcasting publications, MeitY program updates (including IndOS references), and Reserve Bank of India macro indicators.
We also reviewed government trade statistics and customs data for electronics flows, patent databases to capture TV OS and UI feature themes, and peer-reviewed papers on video consumption and price sensitivity. Company filings and investor decks were then used for India-specific revenue cues. Where needed, paid subscriptions for company financials and intelligence, shipment-level import-export data, and news and financial statements were used to sanity-check scale and timing. These examples are not exhaustive, and other sources were reviewed to collect inputs, validate them, and clarify open points.
Primary Interviews and Surveys
Primary work focused on confirming what moves revenue in India, specifically how many TVs are sold through each channel and how OTT monetization changes by price band and screen size. We spoke with stakeholders across device distribution, platform operations, and media buying to ensure the model reflects observed discounting patterns, subscription bundling, and churn behavior across major Indian metros as well as smaller cities.
Distribution of primary research fieldwork respondents
| Company type | Respondent position |
|---|---|
| Top tier: 27% | CXOs: 13% |
| Mid tier: 52% | Functional/Unit leaders: 36% |
| Smaller Players: 21% | Managers: 51% |
Market-Sizing & Forecasting
Sizing begins with a top-down demand pool build that links India TV replacement and upgrade cycles with smart TV penetration, then converts units into value using blended ASPs by screen size and price bands. OTT value is reconstructed using paid subscriber indicators, effective ARPU after discounts, and the share of viewing shifting to connected TVs, followed by adjustments for bundle-led offers.
To keep totals realistic, the output is cross-checked with selective bottom-up approximations, such as sampled ASP times channel volumes and supplier and retailer run-rate checks where gaps exist. Inputs that matter in this market include screen-size mix shifts, online versus organized retail share, broadband and fiber additions, price-band migration (especially INR 20k to 40k), and ad load or subscription pricing changes that can move OTT revenue. Forecasts rely on scenario analysis supported by trend smoothing, where the base case is stress-tested against plausible swings in promotions, content spend intensity, and device price declines.
Data Validation & Update Cycle
Model outputs are checked against independent signals, such as shipment momentum, channel inventory commentary, and broadband subscriber additions, before final values are set. When a number appears off, the driver is traced back to a small set of assumptions, and then those assumptions are re-checked via follow-up calls or additional desk reads.
Each deliverable goes through multi-step analyst review so calculation logic, unit conversions, and year-on-year movements remain consistent. Reports are refreshed annually, and interim updates are made when a material event changes pricing, taxes, distribution, or OTT packaging. Before delivery, a final pass is completed so clients receive the most current view available at that time.
Mordor Intelligence's India Smart Tv and Ott Market Size Measured Against Other Published Estimates
Published market sizes for India smart TV and OTT often disagree because the revenue streams are not counted consistently, and because different base years, pricing paths, and levels of forecast optimism are used. Even small differences in how hardware value and OTT monetization are combined can create a wide gap.
The biggest drivers here are whether OTT is counted only for connected-TV viewing or for all devices, and whether hardware value is built from actual price-band and screen-size mix instead of a single average price. Some estimates also pull forward growth by assuming fast ARPU expansion without checking discounting and bundle economics, and currency timing can further widen the spread when INR to USD conversion points differ. A key reason for this study is that device ASP by price band, distribution-channel mix, and connected-TV OTT ARPU checks are kept separate and refreshed on a clear cadence, which is applied by Mordor Intelligence.
Benchmark comparison
| Source | Market Size | Gaps in Research Methodology |
|---|---|---|
| Mordor Intelligence | USD 22.39 B (2025) | |
| Industry Publisher A | USD 27.71 B (2026) | Mixes multiple device endpoints into OTT demand and uses a forward-year revenue point, which can overstate near-term value when bundle pricing is heavy. |
| Regional Consultancy B | USD 10.75 B (2024) | Limits scope to smart TV hardware only and anchors value to a single base-year device market, leaving out OTT monetization tied to connected-TV viewing. |
The table shows that the spread mostly comes from scope choices first, and then from pricing and timing choices. By keeping hardware and OTT revenue drivers explicit and then reconciling them with channel and viewing checks, the resulting number stays traceable to inputs a reader can follow and re-test.


Key Questions Answered in the Report
How big is the India Smart TV and OTT Market?
The India Smart TV and OTT Market size is expected to reach USD 26.39 billion in 2026 and grow at a CAGR of 17.88% to reach USD 60.05 billion by 2031.
What is the current India Smart TV and OTT Market size?
In 2026, the India Smart TV and OTT Market size is expected to reach USD 26.39 billion.
Who are the key players in India Smart TV and OTT Market?
Xiaomi Corporation, Samsung, LG Electronics Inc., Sony Corporation and TCL Technology are the major companies operating in the India Smart TV and OTT Market.
What years does this India Smart TV and OTT Market cover, and what was the market size in 2025?
In 2025, the India Smart TV and OTT Market size was estimated at USD 26.39 billion. The report covers the India Smart TV and OTT Market historical market size for years: 2019, 2020, 2021, 2022, 2023 and 2024. The report also forecasts the India Smart TV and OTT Market size for years: 2026, 2027, 2028, 2029, 2030 and 2031.
Page last updated on:


 Your data is secure and never sold or shared.


