Over The Top (OTT) Market Size and Share
Market Overview
| Study Period | 2020 - 2031 |
|---|---|
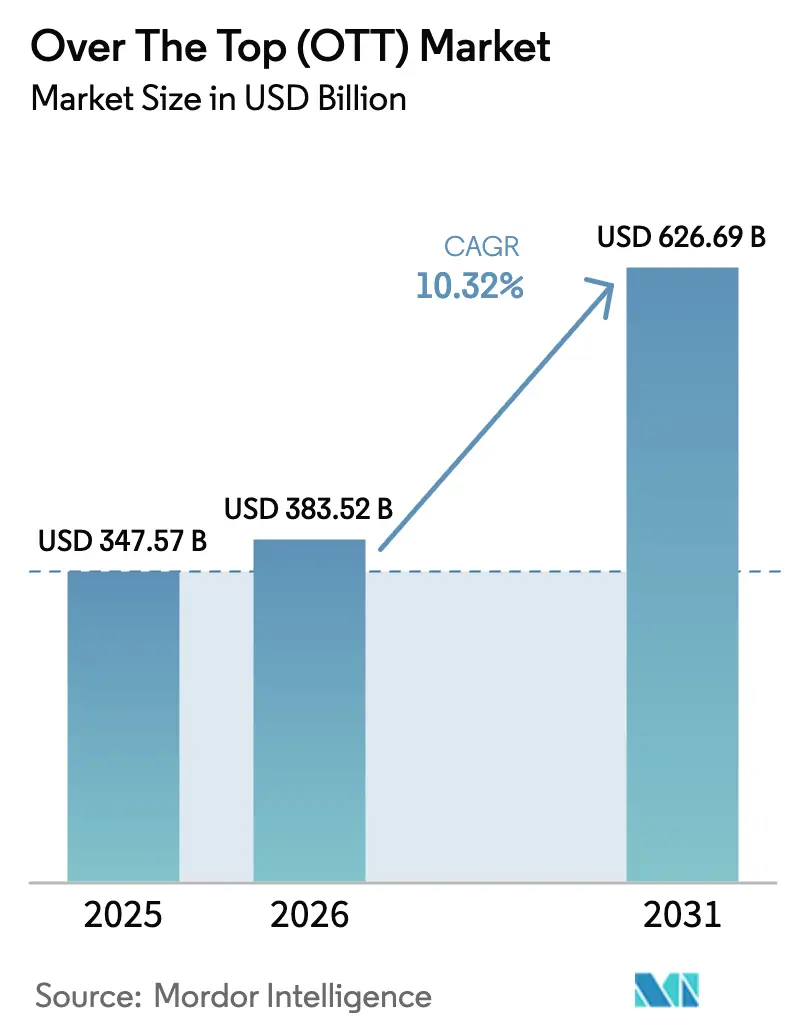
| Market Size (2026) | USD 383.52 Billion |
| Market Size (2031) | USD 626.69 Billion |
| Growth Rate (2026 - 2031) | 10.32% CAGR |
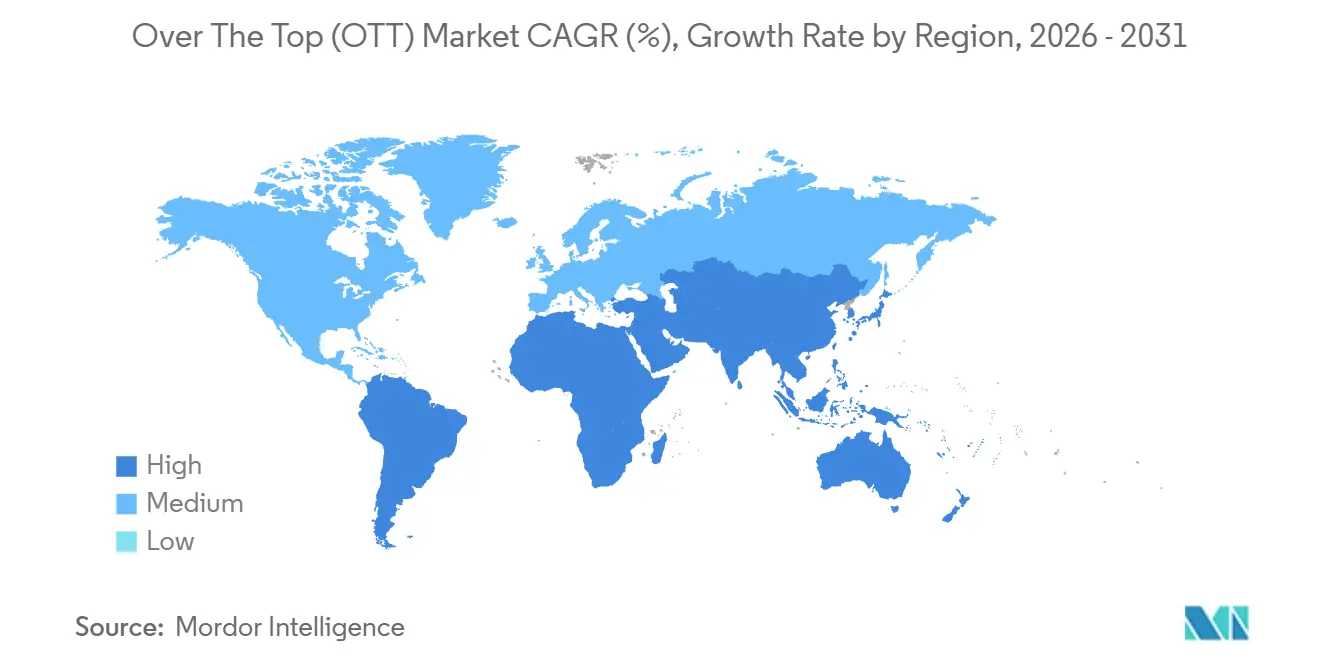
| Fastest Growing Market | Middle East |
| Largest Market | Asia Pacific |
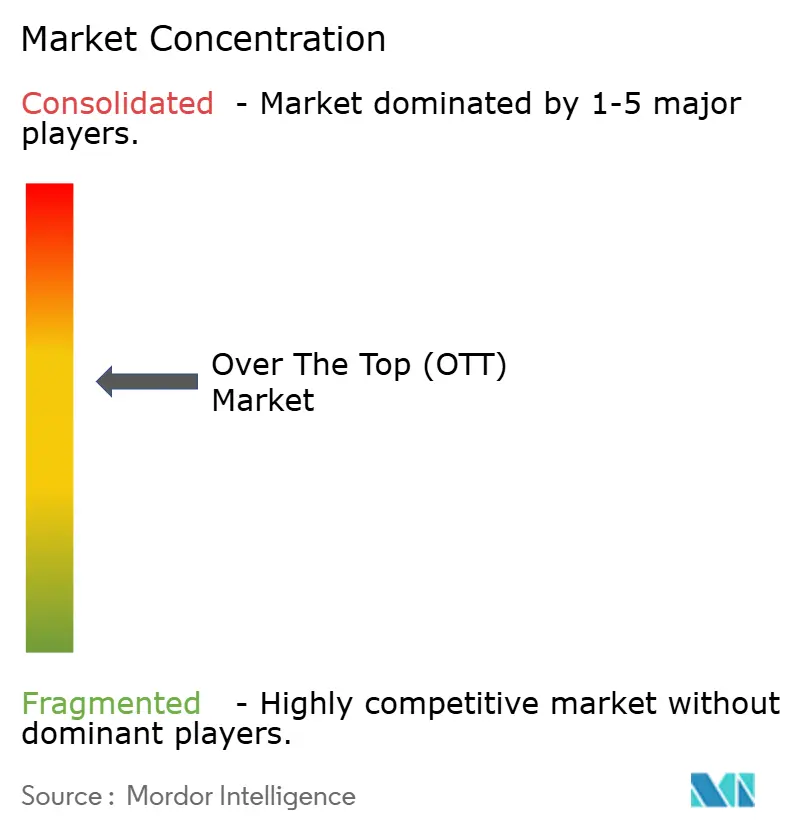
| Market Concentration | Medium |
Major Players
*Disclaimer: Major Players sorted in no particular order Image © Mordor Intelligence. Reuse requires attribution under CC BY 4.0. |
|
Over The Top (OTT) Market Analysis by Mordor Intelligence
The Over The Top Market size is expected to grow from USD 347.57 billion in 2025 to USD 383.52 billion in 2026 and is forecast to reach USD 626.69 billion by 2031 at a 10.32% CAGR over 2026-2031. This strong trajectory reflects structural changes in how audiences consume long-form video, including bundled subscriptions inside mobile data plans, premium direct-to-consumer sports packages, and tiered pricing that blends advertising with monthly fees. Hybrid monetization, which layers targeted ads on lower-priced subscription levels, represents the fastest-growing service model, with a 12.81% CAGR, as platforms convert price-sensitive users without cannibalizing premium tiers. Asia Pacific leads adoption, aided by telco distribution that removes credit-card friction, while the Middle East shows the steepest regional runway thanks to sovereign investment in local-language originals. On the device front, smart and connected TVs are reclaiming viewing time from phones and tablets, signaling a return of the lean-back experience that favors high-resolution episodic drama and live sports.
Key Report Takeaways
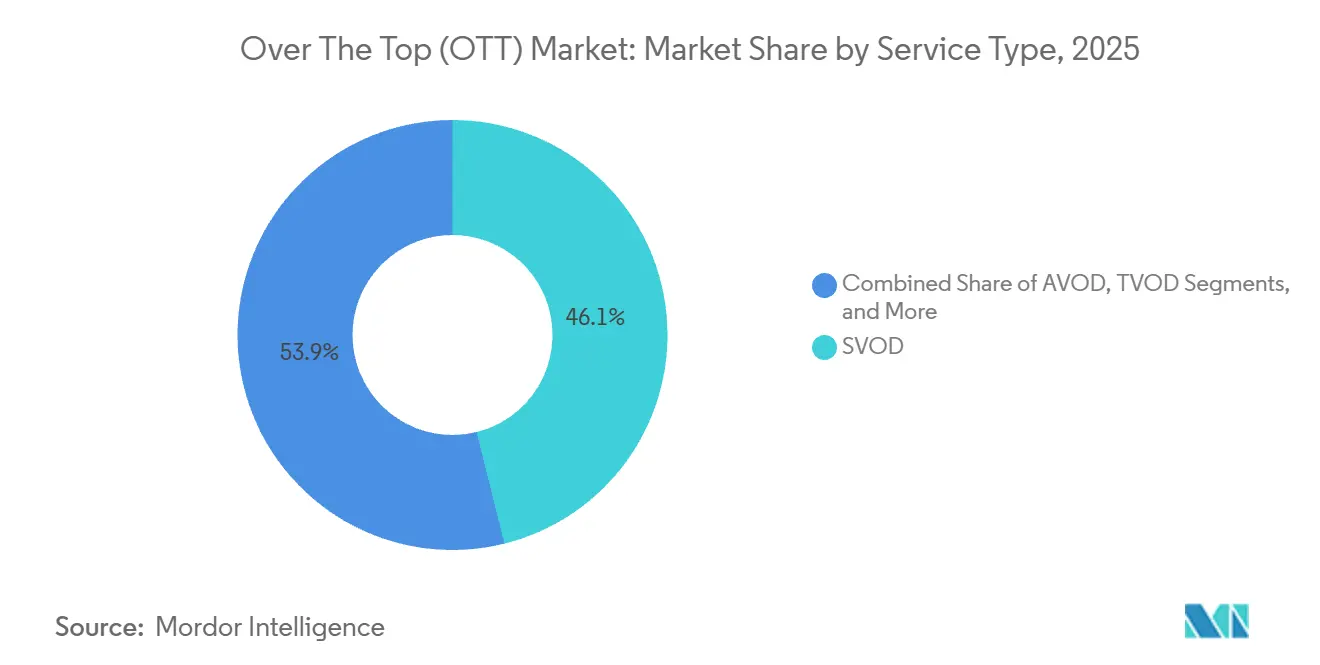
- By service type, SVOD led with 46.12% revenue share in 2025; hybrid tiers are projected to grow at 12.81% CAGR through 2031.
- By device platform, smartphones and tablets held 41.23% of the OTT market share in 2025, while smart TVs are expected to post a 13.43% CAGR through 2031.
- By content genre, entertainment and movies accounted for 34.57% of consumption in 2025; sports is set to expand at a 12.67% CAGR through 2031.
- By streaming resolution, high-definition 720p held 38.29% share in 2025, whereas 4K and above are forecast to grow at 13.94% CAGR through 2031.
- By geography, the Asia Pacific captured 34.83% revenue in 2025, while the Middle East is projected to record a 12.64% CAGR between 2026 and 2031.
Note: Market size and forecast figures in this report are generated using Mordor Intelligence’s proprietary estimation framework, updated with the latest available data and insights as of January 2026.
Global Over The Top (OTT) Market Trends and Insights
Drivers Impact Analysis*
| Driver | (~) % Impact on CAGR Forecast | Geographic Relevance | Impact Timeline |
|---|---|---|---|
| Bundled Telco-OTT Partnerships | +3.2% | Asia Pacific core, spillover to Middle East and Africa | Medium term (2-4 years) |
| Live-Sports Rights Inflation | +2.8% | North America and Europe, selective Asia Pacific markets | Short term (≤2 years) |
| Connected-TV Advertising Shift | +2.5% | North America and Europe, early adoption in Latin America | Medium term (2-4 years) |
| Government Domestic-Content Quotas | +2.1% | Europe, India, China, Brazil, selected Middle East markets | Long term (≥4 years) |
| Cloud-Based Content Delivery Optimization | +1.9% | Global | Medium term (2-4 years) |
| AI-Driven Personalization Engines | +1.7% | North America, Europe, China | Long term (≥4 years) |
| Source: Mordor Intelligence | |||
Bundled Telco-OTT Partnerships Accelerate Subscriber Uptake
Mobile operators in India, Indonesia, and the Philippines integrated streaming access into prepaid and postpaid plans during 2024-2025, converting data customers into OTT viewers at nearly zero acquisition cost. Reliance Jio’s inclusion of JioCinema added more than 100 million active users in under 12 months, demonstrating how telcos can remove payment friction by absorbing fees as a retention expense. Platforms benefit from immediate scale that attracts advertisers, while carriers boost data-plan stickiness. This model tilts revenue mix toward advertising because low-ARPU users prefer free or low-priced tiers. Regulators currently view such bundles as tools for digital inclusion, although India’s Competition Commission has begun investigating potential competitive distortions.
Record Live-Sports Rights Inflation Raises Pricing Power
Premier League domestic rights for 2025-2029 reached GBP 6.7 billion (USD 8.5 billion), a 15% lift over the prior cycle, underlining how exclusive sports assets enable higher price points. Technology firms are acquiring packages outright: Apple’s 10-year, USD 2.5 billion agreement for Major League Soccer and Amazon’s Thursday Night Football deal show a strategic shift away from traditional broadcasters. Live events cut churn because viewers must stay subscribed in real time, yet inflated fees heighten profitability risk if audience numbers fall short. DAZN’s 2024 price hikes in Germany and Italy illustrate the delicate balance between margin recovery and subscriber attrition.
Connected-TV Advertising Fuels AVOD and FAST Growth
Advertisers moved budget to connected TV in 2024-2025, attracted by programmatic targeting and measurable reach. U.S. CTV ad spend hit USD 30 billion in 2024, surpassing cable for the first time. Roku’s platform revenue grew 18% year-over-year in Q3 2025, validating an ad-centric strategy. Consumer fatigue with stacking five or more paid services has made viewers receptive to ad-supported models, while younger cohorts see advertising as a fair trade for free content. As a result, AVOD and FAST channels form a structural, not cyclical, growth path for the OTT market.
Government Domestic-Content Quotas Spur Local Production
Europe’s Audiovisual Media Services Directive now requires at least 30% European works in on-demand catalogs, compelling platforms to invest heavily in regional originals.[1]European Commission, “Audiovisual Media Services Directive,” ec.europa.eu Netflix invested USD 1.2 billion in European productions in 2024. Similar mandates in India, China, and Brazil are pushing global providers to set up local content hubs from Madrid to São Paulo, improving cultural relevance but fragmenting global content strategy. Smaller services lacking capital for originals face escalating competitive pressure in quota-driven markets.
Restraints Impact Analysis*
| Restraint | (~) % Impact on CAGR Forecast | Geographic Relevance | Impact Timeline |
|---|---|---|---|
| Escalating Content-Acquisition Costs | -2.3% | North America and Europe, selective Asia Pacific markets | Short term (≤2 years) |
| High Churn Amid Subscription Stacking | -1.8% | North America, emerging in Europe | Short term (≤2 years) |
| High Bandwidth Costs and Inconsistent Networks | -1.5% | Africa, Latin America, rural Asia | Medium term (2-4 years) |
| Regulatory Constraints on Privacy and Censorship | -1.2% | China, Middle East, Europe | Long term (≥4 years) |
| Source: Mordor Intelligence | |||
Escalating Content Costs Compress Margins
Global studios spent more than USD 230 billion on content in 2024. Warner Bros. Discovery alone allocated USD 20 billion across linear and streaming units, putting pressure on platforms that lack scale. Talent fees have inflated as showrunners extract premium deals in a fragmented environment. The resulting margin squeeze pushes services to cancel underperforming titles faster and green-light fewer experimental projects, reducing the supply of breakout hits that drive new subscribers.
High Churn Challenges Subscription Economics
U.S. annual churn reached 40% in 2025, driven by “subscription rotation,” where households hop between platforms to watch marquee releases. Easy digital cancellations drop switching costs to nearly zero. Providers respond by bundling services, offering annual prepaid plans, and staggering flagship releases. Disney’s bundle of Disney+, Hulu, and ESPN+, priced below the combined standalone costs, exemplifies efforts to deepen engagement and extend customer lifetime value. Platforms without sticky franchises face elevated re-acquisition costs and flatter growth curves.[2]The Walt Disney Company, "Q2 2024 Earnings Presentation." disney.com
*Our forecasts treat driver/restraint impacts as directional, not additive. The impact forecasts reflect baseline growth, mix effects, and variable interactions.
Segment Analysis
By Service Type: Hybrid Models Gain Traction
SVOD commanded 46.12% of 2025 revenue, but penetration is nearing a ceiling in higher-income countries. Hybrid tiers that combine a lower subscription fee with targeted ads are forecast to be the fastest-growing slice of the OTT market, rising at a 12.81% CAGR. Netflix attracted 15 million ad-tier users within 18 months of launch, demonstrating latent demand for value-priced access. The OTT market size attributed to hybrid models is projected to increase sharply as content libraries remain identical to those of premium tiers, making ad tolerance the only trade-off. The regulatory climate in Europe introduces additional compliance steps for targeted advertising, potentially moderating its uptake there; yet, the model remains central to winning cost-conscious viewers across the Asia Pacific and Latin America.
The pure AVOD segment remains relevant for lightly engaged audiences, while TVOD has plateaued, except for day-and-date movie releases and pay-per-view sports. Platforms increasingly publish unified price ladders that encourage upgrading rather than churn, and loyalty programs tied to broader entertainment ecosystems (theme parks, music, gaming) create added lock-in. As competitive gaps narrow in catalog breadth, the ability to segment by willingness to watch ads becomes a primary lever for expanding average revenue per user.


By Device Platform: Smart TVs Reclaim Viewing Time
Mobile devices accounted for 41.23% of active viewing hours in 2025, yet smart-TV usage is rising fastest at a 13.43% CAGR through 2031. Smart-TV shipments exceeded 45 million units in 2024 and now arrive with pre-installed streaming apps. For platforms, the shift boosts engagement minutes and ad impression value, because larger screens deliver higher brand-recall metrics. The OTT market size linked to connected-TV combinations is on track to overtake mobile by 2030 if current momentum persists.
Streaming-player ecosystems such as Roku, Fire TV, and Apple TV continue to supplement televisions by adding voice search, curated FAST channels, and integrated commerce. Laptops and desktops remain niche use cases, mainly for co-viewing sports or multitasking. The device transition is reshaping production budgets toward 4K HDR originals with immersive audio, while shorter vertical-video formats are migrating to separate mobile-native networks.
By Content Genre: Live Sports Accelerate Revenue
Entertainment features and series still held the largest slice at 34.57% of 2025 viewing, yet sports is projected to expand at 12.67% CAGR through 2031. The OTT market share tied to sports should therefore rise steadily as leagues favor direct-to-consumer channels that allow them to monetize both subscription fees and in-stream advertising. Amazon’s exclusive Thursday Night Football deal and Apple’s MLS contract validate the thesis that exclusive sports events are catalysts for subscriber acquisition and churn reduction.
News remains essential but monetizes at lower ad CPMs, while education and documentary content is carving out paid niches among knowledge-seeking consumers. Cross-genre packaging under a single subscription yields stickier households, because family members with divergent preferences avoid fragmenting sign-ups across multiple providers. Consequently, mixed-catalog services enjoy lower churn than single-genre specialists.

By Streaming Resolution: 4 K Penetration Gathers Speed
High-definition 720p streams accounted for 38.29% of sessions in 2025. Fiber-to-the-home rollouts and declining panel prices are driving the growth of 4K and above at a 13.94% CAGR, making it the fastest-evolving resolution layer within the OTT market. H.266/VVC compression halves bandwidth requirements versus H.265, enabling 4K delivery even under constrained networks.[3]IEEE, “H.266/VVC Compression Standard,” ieee.org Platforms monetize the quality leap through modest price uplifts; Netflix’s USD 3 premium for Ultra HD exemplifies the upsell potential.
Standard-definition persists in bandwidth-limited markets, but its share is expected to decline as telecom operators deploy mid-band 5G and expand fiber outside metro clusters. Content makers face higher production costs up to 30% over HD, but flagship originals justify the spend by attracting high-income households willing to upgrade service tiers. As device ecosystems normalize around 4K, the OTT market size tied to premium resolutions will continue to expand.
Geography Analysis
Asia Pacific contributed 34.83% of global revenue in 2025, benefiting from 700 million internet users in India and a mature yet protected Chinese ecosystem led by Tencent Video, iQIYI, and Youku. Telco bundles and affordable data plans circumvent credit-card limitations, pushing the regional OTT market toward ad-funded models to monetize users earning less than USD 3 ARPU. Local language catalogs dominate consumption, compelling global players to partner with regional studios or set up in-house production hubs.
The Middle East is projected to clock the fastest growth at 12.64% CAGR through 2031. Vision 2030 policies in Saudi Arabia, coupled with mandatory local data hosting, spur investments in Arabic originals and studio infrastructure. MBC’s Shahid injected USD 500 million into new series during 2024, while Netflix opened a Dubai hub for Middle East and North Africa productions. In Turkey, BluTV and Gain have leveraged national content mandates to maintain their share against global entrants.
North America remains the highest-margin region with ARPU above USD 12, although 40% churn forces aggressive retention tactics like service bundles and annual billing discounts. Europe’s landscape is highly fragmented by language and quota rules, driving up localization costs. Latin America’s growth centers on Brazil, Argentina, and Mexico, yet macroeconomic volatility and currency depreciation dampen revenue forecasts in USD terms. Africa is the least penetrated region; mobile-first services such as Showmax employ data-light bitrates and mobile-money billing to build scale despite broadband gaps.

Competitive Landscape
The top five platforms, Netflix, YouTube, Amazon Prime Video, Disney+, and Tencent Video, captured roughly 55% of global streaming hours during 2025, leaving meaningful room for regional challengers. Competitive playbooks center on three key capabilities: exclusive content, personalization technology, and discounted distribution bundles. Netflix claims 80% of viewing derives from its recommendation engine, underscoring the differentiating power of AI-driven discovery. FAST specialists such as Pluto TV and Tubi exploit free ad-supported positioning to siphon time from traditional linear television.
White-space opportunities abound in underserved local languages and niche sports rights, particularly in India’s regional dialects, Arabic drama, and sub-Saharan football. Cloud-based CDNs from Amazon Web Services and Google Cloud underpin most services, enabling rapid cross-border expansion but also leading to vendor concentration risk. Regulatory moves that require in-country data centers in China, Russia, and Nigeria elevate entry barriers, potentially favoring domestic hosting providers and complicating global network optimization for smaller brands.
Regional specialists often trade at lower customer-acquisition costs due to brand familiarity and local payment integration, allowing them to pursue profitability faster than global peers. Mergers and joint ventures, such as Warner Bros. Discovery and Paramount’s 2026 Max-Paramount+ bundle, signal a new phase of cooperative competition aimed at reducing subscriber churn and rationalizing marketing spend.
Over The Top (OTT) Industry Leaders
-
Netflix Inc.
-
Google LLC (YouTube)
-
Amazon.com Inc. (Prime Video)
-
The Walt Disney Company (Disney+ and Hulu)
-
Tencent Holdings Ltd (Tencent Video)
- *Disclaimer: Major Players sorted in no particular order

Recent Industry Developments
- December 2025: Amazon Prime Video introduced an ad-supported default tier in the United States, United Kingdom, Germany, and Canada, with a USD 2.99 add-on to remove ads.
- November 2025: Warner Bros. Discovery and Paramount Global have announced plans to bundle Max and Paramount+ at a discounted price in the United States, with a target launch in Q1 2026.
- October 2025: Tencent Video launched localized services in Malaysia, Thailand, and Indonesia, backed by a USD 300 million three-year content budget.
- September 2025: Apple TV+ secured exclusive global streaming rights to the FIFA Club World Cup from 2025-2029 for roughly USD 1 billion.


Research Methodology Framework and Report Scope
Market Definitions and Key Coverage
Our study defines the global over-the-top (OTT) market as all revenue earned by Internet-delivered video, audio, and consumer VoIP services that bypass traditional broadcast or telecom carriage, including subscription, advertising-supported, transactional, and hybrid monetization models.
For clarity, we exclude device hardware sales, pay-TV subscriptions, and enterprise communication suites from the market size.
Segmentation Overview
-
By Service Type
- SVOD
- AVOD
- TVOD
- Hybrid (Subscription + Ads)
-
By Device Platform
- Smartphones and Tablets
- Smart and Connected TVs
- Laptops and Desktops
- Streaming Media Players
- Rest of Device Platforms
-
By Content Genre
- Entertainment and Movies
- Sports
- News and Information
- Education and Learning
- Rest of Content Genres
-
By Streaming Resolution
- SD (480p and Below)
- HD (720p)
- Full HD (1080p)
- 4K and Above
-
By Geography
-
North America
- United States
- Canada
- Mexico
-
South America
- Brazil
- Argentina
- Rest of South America
-
Europe
- Germany
- United Kingdom
- France
- Italy
- Spain
- Russia
- Rest of Europe
-
Asia Pacific
- China
- Japan
- South Korea
- India
- Australia
- New Zealand
- Rest of Asia Pacific
-
Middle East
- United Arab Emirates
- Saudi Arabia
- Turkey
- Rest of Middle East
-
Africa
- South Africa
- Nigeria
- Kenya
- Rest of Africa
-
North America
Detailed Research Methodology and Data Validation
Primary Research
Mordor analysts conducted interviews with OTT platform executives, telco wholesale managers, ad-tech sellers, and media buyers across North America, Europe, Asia-Pacific, and key growth economies.
Surveys of heavy streamers in tier-1 and tier-2 cities validated price ladders, ad-load norms, and subscriber migration triggers that desk work alone cannot capture.
Desk Research
We start with authoritative public sources such as ITU broadband counts, Cisco Visual Networking Index traffic volumes, national telecom-regulator datasets, and reports from bodies like the Motion Picture Association, which together anchor population, connectivity, and consumption baselines. Company 10-Ks, investor decks, and press releases then supply subscriber totals, churn cues, and average revenue per user trends.
Paid resources inside Mordor Intelligence, namely D&B Hoovers for regional splits and Dow Jones Factiva for deal flow, enrich our view where filings are sparse. Questel patent feeds or customs records help trace CDN infrastructure flows in emerging hubs. The sources named illustrate our desk layer and are not exhaustive.
Market-Sizing & Forecasting
We build a top-down demand pool from broadband households, smartphone accounts, and connected TV installs in every country. We then apply take-up rates and ARPU bands to size gross OTT spending. Select bottom-up cross-checks, supplier roll-ups, and sampled ASP x subscriber volumes ground the totals.
Key variables include mean connection speed, ad-supported viewing minutes, churn propensity, inflation-adjusted ARPU, and regulatory levies. Multivariate regression, strengthened by expert consensus and scenario analysis, projects values to 2030. Data gaps in small nations are bridged with ratios from demographically similar markets.
Data Validation & Update Cycle
Outputs pass a three-stage review: variance tests against independent indicators, senior analyst sign-off, and a refresh before every annual publication or sooner if a material event occurs.
Why Mordor's OTT Industry Size and Share Research with Trends and Analysis (Segments, Regions) Baseline Commands Reliability
Published OTT valuations rarely align, we observe, because firms differ on revenue streams counted, device inclusion, and currency timing. Our disciplined scope, transparent inputs, and yearly refresh give buyers a consistently traceable reference.
Higher figures often fold streaming hardware or broader entertainment income, while lower ones drop VoIP and ad-supported tiers or freeze exchange rates. Some providers roll forward dated subscriber surveys; Mordor's blend of fresh primary insight and clearly documented model avoids such slippage.
Benchmark comparison
| Market Size | Anonymized source | Primary gap driver |
|---|---|---|
| USD 347.1 B (2025) | Mordor Intelligence | - |
| USD 364.6 B (2025) | Global Consultancy A | Includes streaming devices and dongles in scope |
| USD 316.8 B (2024) | Trade Journal B | Excludes VoIP and ad-supported tiers; uses fixed 2023 FX rates |
The comparison shows that once scope creep and dated assumptions are stripped away, our balanced, variable-driven baseline offers decision makers a dependable foundation they can trace and replicate.


Key Questions Answered in the Report
What was the global OTT market size in 2026 and its expected value by 2031?
The OTT market size stood at USD 383.52 billion in 2026 and is projected to reach USD 626.69 billion by 2031.
Which region currently generates the largest share of OTT revenue?
Asia Pacific led with 34.83% of global revenue in 2025, thanks to mobile-first adoption and telco bundles.
Which service model is growing fastest within OTT platforms?
Hybrid tiers that mix lower subscription fees with advertising are forecast to expand at 12.81% CAGR through 2031.
Why are smart TVs gaining viewing share from mobile devices?
Affordable 4K screens and integrated streaming interfaces are driving a 13.43% CAGR for smart and connected TV usage.
How are platforms tackling high churn in North America?
Providers are bundling multiple services, offering annual plans, and securing exclusive live sports to keep viewers engaged.
Which content genre is projected to outpace others in growth?
Sports content is expected to rise at 12.67% CAGR as leagues launch direct-to-consumer channels and sign exclusive deals.
Page last updated on:


