India OOH And DOOH Market Size and Share
Market Overview
| Study Period | 2020 - 2031 |
|---|---|
| Forecast Data Period | 2026 - 2031 |
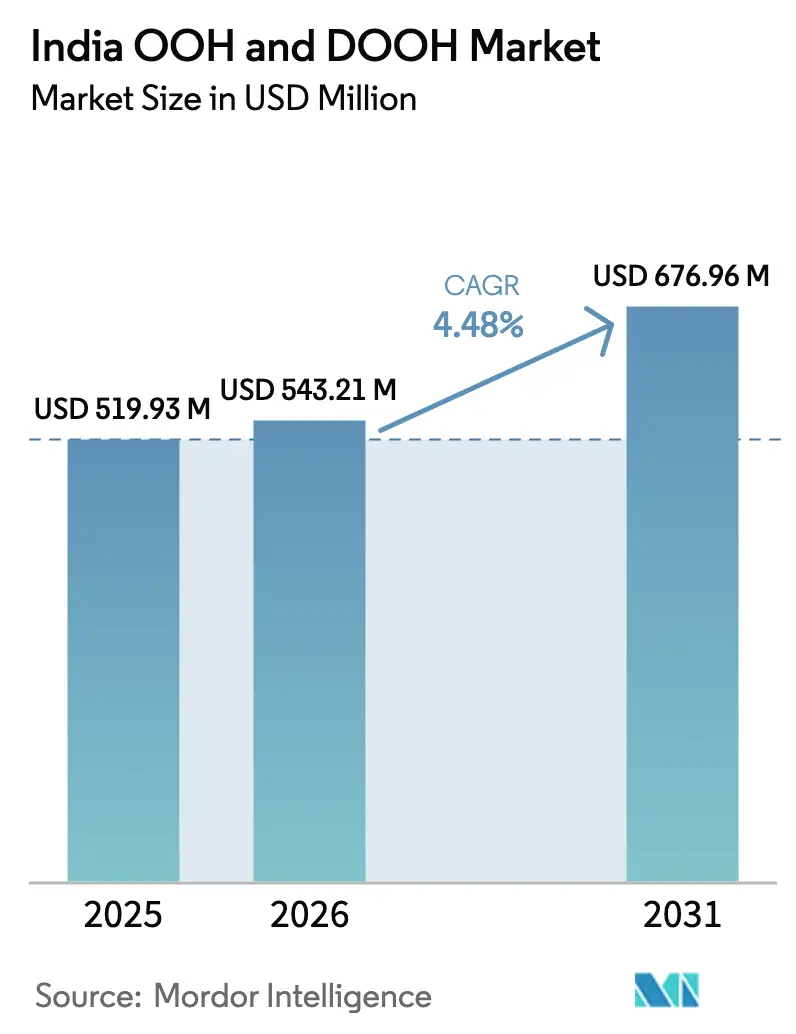
| Base Year Market Size (2025) | USD 519.93 Million |
| Market Size (2026) | USD 543.21 Million |
| Market Size (2031) | USD 676.96 Million |
| Growth Rate (2026 - 2031) | 4.48% CAGR |
| Market Concentration | Medium |
Major Players *Disclaimer: Major Players sorted in no particular order Image © Mordor Intelligence. Reuse requires attribution under CC BY 4.0. | |
India OOH And DOOH Market Analysis by Mordor Intelligence
The India OOH and DOOH Market size was valued at USD 519.93 million in 2025 and estimated to grow from USD 543.21 million in 2026 to reach USD 676.96 million by 2031, at a CAGR of 4.48% during the forecast period (2026-2031). Expansion of metro rail corridors, airport privatization, and smart-city street-furniture upgrades are collectively enlarging premium inventory, while the steady decline in LED panel costs encourages operators to replace static facades with dynamic screens. Programmatic buying tools are reducing campaign setup time and enabling granular audience targeting that was previously limited to digital and mobile channels. High-dwell settings such as airports and transit hubs are gaining strategic relevance because advertisers can serve sequential creatives during extended passenger wait times. Despite these advances, regulatory fragmentation and power-supply constraints continue to raise operating costs, tempering the full transition from traditional billboards to digital formats.
Key Report Takeaways
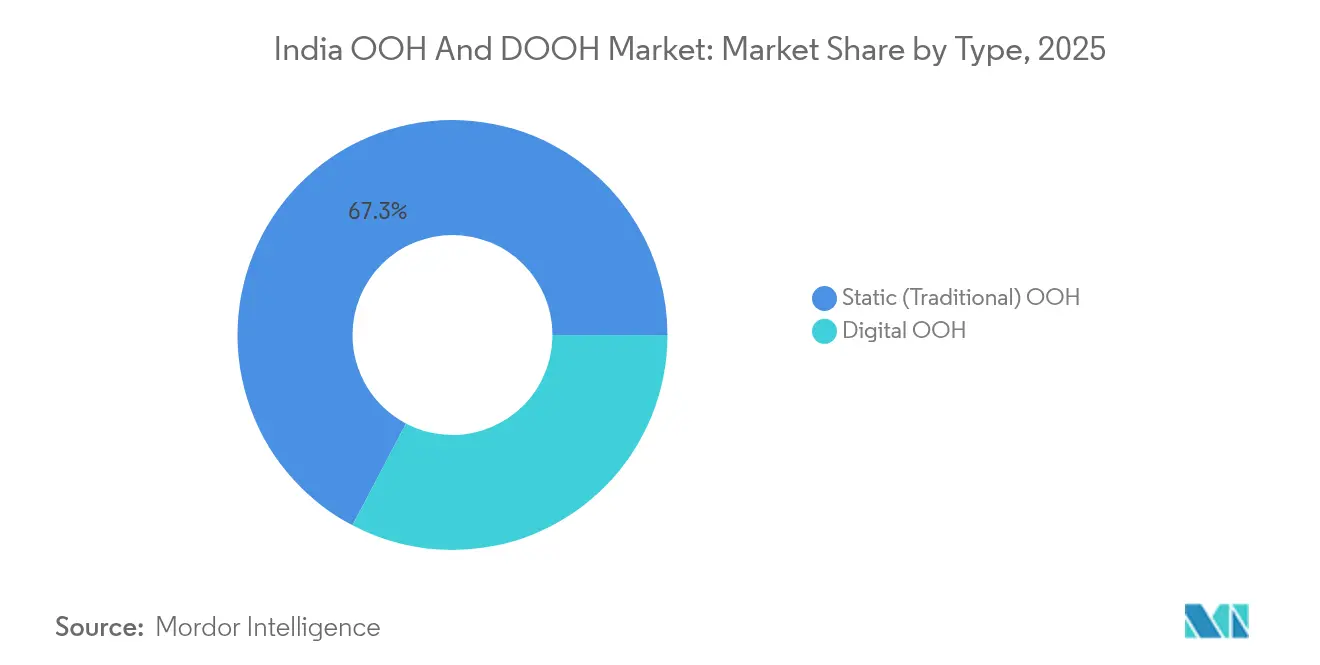
- By type, Static OOH retained a 67.30% revenue share of the India OOH and DOOH market in 2025, while Digital OOH is projected to expand at a 6.95% CAGR through 2031.
- By format, Transit media is forecast to grow at an 8.05% CAGR, outpacing billboards that held 44.20% of the India OOH and DOOH market share in 2025.
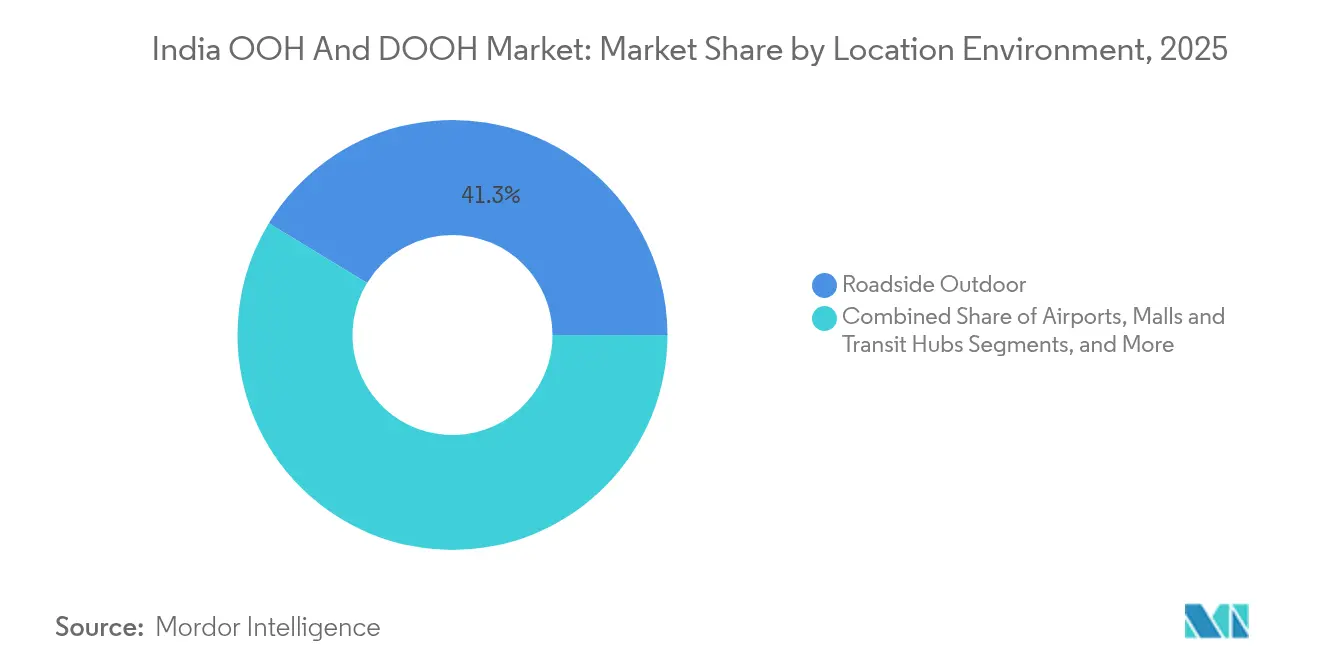
- By location environment, Airports capture the fastest growth at a 9.30% CAGR, whereas roadside outdoor platforms command 41.30% of 2025 revenue.
- By end-user sector, Retail and Consumer Goods led with 29.40% of 2025 spending; Healthcare and Pharma is the fastest-growing segment with a 6.90% CAGR forecast.
- JCDecaux, Times OOH, and Laqshya Media Group jointly controlled roughly 22% of the 2024 inventory in premium transit and airport venues of the India OOH and DOOH market.
Note: Market size and forecast figures in this report are generated using Mordor Intelligence’s proprietary estimation framework, updated with the latest available data and insights as of 2026.
India OOH And DOOH Market Trends and Insights
Drivers Impact Analysis*
| Driver | (~) % Impact on CAGR Forecast | Geographic Relevance | Impact Timeline |
|---|---|---|---|
| Urban Transit Infrastructure Expansion | +1.2% | National, with concentration in Tier-1 cities (Delhi, Mumbai, Bangalore) | Medium term (3-4 yrs) |
| Smart-City Mission Funding | +0.8% | 100 designated Smart Cities, with emphasis on Tier-2 and Tier-3 municipalities | Medium term (3-4 yrs) |
| Retail Chain Consolidation | +0.6% | Pan-India, with concentration in urban retail hubs | Short term (≤2 yrs) |
| Programmatic OOH Adoption | +1% | Metropolitan areas with high digital penetration | Medium term (3-4 yrs) |
| Falling LED Panel Costs | +0.9% | National, with initial impact in Tier-1 cities | Short term (≤2 yrs) |
| Telco Data Partnerships | +0.7% | Urban areas with high smartphone penetration | Medium term (3-4 yrs) |
| Source: Mordor Intelligence | |||
Rapid urban transit infrastructure expansion boosting high-footfall DOOH inventory
India’s network of 993 kilometers of operational metro lines, with a similar length under construction, gives advertisers access to affluent commuters in temperature-controlled environments, amplifying dwell-time advantages and flexible screen layouts.[1]Indian News Network, “India to Have World’s Second-Largest Metro Network,” indianewsnetwork.com Station domination packages, branded coaches, and integrated retail spaces are driving media-spend uplift as operators such as LIC leverage Andheri Metro’s digital screens across 12 stations to reinforce brand salience. India OOH and DOOH market benefits from 6 kilometers of new track opening every month, converting greenfield infrastructure into incremental advertising slots that carry premium CPMs. Emerging tier-2 systems, including Bhopal and Kanpur, extend similar opportunities beyond megacities. Advertisers value real-time audience metrics that combine ticketing data with mobile-location analytics, creating precise reach-and-frequency curves that rival online video.
Government Smart-City Mission funding large-format digital street furniture
The INR 48,000 crore (USD 538.10 billion) Smart Cities Mission is modernizing 100 municipalities and has installed integrated command centers that double as digital signage control hubs.[2]Restraint (~) % Impact on CAGR Forecast Geographic Relevance Impact Timeline Street-level kiosks deliver civic alerts between ad loops, raising local engagement and monetization potential without new land acquisition. Nearly 90% of 8,000 approved projects are complete, so operators can plug new panels into an existing fiber-optic backbone that lowers latency and simplifies programmatic trafficking. The India OOH and DOOH market gains capacity as municipal partners co-finance screens in exchange for public-information airtime, aligning commercial incentives with policy goals.
Retail chain consolidation driving demand for in-store digital screens
Large retailers move toward uniform in-store experiences that require centralized CMS platforms. Asian Paints has deployed 2,500 interactive kiosks that run idle-time promotional loops, reducing campaign rollout cycles by up to 60%. Amazon's mall kiosks now push real-time deals, reinforcing conversion at the last mile. These fleets are treated as a single sales channel, sold in hourly slices via PMP deals, and reported through conventional OOH dashboards. The India OOH and DOOH market counts such screens as addressable inventory that blends retail-media budgets with classic outdoor budgets, smoothing seasonality and boosting average revenue per screen.
Adoption of programmatic OOH platforms by e-commerce and OTT advertisers
JCDecaux reported a 61.8% year-on-year rise in programmatic revenue in the first half of 2024, evidencing a shift from IO-based buys to automated impressions.[3]JCDecaux SE, “2024 Half-Year Results,” jcdecaux.com Dynamic creative optimization responds to weather, traffic congestion, or match-day triggers, raising relevance scores and decreasing wasted reach. E-commerce flash-sale brands prioritize cost-per-store-visit metrics, while OTT platforms time promos to coincide with trailer drops. These tactics strengthen the India OOH and DOOH market by pulling budget from performance-digital line items rather than cannibalizing conventional OOH spend.
Restraints Impact Analysis*
| Restraint | (~) % Impact on CAGR Forecast | Geographic Relevance | Impact Timeline |
|---|---|---|---|
| Fragmented Permit Regime | -1.1% | National, with varying intensity by municipality | Long term (≥5 yrs) |
| High CapEx and Power Costs | -0.9% | National, more severe in areas with unreliable power | Medium term (3-4 yrs) |
| Limited Audience Measurement | -0.7% | National | Short term (≤2 yrs) |
| Privacy Concerns | -0.3% | Urban areas with higher digital literacy | Long term (≥5 yrs) |
| Source: Mordor Intelligence | |||
Fragmented permit regime and court-ordered takedowns of illegal hoardings
Municipal bylaws differ widely, forcing operators to manage non-uniform fee structures and documentation. The Karnataka High Court overturned a year-long blanket ban yet affirmed local oversight, creating lingering uncertainty. Pune’s Outdoor Advertising Association is contesting restrictive norms that hinder renewals. Inconsistent rulings complicate ROI modeling and can erase booked inventory overnight, constraining investment flows into the India OOH and DOOH market.
High up-front CapEx and power costs for large-format DOOH screens
Capital outlays of USD 10,000–50,000 per face and electricity expenses that approach 20% of operating cost impose steep payback hurdles outside tier-1 markets. Interruptions in grid stability compel diesel or battery backups, which raise opex by double-digit percentages. Smaller regional firms struggle to achieve screen-density economies, leading advertisers to default to static formats despite lower engagement. Such barriers slow the digital share shift within the India OOH and DOOH market, especially in cities where CPM ceilings remain below national averages.
*Our forecasts treat driver/restraint impacts as directional, not additive. The impact forecasts reflect baseline growth, mix effects, and variable interactions.
Segment Analysis
By Type: Digital disruption accelerates despite static dominance
Static OOH captured 67.30% of 2025 spending, delivering broad visibility at a modest cost. Digital OOH is forecast to grow 6.95% annually, twice the India OOH and DOOH market CAGR, driven by programmatic pipes and falling diode prices. The India OOH and DOOH market size for Digital OOH is projected to touch USD 254.41 million by 2031, reflecting advertisers’ appetite for real-time creative swaps and day-part splits. JCDecaux’s double-digit global gains validate this trajectory, and domestic integrators mirror the pattern as content-management fees drop. Static formats will hold material volume, particularly in tier-3 corridors where conversion math is still unviable.
Dynamic content improves recall, supports contextual messaging, and enables novel metrics such as dwell-time heat maps. Healthcare brands employ timestamped reminders, while auto makers synchronize unveil teasers with showroom launches. The India OOH and DOOH market continues to rely on static walls along highways where digital glare control is challenging. Operators balance hybrid networks, cross-selling bundled packs that hedge regulatory risk and stabilize cash flows.


By Format: Transit media outpaces traditional billboards
Billboards retained 44.20% of 2025 revenue, occupying signal crossroads and elevated expressways. Transit formats are expected to surge at an 8.05% CAGR, buoyed by metro-station inventories and bus-wrap innovations. The India OOH and DOOH market size for transit formats could account for 29.40% of total spend by 2031, up from 22.60% in 2025. Touch-free QR feedback panels inside trains enrich data capture while raising engagement.
Advertisers value predictable dwell periods inside stations, leveraging sequential storytelling across tunnel-walk LED ribbons. Bus shelters equipped with solar-powered displays bring video loops to suburban commuters, shrinking the urban-rural targeting gap. Billboards remain the go-to for launch bursts requiring mass reach, as exemplified by Rupa Jon’s multi-city actor-led campaign that blended monopoles with station dominations.
By Location Environment: Airports lead growth amid diverse expansion
Roadside sites produced 41.30% of 2025 billing, but airports are on course for a 9.30% CAGR thanks to rising passenger numbers and privatisation upgrades. The India OOH and DOOH market share for airports is projected to exceed 12.15% by 2031, almost doubling the 2025 level. Chennai, Goa, and Noida concessions signal aggressive bidding for exclusive contracts that guarantee long tenures.
Airlines and credit-card brands favor airport inventory for targeting high-affluence segments, applying time-based triggers during peak check-in periods. Malls and theme parks exhibit parallel momentum, especially where foot-traffic analytics justify CPM premiums. Cinema halls, spurred by a 15% recovery in in-cinema ad revenues during FY24, complement outdoor reach with indoor immersion.
By End-User Industry: Healthcare challenges retail’s dominance
Retail and Consumer Goods commanded 29.40% of 2025 spending and routinely activate festival bursts that synchronize store windows with outdoor creatives. Healthcare and Pharma is on a 6.90% CAGR path as vaccine, diagnostic, and wellness brands invest in trust-building visuals. The India OOH and DOOH market size for healthcare messaging is anticipated to reach USD 92.73 million by 2031, bolstered by patient-centric awareness drives.
Automotive continues to use skyline-level sites to showcase new models with high-luxury cues. BFSI leverages metro station signage to push digital banking propositions near commuter hot spots. Media and Entertainment platforms schedule countdown clocks on digital billboards to build excitement for OTT premieres, harnessing live APIs for instant creative swaps. Government agencies employ tactical bursts for civic drives such as traffic-safety weeks, reinforcing OOH’s role as a public-information staple.
Geography Analysis
Delhi, Mumbai, and Bangalore collectively account for more than 55.00% of the 2025 spend, anchored by dense commuter volumes and mature metro services. The Delhi Metro’s forthcoming 2-corridor addition, costing INR 8,399 crore (USD 98.25 billion), widens the capital’s ad footprint and intensifies demand for in-station LEDs, WION. The India OOH and DOOH market is growing rapidly in Hyderabad and Pune, where new ring-road projects open fresh billboard parcels.
Smart-city interventions in tier-2 hubs such as Indore, Surat, and Lucknow install integrated command centers that unify traffic sensors with digital kiosks, making screen deployment logistics easier. Southern and eastern states require multilingual creatives, prompting advertisers to schedule regional scripts across the same loop. This localization advances incremental revenue while keeping the national brand identity intact.
Airport construction in regional centers adds premium inventory beyond traditional metros. Laqshya’s deal at Noida International Airport and Times OOH’s Chennai concession underline appetites for early-stage positions. Such moves rebalance the India OOH and DOOH market away from a metro-centric concentration, although regulatory inconsistencies persist. Smaller municipalities impose disparate fee structures, challenging large-scale roll-outs until policy harmonization materializes.
Competitive Landscape
The competitive setting remains moderately concentrated, with the top five operators holding under one-quarter of total revenue. JCDecaux leverages global insights and recorded a 10.9% rise in adjusted Q3 2024 revenue to EUR 948.2 million (USD 1.097 billion), with DOOH making up 38.5% . Times OOH and Laqshya Media Group dominate domestic airport and metro rights, creating high barriers for late entrants.
Xtreme Media emphasizes turnkey LED solutions and software stacks, riding the surge in digital conversions. AdOnMo’s USD 25 million capital raise aims to double its screen network to 100,000 units across 40 cities, indicating scale-up momentum in tech-led inventory. Smaller regional outfits specialize in hyperlocal static clusters, appealing to SME advertisers seeking neighborhood visibility.
Strategic priorities center on exclusive concessions, proprietary CMS platforms, and audience measurement partnerships. Telco tie-ups promise deterministic data that could recalibrate media plans against digital video budgets. Sustainability narratives gain traction as operators quantify lower emissions per impression for DOOH compared with online video, providing an emerging differentiator within the India OOH and DOOH market.
India OOH And DOOH Industry Leaders
JCDecaux SE
Laqshya Media Group
Times OOH
AdOnMo
Dentsu (Posterscope)
- *Disclaimer: Major Players sorted in no particular order

Recent Industry Developments
- January 2025: T-Mobile acquired Vistar Media for approximately USD 600 million to merge telecom data with DOOH programmatic delivery.
- January 2025: AET Displays launched its AT 55" MIP Display under the QUANTUM series, enabling 2K to 8K scalability for quick DOOH rollouts.
- December 2024: India’s operational metro network crossed 993 kilometers, with another 997 kilometers under construction across 51 cities India.
- October 2024: Parle Agro executed a 360-degree Smoodh Lassi campaign over 70 markets using 21 media formats, reaching 67 million people.


Research Methodology Framework and Report Scope
Market Definitions and Key Coverage
Our study defines India's out-of-home (OOH) advertising market as all paid display media that reach audiences while they are outside their homes; it merges traditional roadside, transit, and street-furniture panels with dynamic digital-out-of-home (DOOH) screens that stream programmatic or scheduled content in the same public spaces. Values are expressed in constant 2025 US dollars at net media-owner revenue, which is how we, at Mordor Intelligence, track spend for consistency.
Scope exclusion: In-cinema spots, pop-up mall activations, online video or social media placements, and event sponsorships sit outside this scope.
Segmentation Overview
- By Type
- Static (Traditional) OOH
- Digital OOH
- Programmatic OOH
- Others
- By Format
- Billboards
- Street Furniture
- Transit Advertising
- Place-Based Media
- By Location Environment
- Roadside Outdoor
- Airports
- Malls and Transit Hubs
- In-Store / Indoor Venues
- Others (Cinema, Stadiums)
- By End-User Industry
- Automotive
- Retail and Consumer Goods
- Healthcare and Pharma
- BFSI
- Media and Entertainment
- Government and Public Sector
- Other End Users
Detailed Research Methodology and Data Validation
Primary Research
We spoke with media-owner executives across Tier-1 cities, specialist OOH agencies, programmatic platform managers, and senior brand buyers in retail, automotive, and BFSI. Their insight on occupancy cycles, yield rates, and screen replacement costs validated assumptions drawn from secondary material and filled key data gaps.
Desk Research
First, our analysts harvest baseline figures from open sources such as the Ministry of Information & Broadcasting's ad-spend handbook, the Indian Outdoor Advertising Association's inventory audit, passenger throughput data from the Airports Authority of India, traffic counts from the Ministry of Road Transport and Highways, and census-based urban mobility tables. Company filings, investor decks, and news captured through Dow Jones Factiva round out supply shifts and screen roll-outs.
Next, we enrich those signals with D&B Hoovers revenue extracts, Volza shipment logs for imported LED modules, and Tenders Info notices that preview new concessions. The sources named are illustrative; many additional records inform our desk work.
Market-Sizing & Forecasting
A top-down reconstruction starts with 2024 audited net revenue, aligned with macro indicators: urban population, GDP per capita, and brand ad-spend ratios to size the demand pool. Targeted bottom-up checks, such as average selling price multiplied by lit-screen square footage and roadside-panel counts, temper the totals. Core model drivers include annual digital screen installations, traffic-volume growth, advertising cost inflation, programmatic share of DOOH spots, and regulatory limits on roadside inventory. Five-year projections emerge from multivariate regression blended with ARIMA smoothing and are stress-tested against scenarios echoed in our interviews.
Data Validation & Update Cycle
Outputs pass variance checks versus historic growth corridors and media-mix benchmarks before a senior reviewer signs off. We refresh the model every year and trigger interim updates when material events surface, ensuring clients receive the latest calibrated view.
Why Mordor's India OOH And DOOH Baseline Commands Reliability
Published estimates often differ because firms select unequal scopes, pricing bases, and refresh cadences.
Key gap drivers here include certain studies folding event sponsorship income into OOH totals, others tracking only DOOH screens, and some applying headline rate cards without occupancy discounts; Mordor reports net media-owner revenue and updates annually, which gives a steadier baseline.
Benchmark comparison
| Market Size | Anonymized source | Primary gap driver |
|---|---|---|
| USD 519.9 M (2025) | Mordor Intelligence | |
| USD 1 340.1 M (2024) | Regional Consultancy A | Adds in-store activations and sponsorship fees, uses gross spend surveys |
| USD 706.7 M (2024) | Trade Journal B | Excludes street furniture and place-based screens, partial price discounting |
| USD 282.6 M (2024) | Industry Association C | Tracks digital screens only, omits static panels |
These contrasts show that Mordor's disciplined scope alignment, pragmatic variable choice, and yearly refresh deliver a balanced, transparent baseline decision-makers can rely on.


Key Questions Answered in the Report
What is the current size of the India OOH and DOOH market?
The market is valued at USD 543.21 million in 2026 and is forecast to reach USD 676.96 million by 2031, reflecting a 4.48% CAGR.
Which segment is growing fastest within the industry?
Transit media registers the highest growth with an 8.05% CAGR as metro, airport, and bus infrastructures expand.
How important is Digital OOH compared with static formats?
Digital OOH grows at 6.95% annually, outpacing static formats and benefiting from programmatic buying, though static still holds 67.30% of 2025 revenue.
Why are airports critical to advertisers?
Airports deliver high-dwell, affluent audiences, enabling premium campaigns as reflected in a 9.30% CAGR forecast for airport-based inventory.
Page last updated on:


