India Residential Construction Market Size and Share
Market Overview
| Study Period | 2020 - 2031 |
|---|---|
| Forecast Data Period | 2026 - 2031 |
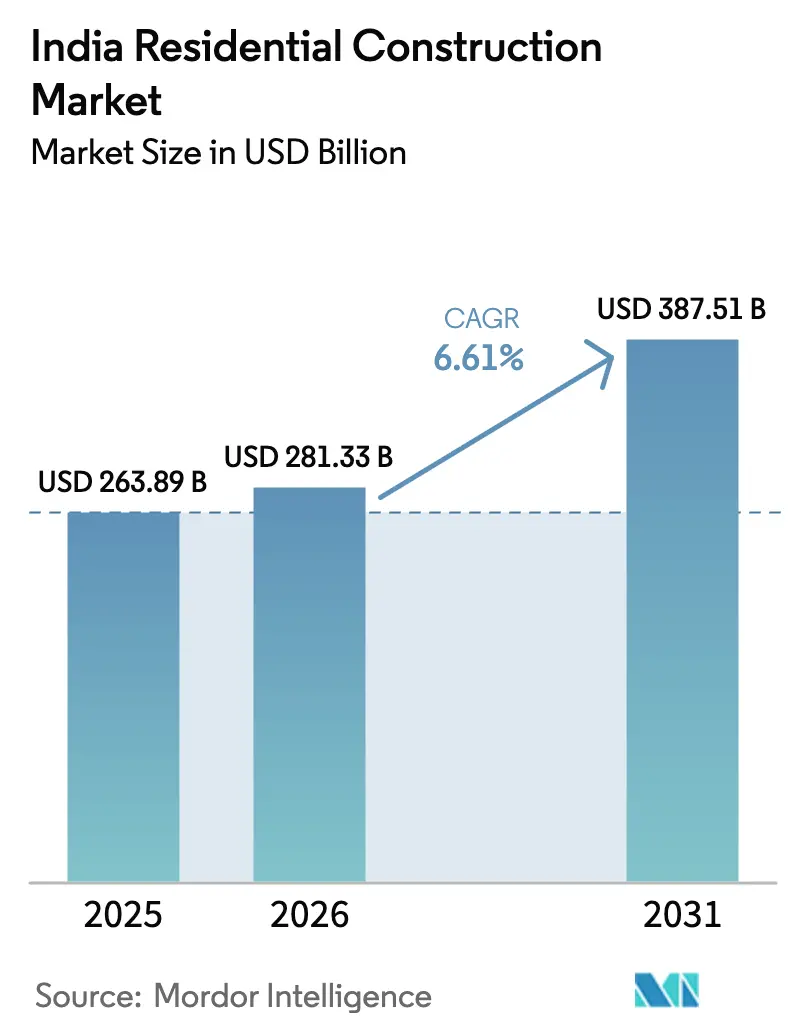
| Base Year Market Size (2025) | USD 263.89 Billion |
| Market Size (2026) | USD 281.33 Billion |
| Market Size (2031) | USD 387.51 Billion |
| Growth Rate (2026 - 2031) | 6.61% CAGR |
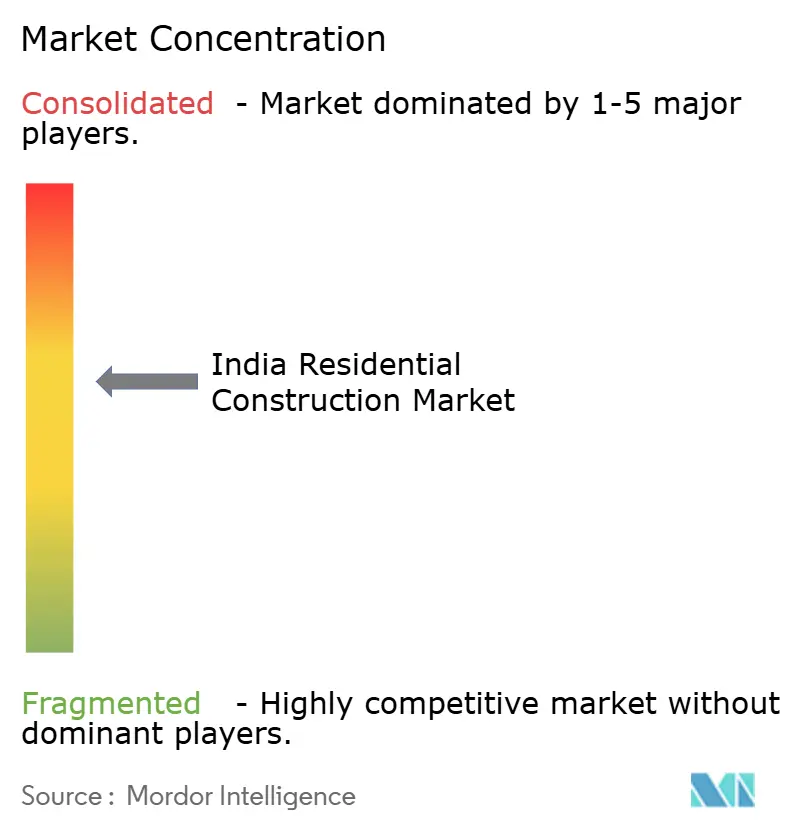
| Market Concentration | Medium |
Major Players *Disclaimer: Major Players sorted in no particular order Image © Mordor Intelligence. Reuse requires attribution under CC BY 4.0. | |
India Residential Construction Market Analysis by Mordor Intelligence
The India Residential Construction Market size was valued at USD 263.89 billion in 2025 and is estimated to grow from USD 281.33 billion in 2026 to reach USD 387.51 billion by 2031, at a CAGR of 6.61% during the forecast period (2026-2031).
Balance-sheet discipline is strengthening the India residential construction market, with top-listed developers cutting their average net-debt-to-equity ratio to 0.05 in FY25, a level that encourages equity raises and land purchases. A cumulative 125 basis-point policy-rate reduction since February 2025 has lowered mortgage costs and revived mid-income and affordable demand, even while premium launches accelerate in core metros. Public spending remains pivotal: the FY26 Union Budget committed USD 11.8 billion to an Urban Challenge Fund and USD 1.8 billion to SWAMIH Fund 2, bolstering urban-housing pipelines and clearing stalled projects. Premiumization is redistributing revenue toward high-ticket apartments; units above USD 118,000 captured 62% of value in H1 2025, compressing inventory cycles in Mumbai and Delhi NCR while widening affordability gaps in tier-2 locations.
Key Report Takeaways
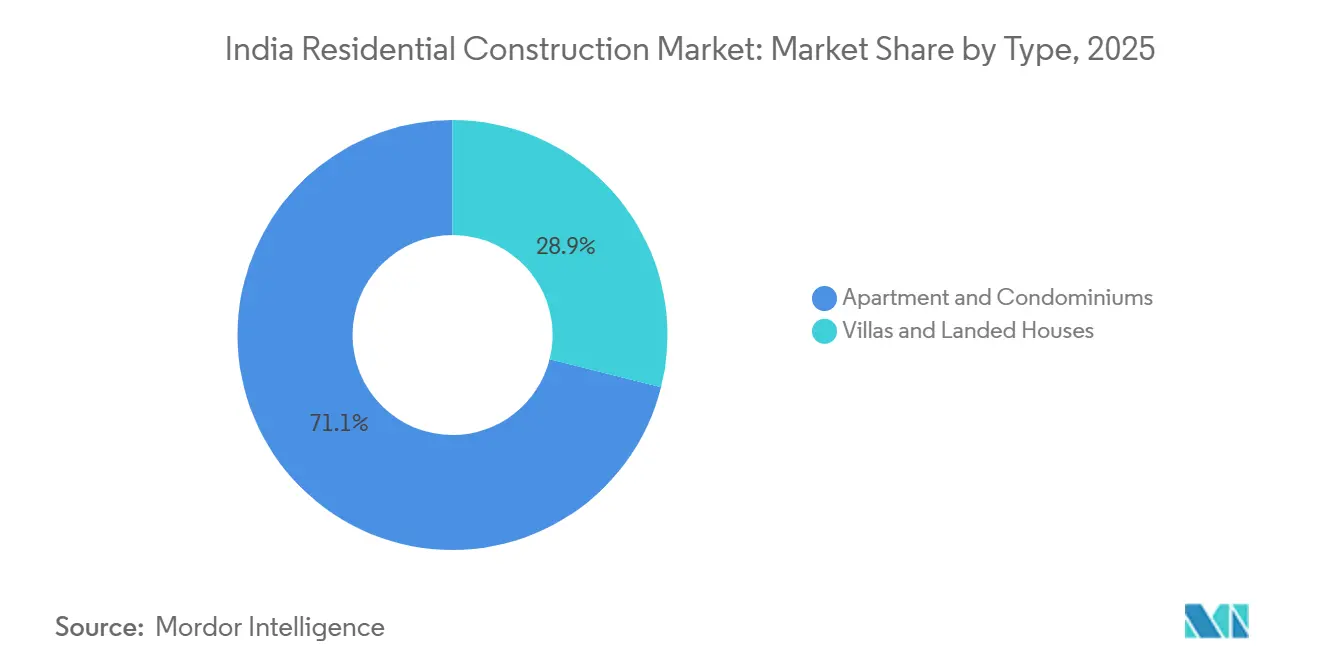
- By type, apartments and condominiums led with 71.1% of India residential construction market share in 2025, while villas and landed houses are forecast to expand at a 6.97% CAGR to 2031.
- By construction type, new builds accounted for an 81.2% share of the India residential construction market size in 2025; renovation is advancing at a 7.05% CAGR through 2031.
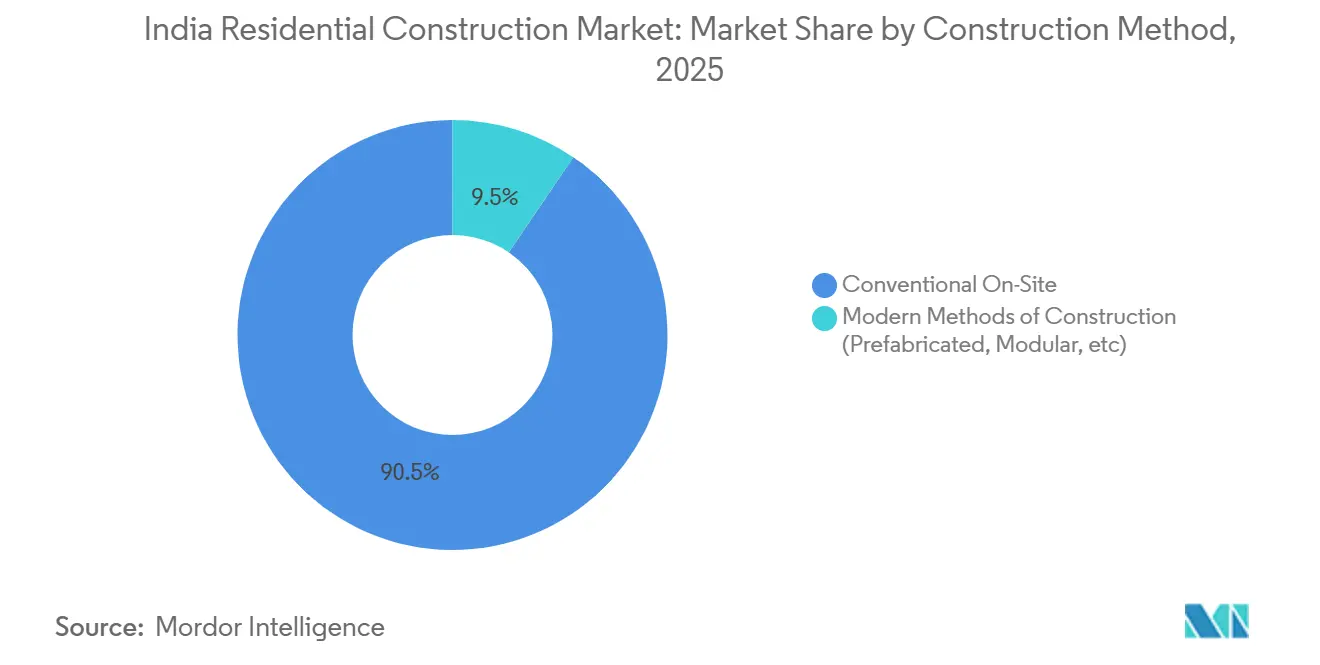
- By construction method, conventional on-site techniques held 90.5% of the market in 2025, whereas modern prefabricated and 3D-printed systems are projected to grow at a 7.21% CAGR to 2031.
- By investment source, private capital dominated with 83.4% in 2025; public-sector work linked to PMAY-Urban 2.0 is poised to rise at a 6.82% CAGR to 2031.
- By city, the Mumbai Metropolitan Region commanded a 22.8% share in 2025, and Hyderabad is set to post the fastest 7.41% CAGR between 2026-2031.
Note: Market size and forecast figures in this report are generated using Mordor Intelligence’s proprietary estimation framework, updated with the latest available data and insights as of 2026.
India Residential Construction Market Trends and Insights
Drivers Impact Analysis*
| Drivers | (~) % IMPACT ON CAGR FORECAST | Geographic Relevance | Impact Timeline |
|---|---|---|---|
| Urban infrastructure buildout, unlocking new micro-markets | +1.5% | Pan-India, with early gains in Hyderabad, Pune | Long term (≥ 4 years) |
| Premiumization of demand in higher-ticket segments | +1.2% | Mumbai, Delhi NCR, Bengaluru, Pune | Medium term (2–4 years) |
| PMAY-Urban 2.0 pipeline for affordable housing | +1.1% | Tier-1 and Tier-2 cities nationwide | Medium term (2–4 years) |
| Shift toward taller, denser projects that lift land-use efficiency | +1.0% | Mumbai, Bengaluru, Pune, Hyderabad | Medium term (2–4 years) |
| Digitization that accelerates sales velocity and collections | +0.9% | Major metros | Short term (≤ 2 years) |
| Source: Mordor Intelligence | |||
Urban Infrastructure Buildout Expanding New Micro-Markets
Transport corridors are redrawing demand maps. The FY26 budget earmarked USD 11.8 billion for an Urban Challenge Fund dedicated to metro extensions and expressways [1]Press Information Bureau, “Infrastructure Allocations for Metro and Expressways,” pib.gov.in. Hyderabad’s Kokapet district illustrates the uplift; Godrej Properties’ 5-acre site, acquired via e-auction, holds USD 490 million in revenue potential, leveraging nearby IT hubs. Similar patterns in Pune and Delhi NCR show price spikes of 17% in Q2 2025, where new lines cut commute times. Developers monetize peri-urban tracts at lower land-cost bases while preserving premium pricing through enhanced connectivity.
Premiumization of Demand Increasing Launches and Realizations
High-ticket housing is concentrating revenue in fewer projects. Units priced above USD 118,000 captured 63% of value in Q4 2025, up from 53% a year earlier. Listed developers booked USD 19.1 billion in FY25, with DLF and Prestige already securing nearly half of FY26 sales targets in Q1. Kolte-Patil lifted its average selling price by 11% to USD 99 per square foot in Q3 FY25 through luxury launches. Faster churn shortens holding periods, yet affordability gaps in tier-2 markets compel firms to adopt joint-development pacts and plotted-land offerings. Overall, premiumization boosts margin resilience and reinforces brand segmentation.
PMAY-Urban 2.0 Pipeline Supporting Affordable and Mid-Income Demand
Approved in August 2024, PMAY-Urban 2.0 targets 10 million homes and allocates USD 27.1 billion in subsidies. Credit-linked grants and rental incentives stabilize sales in the USD 36,000-60,000 bracket, cushioning the India residential construction market against cyclical softness in luxury segments. SWAMIH Fund 2’s USD 1.8 billion corpus is unclogging delayed schemes, adding ready inventory, and lowering litigation risk. Affordable builds increasingly pursue IGBC Green Affordable Housing tags to unlock faster approvals and subsidy access. The public pipeline serves as a counter-cyclical anchor, ensuring construction continuity across downturns.
Shift Toward Taller and Denser Projects Enhancing Land Economics
Regulatory easing is unlocking vertical potential. Karnataka’s February 2026 reform permits floor-area ratios up to 5.2 on 30-meter roads, offering 40-50% more saleable area in Bengaluru. Mumbai’s October 2025 rule raises automatic high-rise clearance to 180 meters, slashing approval times. Sunteck Realty’s USD 294 million Andheri-Kurla parcel targets USD 1.43 billion revenue, equal to USD 168 million per acre, achievable only through high-density layouts. Taller towers support premium amenities that command pricing premiums, further widening margins and encouraging adoption of advanced formwork and tower-crane systems.
Restraints Impact Analysis*
| Restraints | (~) % IMPACT ON CAGR FORECAST | Geographic Relevance | Impact Timeline |
|---|---|---|---|
| High land acquisition costs are squeezing margins | -1.3% | Mumbai, Delhi NCR, Bengaluru | Medium term (2-4 years) |
| Financing costs and credit tightening are slowing launches | -0.8% | Nationwide, sharper in tier-2 cities | Short term (≤ 2 years) |
| Construction input inflation and labor shortages | -0.7% | Nationwide, seasonal peaks | Short term (≤ 2 years) |
| Source: Mordor Intelligence | |||
High Land Acquisition Costs Pressuring Feasibility
Developers purchased 2,335 acres for USD 468.7 million in 2024, averaging USD 2 million per acre; Mumbai plots cost USD 4.6 million per acre, 2.3 times the national mean. Total development capital tied to these buys tops USD 733.3 million, forcing greater reliance on revenue-sharing pacts. Godrej Properties stitched 12 such agreements in 2024 worth USD 275.9 million in potential bookings[2]Moneycontrol, “2024 Land Deals Cross INR 397 Billion,” moneycontrol.com. Joint ventures lower upfront cash yet introduce profit splits and coordination risk, making feasibility more sensitive to market slowdowns.
Elevated Financing Costs and Credit Tightening Delaying Starts
While the repo rate stands at 5.25%, system-wide housing-loan growth slowed to 12% in H1 FY26 amid stricter underwriting. NBFC credit expansion is forecast at 13-15%, below prior-year peaks, reflecting regulatory scrutiny and rising delinquencies. Smaller builders lacking investment-grade ratings face longer sanction cycles and higher spreads, delaying groundbreaks. Buyer borrowing in tier-2 cities is equally affected, prolonging decision timelines and dampening affordable-segment volumes.
*Our forecasts treat driver/restraint impacts as directional, not additive. The impact forecasts reflect baseline growth, mix effects, and variable interactions.
Segment Analysis
By Type: Apartments Dominate While Villas Outpace in Growth
Apartments and condominiums accounted for 71.1% of India's residential construction market share in 2025, reflecting land scarcity and buyer preference for managed amenities. Villas and landed houses are forecast to post the fastest 6.97% CAGR to 2031 as families seek larger private spaces near expanded expressways. Bengaluru, Pune, and Hyderabad lead villa uptake; Embassy’s USD 12.2 million parcel in North Bengaluru adds plotted extensions to its township, capturing lifestyle-oriented buyers [3]Embassy Group, “Embassy Springs Expansion Announcement,” embassyindia.com.
Apartment demand is fragmenting by ticket size. Luxury towers priced above USD 590,000 grew 8% year-on-year in H1 2025, while mid-income absorption slowed under affordability stress. Hybrid row-house and duplex formats blur lines, giving developers flexibility to monetize land efficiently. Integrated townships now allocate up to 30% of space to villas, balancing aspiration and density economics.


By Construction Type: New Builds Lead, Renovation Accelerates
New construction represented 81.2% of India residential construction market size in 2025, underscoring the housing shortfall in fast-urbanizing metros. Renovation, though smaller, is expanding at a 7.05% CAGR through 2031 as 1980s-era buildings undergo seismic and energy retrofits. Mumbai co-operative redevelopments swap old units for modern towers, freeing surplus sellable area that funds the rebuild.
State single-window portals introduced in 2025 trimmed approval times for greenfield sites, spurring new-build momentum. Retrofit work benefits from IGBC Green Residential certification, which can cut energy bills 20-30% and secure soft loans [IGBC.IN]. Specialized facade and MEP contractors are scaling to serve this demand, creating a parallel value chain alongside new construction majors.
By Construction Method: Conventional Remains Pre-eminent, Modern Methods Gain Niches
Traditional on-site methods held a 90.5% share in 2025, supported by deep contractor networks and regulatory familiarity. Prefabricated and 3D-printed systems are set to grow at 7.21% CAGR, driven by defence and disaster-relief pilots. IIT-Gandhinagar and CPWD showcased 3D-print prototypes in September 2025, yet high equipment costs and code gaps limit mass uptake.
Affordable-housing agencies deploy modular units to shave 6-9 months off schedules, but private buyers remain cautious about resale value. Conventional techniques retain an edge in design flexibility and labor absorption, although rising wages could tilt economics toward factory-built solutions over the next decade.
By Investment Source: Private Capital Dominates, Public Projects Gather Pace
Private players captured 83.4% of spending in 2025, buttressed by improving leverage metrics; the top developers’ net-debt-to-equity of 0.05 enables opportunistic land buys. Blackstone’s USD 21.2 million first tranche for 40% of Kolte-Patil exemplifies institutional faith in scalable platforms.
Public-sector builds tied to PMAY-Urban 2.0 are climbing at 6.82% CAGR, with subsidy-linked projects in tier-2 cities bridging affordability gaps. IGBC certification is now a prerequisite for many state tenders, pushing sustainability standards deeper into the supply chain.
Geography Analysis
Market value remains clustered, with Mumbai, Delhi NCR, Bengaluru, Pune, and Hyderabad jointly exceeding 60% in 2025. Mumbai’s premium corridors, such as South Mumbai and Bandra-Kurla, maintain liquidity despite land prices of USD 4.6 million per acre, pushing developers into vertical mixed-use towers that amortize high entry costs. Regulatory easing that raised automatic high-rise thresholds is catalyzing taller projects, as illustrated by Sunteck’s USD 1.43 billion scheme near the airport.
Hyderabad offers the fastest expansion, with 7.41% CAGR through 2031, driven by tech-sector payrolls and liberal FAR. Godrej’s cumulative USD 796 million investment across three parcels signals national interest. Delhi NCR’s 17% YoY price surge aligns with metro and expressway deliveries that turn fringe zones into 60-minute commutes.
Tier-1 dynamics are mirrored in Bengaluru and Pune, where recent floor-area hikes unlock vertical redevelopment along arterial roads, supporting high-density formats attractive to institutional funds. Chennai, Kolkata, and a broad Rest-of-India cohort show steadier gains, lifted by PMAY-Urban 2.0 subsidies and plotted-land offerings. Infrastructure maturity now dictates city-level absorption more than macroeconomic swings, anchoring the India residential construction market in location-specific fundamentals.
Competitive Landscape
Competition is moderate but tightening. The top 10 listed firms aim for USD 17.5 billion in FY26 pre-sales and achieved 30% in Q1, signaling robust execution. Balance-sheet repair underpins land aggression; leverage ratios at decade lows let firms lock prime plots before rivals. Technology is the new differentiator, with BIM adoption mandated on public contracts above USD 2.9 million, encouraging private replication for clash detection and compliance.
Private equity is speeding up consolidation. Blackstone’s planned USD 212 million, 66% play for Kolte-Patil validates appetite for platform deals, while Aurum’s USD 10.2 million PropTiger buy folds brokerage reach into a larger PropTech stack. Strategy diverges: large caps double down on luxury towers to monetize expensive land, whereas mid-caps pivot to revenue-sharing and plotted projects to stay capital-light. Sustainability also shapes rivalry; Godrej Properties reports a fully certified green portfolio, raising the bar for eco-friendly credentials.
Tier-2 cities emerge as the next battleground. PMAY-Urban 2.0 pipelines lure national entrants seeking volume, and regional outfits with local approvals partner or sell stakes to retain relevance. Institutional funds prefer joint ventures with organized developers to manage execution risk, implying further migration of share toward top-tier brands over the medium term.
India Residential Construction Industry Leaders
DLF Ltd
Godrej Properties Ltd
Prestige Estates Projects
Brigade Enterprises
Sobha Ltd
- *Disclaimer: Major Players sorted in no particular order

Recent Industry Developments
- February 2026: Lodha Group acquired 80% of Solidrise Realty for USD 3.5 million, marking its Pune entry and leveraging new expressway and metro plans .
- January 2026: Sunteck Realty bought a 1.75-acre Mumbai parcel near the airport for a project worth USD 294 million, targeting luxury demand in a transit-rich corridor.
- December 2025: Godrej Properties secured a 5-acre Kokapet plot in Hyderabad with USD 490 million revenue potential via an e-auction.
- January 2025: Indiabulls Real Estate merged with Embassy Group entities, forming a pan-India platform spanning residential and commercial pipelines.


India Residential Construction Market Report Scope
| Apartments/Condominiums |
| Villas/Landed Houses |
| New Construction |
| Renovation |
| Conventional On-Site |
| Modern Methods of Construction (Prefabricated, Modular, etc) |
| Public |
| Private |
| Mumbai Metropolitan Region |
| Delhi NCR |
| Pune |
| Bengaluru |
| Hyderabad |
| Chennai |
| Kolkata |
| Rest of India |
| By Type | Apartments/Condominiums |
| Villas/Landed Houses | |
| By Construction Type | New Construction |
| Renovation | |
| By Construction Method | Conventional On-Site |
| Modern Methods of Construction (Prefabricated, Modular, etc) | |
| By Investment Source | Public |
| Private | |
| By City | Mumbai Metropolitan Region |
| Delhi NCR | |
| Pune | |
| Bengaluru | |
| Hyderabad | |
| Chennai | |
| Kolkata | |
| Rest of India |


Key Questions Answered in the Report
How fast will housing demand grow in tier-2 cities such as Hyderabad and Pune through 2031?
Hyderabad is projected to deliver a 7.41% CAGR, while Pune benefits from new metro lines and expressways that raise mid-income absorption.
What drives the recent spike in premium apartment launches across Mumbai and Delhi NCR?
High-income growth, infrastructure upgrades, and land-cost economics push developers toward luxury segments where margins offset plot prices.
How big is the opportunity in renovation and redevelopment schemes?
Renovation holds 18.8% share today but is expanding at a 7.05% CAGR as 1980s-era buildings in Mumbai and Delhi undergo seismic and energy retrofits.
Which construction technologies are gaining traction beyond conventional methods?
Prefabricated modules and 3D-printed concrete show 7.21% CAGR potential, first in public housing and disaster relief before wider private use.
How is public funding influencing affordable-housing supply?
PMAY-Urban 2.0’s USD 27.1 billion subsidy pool and SWAMIH Fund 2’s USD 1.8 billion resolution corpus are catalyzing starts in the USD 36,000-60,000 bracket, balancing premium market concentration.
Page last updated on:


