Market Overview
| Study Period | 2020 - 2031 |
|---|---|
| Forecast Data Period | 2026 - 2031 |
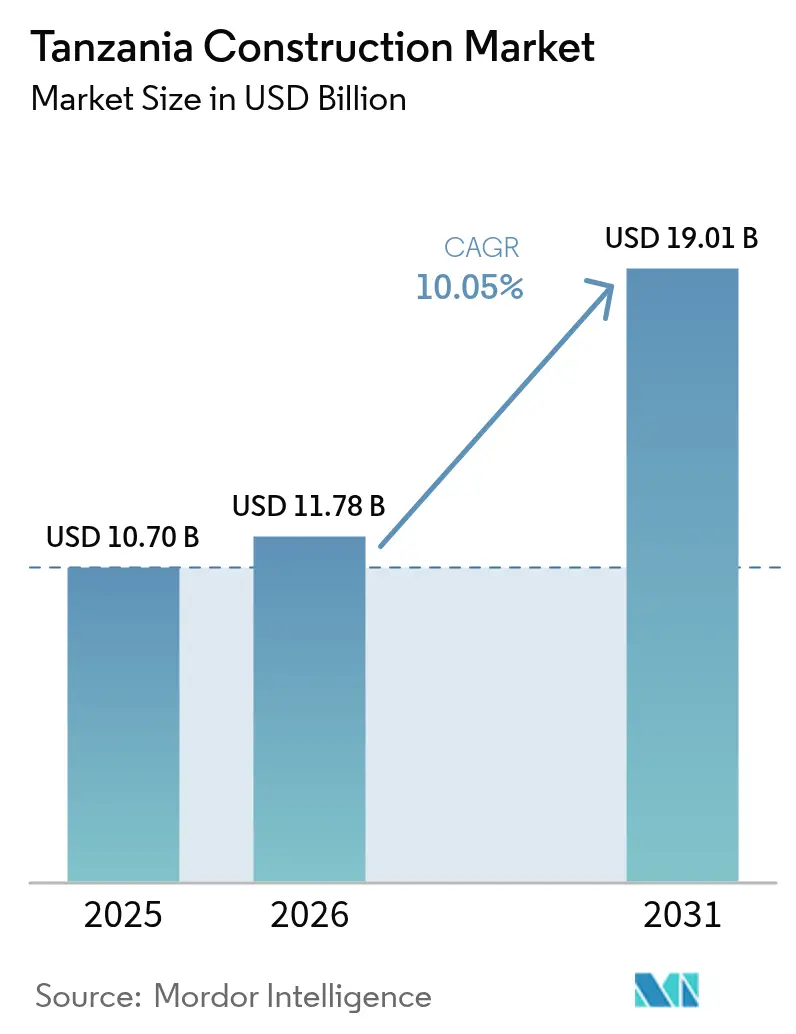
| Base Year Market Size (2025) | USD 10.70 Billion |
| Market Size (2026) | USD 11.78 Billion |
| Market Size (2031) | USD 19.01 Billion |
| Growth Rate (2026 - 2031) | 10.05% CAGR |
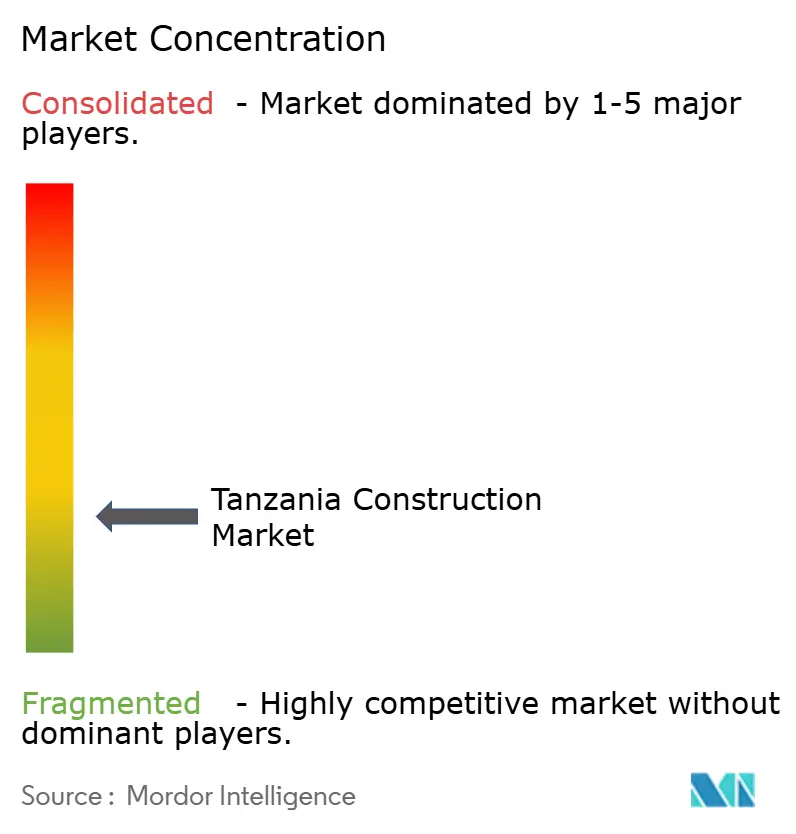
| Market Concentration | Low |
Major Players *Disclaimer: Major Players sorted in no particular order Image © Mordor Intelligence. Reuse requires attribution under CC BY 4.0. | |
Tanzania Construction Market Analysis by Mordor Intelligence
The Tanzania Construction market size is expected to grow from USD 10.70 billion in 2025 to USD 11.78 billion in 2026 and is forecast to reach USD 19.01 billion by 2031 at 10.05% CAGR over 2026-2031. Momentum stems from Tanzania’s lower-middle-income transition, steady public spending, and a reform agenda that now attracts deeper private capital. Infrastructure projects such as the Standard Gauge Railway and Julius Nyerere Hydropower Project continue to dominate order books, while affordable housing policies, green building incentives, and modern construction methods provide new demand layers. Growing urban populations, particularly in Dar es Salaam, expand the pipeline for residential and mixed-use schemes, and the gradual adoption of prefabrication is beginning to compress project cycles. At the same time, material-price volatility and pockets of skilled-labour shortages weigh on near-term margins, nudging developers toward closer supplier partnerships, wider use of local inputs, and more formal training programs. Competitive intensity remains high, with international contractors leading megaprojects and local firms consolidating around mid-sized civil works.
Key Report Takeaways
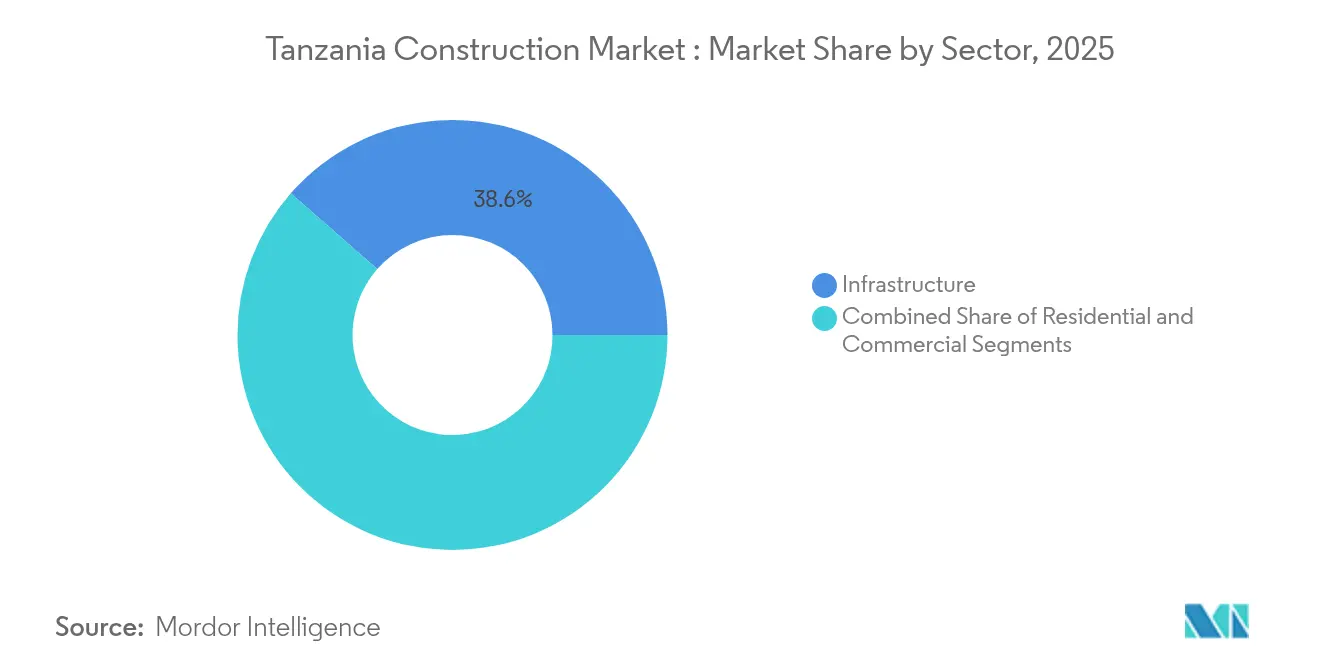
- By sector, Infrastructure captured 38.55% of the Tanzania construction market share in 2025. Tanzania construction market size for infrastructure is projected to grow at 11.32% CAGR between 2026-2031.
- By construction type, New construction captured 83.40% of the Tanzania construction market share in 2025. Tanzania construction market size for new construction is projected to grow at 10.12% CAGR between 2026-2031.
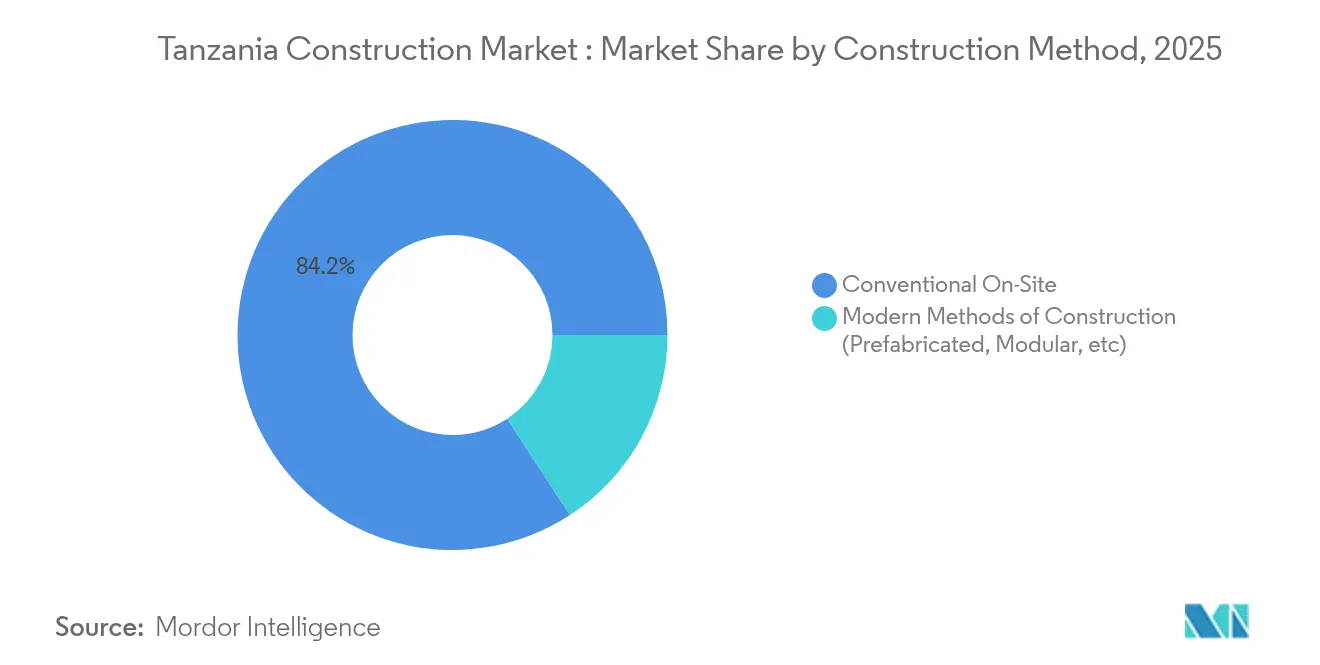
- By construction method, Conventional on-site techniques captured 84.20% of overall market revenue in 2025. Tanzania construction market size for modern construction methods is projected to grow at 13.35% CAGR between 2026-2031.
- By investment source, Public funding captured 64.30% of total 2025 spending. Tanzania construction market size supported by private investment is projected to grow at 11.95% CAGR between 2026-2031.
- By geography, Dar es Salaam captured 37.60% of 2025 activity. Tanzania construction market size in the Central and Lake Zones is projected to grow at 11.75% CAGR between 2026-2031.
Note: Market size and forecast figures in this report are generated using Mordor Intelligence’s proprietary estimation framework, updated with the latest available data and insights as of 2026.
Tanzania Construction Market Trends and Insights
Drivers Impact Analysis*
| Drivers | (~) % Impact on CAGR Forecast | Geographic Relevance | Impact Timeline |
|---|---|---|---|
| Sustained government infrastructure investment & PPP expansion | +3.2% | National; Dar es Salaam, Dodoma, transport corridors | Long term (≥ 4 years) |
| Rising urbanization & affordable-housing programs | +2.5% | Dar es Salaam, Northern Zone, Lake Zone | Medium term (2-4 years) |
| Growth in power generation & transmission build-out | +1.8% | National; Southern Highlands, Central Zone | Medium term (2-4 years) |
| Nationwide scale-up of road, rail, port, and airport links | +2.4% | Economic corridors, coastal ports | Long term (≥ 4 years) |
| Source: Mordor Intelligence | |||
Sustained Government Infrastructure Investment and Expansion of Public–Private Partnerships (PPPs)
Tanzania’s 2024/25 budget prioritizes flagship civil works, and revisions to the PPP Act have removed key procedural frictions, prompting an uptick in registered projects and accelerating job creation.[1]Planning Commission, “Annual Development Plan 2024/25" The Tanzania Electronic Investment Window shortens lead times for approvals, while the scrapping of 374 minor fees trims project overheads. Robust PPP pipelines are emerging across rail, energy, and logistics corridors, giving private operators a clearer revenue-risk profile that aligns with multilateral lending guidelines. These frameworks underpin the Tanzania construction market’s ability to mobilize long-tenor finance, improve cost recovery, and accommodate life-cycle maintenance provisions.
Rising Urbanization and Government-Backed Affordable Housing Initiatives Across Major Cities
Dar es Salaam’s population of nearly 5 million and a national housing deficit of 3 million units underpin the case for scaled residential delivery. Funding flowing to the Samia Housing Scheme and National Housing Corporation projects broadens mortgage access and stimulates institutional demand for serviced land trade.gov. Pension-fund-backed Watumishi Housing Investment is replicating a rent-to-own model across 19 regions, illustrating how the Tanzania construction market now absorbs diversified financing channels. Rising disposable incomes, coupled with new zoning rules that encourage higher-density projects, further support multi-family and mixed-use formats.
Steady Growth in Power Generation and Transmission Infrastructure to Meet Energy Demand
Completion of the 2,115-MW Julius Nyerere Hydropower Project in 2025 will add significant baseload supply and unlock secondary construction around transmission lines and industrial estates. Rural electrification has already lifted access to 43%, driving demand for sub-stations, small-scale renewable plants, and distribution upgrades. The Tanzania construction market therefore benefits from a positive feedback loop where new power capacity spurs manufacturing growth, which in turn requires more warehouse, factory, and ancillary infrastructure.
Nationwide Scale-Up of Transport Infrastructure Including Roads, Rail, Ports, and Airports
Tanzania is witnessing a significant scale-up of its transport infrastructure, encompassing roads, railways, ports, and airports. Notable initiatives include Phase 4 of the Standard Gauge Railway (SGR), 2,000 km of planned national highways, and port dredging at Lake Victoria, which collectively underpin a multi-modal strategy aimed at enhancing regional trade connectivity. This infrastructure expansion is being supported by innovative financing mechanisms such as the Samia Infrastructure Bond, valued at approximately USD 58 million (TZS 150 billion), reflecting the government's growing reliance on market-based instruments to mobilize domestic capital for public works. These initiatives are driving a robust construction pipeline, improving equipment utilization rates and sustaining order visibility for contractors, thereby strengthening the medium- to long-term growth prospects of the Tanzania construction market.
Restraints Impact Analysis*
| Restraint | (~) % Impact on CAGR Forecast | Geographic Relevance | Impact Timeline |
|---|---|---|---|
| Volatility in Construction Material Prices Driven by Global and Regional Disruptions | -1.2% | National, with greater impact in inland regions | Short term (≤ 2 years) |
| Skilled Labour Shortages Across Engineering, Project Management, and Technical Trades | -0.8% | National, more severe in emerging construction hubs | Medium term (2-4 years) |
| High Dependence on Imported Equipment and Materials Increasing Project Costs and Delays | -0.6% | National, with concentration in major infrastructure projects | Medium term (2-4 years) |
| Source: Mordor Intelligence | |||
Volatility in Construction Material Prices Driven by Global and Regional Disruptions
Cement prices rose to USD 7.5 per bag even as capacity climbed past 9.1 million tonnes, highlighting supply-chain and tax-related distortions thecitizen.co.tz. Steel inputs mirror this pattern. Although upstream projects such as Liganga iron ore and Mchuchuma coal aim to localize production, the Tanzania construction market remains vulnerable to import duty shifts and logistics bottlenecks. Developers respond by negotiating index-linked contracts, batching material orders earlier, and exploring alternative aggregates to manage cost exposure.
Skilled Labour Shortages Across Engineering, Project Management, and Technical Trades
A persistent mismatch between Technical and Vocational Education and Training curricula and site-level competencies constrains delivery timelines, especially for complex civil works researchgate.net. Wage gaps and gender imbalances further reduce the available talent pool. Capacity-building interventions now focus on structured apprenticeships, supervisory-skills upgrades, and bundled contractor financing that embeds on-the-job training clauses. These measures will temper the near-term drag but will require concerted stakeholder coordination to close the skills gap fully.
*Our forecasts treat driver/restraint impacts as directional, not additive. The impact forecasts reflect baseline growth, mix effects, and variable interactions.
Segment Analysis
By Sector: Infrastructure Sustains Leadership Through Flagship Civil Works
Infrastructure accounted for 38.55% of 2025 spending, giving the segment the single largest Tanzania construction market share. The World Bank’s USD 200 million backing for the Dodoma Integrated and Sustainable Transport project underscores ongoing multilateral support and is forecast to lift city output by 2% once completed. Such investments positions infrastructure to deliver an 11.32% CAGR until 2031. This growth path hinges on corridor connectivity gains, spill-over benefits from port expansion, and the maturing PPP framework that channels private capital into toll roads and logistics parks. The Tanzania construction market therefore views infrastructure as both demand stabilizer and innovation testbed, particularly for digital project-management systems.
Residential construction ranks second by value. The government seeks to close a 3 million-unit deficit through policy incentives and public land release. Mortgage reforms, combined with National Housing Corporation projects valued at USD 400 million, expand credit penetration, while mixed-income projects broaden addressable demand. Commercial space trails both sectors and grapples with 70% office occupancy in Dar es Salaam, leading landlords to pivot toward flexible floorplates and co-working formats. Retail supply is increasingly bundled into mixed-use precincts, as exemplified by Peninsula Plaza’s USD 12 million scheme. These dynamics echo a gradual repositioning within the Tanzania construction market as developers adopt multi-asset risk hedging.


By Construction Type: New Builds Dominate as Greenfield Demand Outpaces Renovations
New construction retained an 83.40% share in 2025, reflecting the Tanzania construction market size bias toward foundational infrastructure and new housing stock. At a projected 10.12% CAGR, new projects will remain the primary earnings engine, anchored by the Annual Development Plan that allocates USD 6.3 billion for civil and social facilities. Public agencies prefer greenfield builds to meet stringent capacity benchmarks, while private developers deploy new schemes to capture first-mover pricing in emerging districts.
Renovation work is comparatively small yet strategically important. Port-upgrade contracts such as the Kigoma Port refurbishment worth USD 16.7 million focus on throughput gains and safety standards. Building-retrofit demand is rising too, with corporate tenants requesting energy audits ahead of lease renewals. Although margins can be higher, project fragmentation and legacy-building documentation challenges limit scale. Nonetheless, targeted incentives for energy-efficient retrofits could widen the revenue base for specialized contractors within the Tanzania construction market.
By Construction Method: Modern Techniques Accelerate but Conventional Builds Remain Predominant
Conventional on-site approaches held 84.20% of revenue in 2025. Familiarity, established supply chains, and readily available labour explain the dominance, especially on small and mid-sized sites. However, evolving building codes and stricter delivery schedules are pushing developers to reconsider methodology. Prefabricated housing kits now appear in government-led social-housing programs, validating factory-assembled structural systems in the Tanzania construction market.
Modern construction methods command only 15.80% of current spending yet are forecast to climb at a 13.35% CAGR to 2031. Prefabrication shortens project cycles, cuts waste, and improves occupational safety metrics. Research indicates that scaling such approaches hinges on standardized design templates, digital inventory tracking, and adaptive policy support. Early adopters report improved bankability as financiers recognize lower completion risk. While upfront capital costs are higher, value-engineering savings and quicker tenant occupancy bolster net economics, helping to anchor the Tanzania construction market’s transition toward industrialized building systems.
By Investment Source: Public Spending Dominates but Private Capital Gains Velocity
Public allocations represented 64.30% of 2025 activity, cementing the state’s orchestrating role in national build-out. Treasury commitments focus on social facilities, transport corridors, and strategic energy assets. Project-preparation units within ministries collaborate more closely with lenders to meet disclosure and environmental standards, a practice that reduces delay risk across the Tanzania construction market.
Private investment, though smaller, will grow the fastest at a 11.95% CAGR to 2031 as PPP reforms kick in. Domestic banks are scaling syndicated-loan desks for sizable deals, and capital-market regulators are enabling infrastructure-bond listings. Challenges persist around pipeline transparency and bankable concession structures, yet early success stories in toll-road and port berths demonstrate improving feasibility. The rising role of corporate green bonds and pension-fund vehicles suggests a diversified funding mix that will reshape future contract structures within the Tanzania construction market size narrative.
Geography Analysis
Dar es Salaam accounted for 37.60% of total construction turnover in 2025, driven by its position as a national trade gateway, a dense residential base, and consistent demand for commercial and logistics spaces. Despite a dip in prime office rents to USD 15/m², high-end residential rentals continued to rise, underscoring a bifurcated sub-market dynamic. Developers are actively repositioning towards mixed-use precincts and last-mile logistics hubs, in response to the growth of e-commerce and urban delivery needs. While Dar es Salaam is expected to retain its core status in the national construction landscape, escalating land prices and traffic congestion are encouraging spillover growth into peri-urban districts. The city is projected to grow at a CAGR of 11.62% from 2026 to 2031, sustaining its lead through high-value urban and infrastructure investments.
The Central Corridor, anchored by Dodoma’s role as the administrative capital, is set to headline future growth alongside the Lake Zone. Government-led developments such as the Government City in Mtumba, paired with multilateral-backed infrastructure initiatives—including highways and airports—are expanding the region’s construction footprint. Notably, airport modernization in Dodoma is expected to reinforce its connectivity to inland trade routes.
The Lake Zone, including cities such as Mwanza, is emerging as a key inland logistics and industrial hub. The region is experiencing a construction surge driven by upgrades to Lake Victoria ports and associated transport corridors. Airport enhancements in Mwanza further improve its regional trade function. The Southern Highlands, notably Mbeya and Iringa, are leveraging infrastructure spillovers from the Julius Nyerere Hydropower Project, which is stimulating the development of agro-processing estates and local housing. Meanwhile, Zanzibar is accelerating infrastructure activity with a USD 210 million road upgrade program covering 103.5 km, designed to unlock tourism corridors and drive localized development. While smaller in scale, these regions play a vital role in decentralizing demand, contributing to multi-regional resilience across the Tanzania construction market.
Competitive Landscape
The competitive field remains fragmented, with top international firms dominating landmark projects and a long tail of domestic contractors handling feeder roads, municipal facilities, and public-housing lots. China Civil Engineering Construction Corporation, Sinohydro, and Yapi Merkezi command strong project pipelines, supported by export-credit financing and turnkey delivery capacity. Local contractors, while numerous, face working-capital constraints and limited equipment fleets. Government policy now reserves select road contracts for Tanzanian entities, including dedicated quotas for female-owned firms; this intervention is gradually improving indigenous capacity.
Strategic positioning is increasingly thematic. International players focus on rail, hydropower, and deep-water terminals where scale efficiencies matter. Domestic firms target schools, health clinics, and mid-rise housing, capitalizing on localized procurement rules. Green building and affordable-housing solutions present new whitespace, supported by the Tanzania Green Building Council and International Finance Corporation financing lines. Engineering, Procurement, and Construction contracts that align with FIDIC clauses are now mainstream in megaproject bidding.
Risk-sharing structures are evolving as lenders demand stronger cost-overrun protections and performance guarantees. Digital tools such as Building Information Modeling and drone-based site monitoring are slowly entering high-value projects, improving stakeholder visibility and dispute resolution speeds. Labour-market tightness is prompting firms to invest in in-house academies and collaborate with vocational institutes. Overall, the Tanzania construction market sees intensifying competition converging with capability upgrades that collectively raise delivery standards.
Tanzania Construction Industry Leaders
Advent Construction Ltd
Estim Construction Co. Ltd
Becco Limited
Salem Construction Limited
Mohammedi Builders Ltd
- *Disclaimer: Major Players sorted in no particular order

Recent Industry Developments
- April 2025: The World Bank approved USD 200 million for the Dodoma Integrated and Sustainable Transport project, targeting improved mobility and more than 10,000 jobs
- February 2025: Shimizu Corporation secured a USD 16.7 million contract to renovate Kigoma Port, enhancing passenger movement on Lake Tanganyika
- December 2024: Tanzania and CRDB Bank launched the USD 60 million Samia Infrastructure Bond to finance road upgrades via TARURA
- October 2024: JICA extended a USD 27 million grant for the Dodoma City Inner Ring Road, adding 6.5 km of new or widened carriageway


Research Methodology Framework and Report Scope
Market Definitions and Key Coverage
Our study treats the construction sector in Tanzania as the value of works put in place across residential, commercial, industrial, and civil infrastructure segments, no matter whether projects are publicly or privately financed and whether activity is on-site or off-site prefabricated. The figure reflects contractor revenues reported or imputed at the site level, net of VAT and adjusted to 2024 prices before conversion to current-year US dollars.
Scope exclusion: mining extraction facilities and specialized oil and gas EPC works are kept outside this universe to avoid double counting.
Segmentation Overview
- By Sector
- Residential
- Apartments/Condominiums
- Villas/Landed Houses
- Commercial
- Office
- Retail
- Industrial and Logistics
- Others
- Infrastructure
- Transportation Infrastructure (Roadways, Railways, Airways, others)
- Energy & Utilities
- Others
- Residential
- By Construction Type
- New Construction
- Renovation
- By Construction Method
- Conventional On-Site
- Modern Methods of Construction (Prefabricated, Modular, etc)
- By Investment Source
- Public
- Private
- By Region (Tanzania)
- Dar es Salaam
- Dodoma & Central Corridor
- Northern Tanzania
- Lake Zone
- Rest of Tanzania
Detailed Research Methodology and Data Validation
Primary Research
We interviewed site engineers in Dar es Salaam, project finance advisors in Nairobi, and building-material distributors active in the Lake Zone. Their insights on prevailing day rates, imported steel lead times, and modern method adoption filled data gaps and grounded model assumptions in lived market realities.
Desk Research
Mordor analysts began with macro inputs from the Tanzania National Bureau of Statistics, Bank of Tanzania monetary releases, and Ministry of Works capital budget documents, complemented by trade data from UN Comtrade and project notices posted by TANROADS, TIC, and AfDB. Company filings and tender disclosures were reviewed through D&B Hoovers and Dow Jones Factiva to benchmark unit rates and contractor backlogs. Academic papers on cement intensity per square meter and peer-reviewed studies on urban housing demand supplied engineering coefficients. These titles illustrate rather than exhaust the secondary pool; dozens of additional open datasets and journals supported cross-checks.
Market-Sizing and Forecasting
A top-down build used national gross fixed capital formation and government development budget execution to reconstruct construction outlays, which were then split by sector using building permit filings, cement dispatch records, and TIC registered project values. Supplier roll-ups of sampled average selling prices multiplied by estimated square meter completions gave a bottom-up sense check. Key drivers, public infrastructure allocation, urban housing deficit, cement price trend, and exchange rate outlook, anchor a multivariate regression that projects demand to 2030. Shortfalls in informal sector data were bridged by applying labor force survey shares validated during interviews.
Data Validation and Update Cycle
Outputs pass three rounds of anomaly checks, peer review, and variance reconciliation with headline indicators before sign-off. Reports refresh every twelve months, with interim amendments when policy shifts or project announcements materially alter the baseline.
Why Our Tanzania Construction Baseline Earns Dependability
Published market numbers often diverge because firms start from different scopes, index years, and currency treatments.
Key gap drivers we observe include: some publishers fold the entire informal self-build market into their totals, others restrict themselves to vertical buildings while ignoring roads and power plants, and a few retain historical values in constant shillings yet quote them in nominal US dollars, which inflates growth during depreciation cycles. By contrast, Mordor's framework aligns scope with national accounting boundaries, applies verified average selling prices, and refreshes forecasts annually, keeping estimates comparable and current.
Benchmark comparison
| Market Size | Anonymized source | Primary gap driver |
|---|---|---|
| USD 10.70 B | Mordor Intelligence | |
| USD 12.19 B | Regional Consultancy A | Includes informal self-build activity and uses spot exchange rate without deflator adjustment |
| USD 5.62 B | Trade Journal B | Excludes civil infrastructure and relies on limited building permit sample |
These contrasts show that once scope alignment and currency discipline are enforced, the figures converge toward Mordor's middle ground baseline that policy planners and investors can reliably act upon.


Key Questions Answered in the Report
What is the current size of the Tanzania construction market in 2026?
The market is valued at USD 11.78 billion in 2026 and is on track to reach USD 19.01 billion by 2031.
Which sector holds the largest share of construction spending in 2025?
Infrastructure leads with 38.55% of 2025 revenue, anchored by projects such as the Standard Gauge Railway and Julius Nyerere Hydropower Plant.
How fast is private investment growing compared with public funding during 2026-2031?
Private capital is projected to expand at a 11.95% CAGR during 2026-2031, outpacing the overall market despite public projects still accounting for 64.30% of 2025 spend.
Which regions will see the quickest construction growth through 2031?
The Central and Lake Zones show the fastest trajectory, forecast to post an 11.75% CAGR on the back of Dodoma’s capital relocation and port upgrades around Lake Victoria.
What are the main challenges facing developers today?
Volatile cement and steel prices, plus a persistent skilled-labour shortage, are squeezing margins and extending project timelines.
How are modern construction methods impacting the market through 2031?
Prefabricated and modular techniques, though only 15.80% of current activity, are expected to grow at a 13.35% CAGR as developers seek faster delivery and lower waste.
Page last updated on:


